

Abstract
The purpose of this study was to develop a radiomics signature for distinguishing stage in advanced colon cancer (CC). 195 colon cancer patients were enrolled in this study (stage III, n = 146 vs. stage IV, n = 49) and divided into training cohort (n = 136) and validation cohort (n = 59). A total of 286 radiomic features were extracted from tumor and LN images. A radiomics signature was generated using the least absolute shrinkage and selection operator (LASSO) technique. The relationship between radiomics signature and CC staging was explored using a kernel-based support vector machine (SVM) classifier model. The classification performance was assessed by accuracy and the receiver operating characteristics (ROC) curve. A total of 5 features (2 for tumor and 3 for LN) were selected among 286 features. Radiomics signature built from extracted features successfully differentiated stage III from stage IV CC with no known distant metastases on imaging preoperatively. Furthermore, the SVM classifier model generated using tumor and LN images together achieved better performance than the tumor alone, with accuracies of 86.03% vs. 78.68% and 83.05% vs. 76.27% in training and validation cohorts, respectively. In ROC analysis, the model showed a significant improvement for training (AUC 89.16% vs. 69.5%) and validation cohorts (AUC 75.15% vs. 55%) in comparison with the combined analysis and the tumor alone. In conclusion, the radiomics signature based on preoperative CT may distinguish stage III from stage IV CC with no known distant metastases. In addition, the radiomic features from combined images achieved better classification performance than tumor alone.
Keywords: Colon cancer, staging, computed tomography, radiomics, metastatic lymph node
Introduction
Colon cancer (CC) is the fourth most common cancer and ranks fifth in causes of cancer related death globally according to World Health Organization (WHO) in 2018, accounting for an estimated more than one million new cases and 551,269 deaths [1]. Radical resection is referred as a standard treatment for early stage CC without lymph node (LN) metastasis [2]. Once LN metastasis occurs, CC is considered as stage III, and the standard therapy involves complete resection of the primary tumor and regional LNs plus postoperative adjuvant chemotherapy. When tumor metastases spread to one or more distant sites, regardless of nodal involvement, the tumor is identified as stage IV. Despite considerable development in the treatment of metastatic CC, most cases are not curable, and the five-year survival is limited to 13% [2,3]. Therefore, the aim of treatment in stage IV is to extend survival and improve the quality of life by means of complicated and systemic therapies [4]. Obviously, an accurate preoperative staging to distinguish stage III and stage IV CC is essential for effective treatment strategy [5].
In clinical practice, CC patients routinely undergo preoperative computed tomography (CT) scans for assessment and staging of tumors by evaluating regional invasion and distant metastasis [6]. However, small distant metastatic tumors cannot be accurately identified by pre-operative CT imaging, leading to an inaccurate diagnosis of some patients. In this case, the metastasis is identified during intraoperative exploration and postoperative pathological diagnosis. Besides, there are several difficulties for the assessment of metastatic LNs in CT images. Although LNs larger than 1 cm diameter in CT scan was identified as metastatic LNs in CT diagnosis [7], the value of CT data for the evaluation of LNs in patients with CC remained poor with a diagnostic accuracy from 54% to 73% [7,8]. Moreover, the criteria for metastatic LNs using CT data are inconsistent [9]. Therefore, there is an urgent need for better tools to improve preoperative staging.
In recent years, radiomics has become a powerful tool that can objectively and comprehensively evaluate tumor heterogeneity by extracting high-throughput quantitative features from medical images through data characterization algorithms [10-13]. These features have the potential to reveal disease characteristics and provide valuable information for personalized staging, therapy, and prognosis. The radiomics is a complex process including distinct steps with definable inputs and outputs, such as image acquisition, reconstruction, segmentation, features extraction and qualification, analysis, and model building. Due to non-invasive and low-cost properties of radiomics, the related research has advanced dramatically and is widely utilized in various clinical fields with satisfactory results such as hepatocellular carcinoma, head and neck cancer, nasopharyngeal carcinoma, glioblastoma, and pancreatic tumors [14-18].
Some previous studies have already investigated radiomics signature on the preoperative staging of cancer, but they focus only on the primary tumor image itself [19-21]. It is well known that LN status is a crucial factor for the staging of CC [22]. Therefore, the aim of this study is to develop a radiomics signature based on preoperative CT data of primary tumor and LN data compared with postoperative pathological diagnosis and evaluate the predictive value in preoperative staging (stage III vs. stage IV) of CC.
Materials and methods
Patients
Ethical approval was obtained from the medical ethics committee of our institution for this retrospective study, and informed consent was obtained from all subjects. 598 consecutive patients diagnosed with CC who received colectomy with en bloc removal of regional LNs between January 2014 and May 2018 in Affiliated Hospital of Qingdao University were chosen for this study. We collected their pre-treatment CT images and postoperative pathological records. All the patients were admitted according to the patient recruitment pathway using the inclusion and exclusion criteria described in Figure 1. A total of 195 patients, including 112 males (mean age, 61.08 ± 13.42 years; age range, 17~85 years) and 83 females (mean age, 62.87 ± 11.45 years; age range, 28~87 years) were incorporated into our study and divided into training and validation cohorts while maintaining similar distribution of the patient imaging characteristics in each group.
Figure 1.
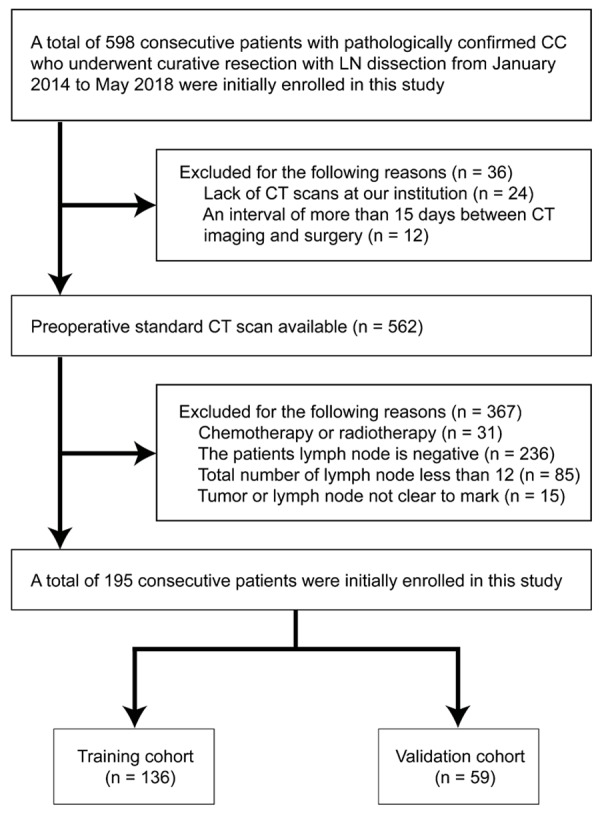
Recruitment pathway for patients in this study.
Clinical data, such as age, gender, and primary tumor site, were collected by reviewing medical records. Histologic grade, T and N stages were obtained from pathological reports directly. Tumor staging was established postoperatively by surgical oncologists and pathologists. Tumor staging was defined according to the American Joint Committee on Cancer (AJCC) TNM staging system, the 8th edition [22]. Determination of metastatic LN using CT images is usually a difficult and complicated procedure. Therefore, we followed a clinical procedure for diagnosis: first, LNs in preoperative CT images were marked; then, target LNs were collected and divided into different groups during operation; lastly, the metastatic LNs were verified postoperatively by experienced pathologists. Our study workflow steps are shown in Figure 2.
Figure 2.

The workflow of necessary steps in the current study. Image segmentation is performed on CT images. Experienced radiologists delineate ROI covering the whole tumor and metastatic LN by stacking up the region of interest slice by slice. The quantitative features are extracted from the tumor and LN regions on the CT images, including texture, structure and wavelet representation. The significant features were identified using LASSO regression. The performance of the classifier was evaluated measuring accuracy, sensitivity, specificity, F1-score, and ROC analysis. The SVM classifier model was used to predict the stage of CC patients using radiomics features obtained from conventional CT image.
CT image acquisition and pre-processing
Before receiving radical resection of tumor, all patients underwent CT scan with a 64-slice spiral CT scanner (Somatom Sensation 64, Siemens Medical Systems, Erlangen, Germany). The CT scan parameters were as follows: 120 kV; 200 effective mAs; beam collimation of 64 × 0.6 mm; a matrix of 512 × 512; a pitch of 0.8; and a gantry rotation time of 0.5 s. The slice thickness of the image was 5.0 mm. We introduced “ITK-SNAP” for this task [23]. Radiologists with over 10 years of experience in interpreting abdominal radiology examined each layer of the CT images of the patients and outlined all tumor and metastatic LN regions and performed manual segmentation in each layer [24] (Figure 3). Due to the difficulty of metastatic LN diagnosis using CT data, LNs were first marked in preoperative CT images, then collected during the surgery, and finally verified postoperatively by pathological diagnosis. The intensity levels in these regions of interests (ROIs) were normalized and used in subsequent feature extraction for further analysis.
Figure 3.
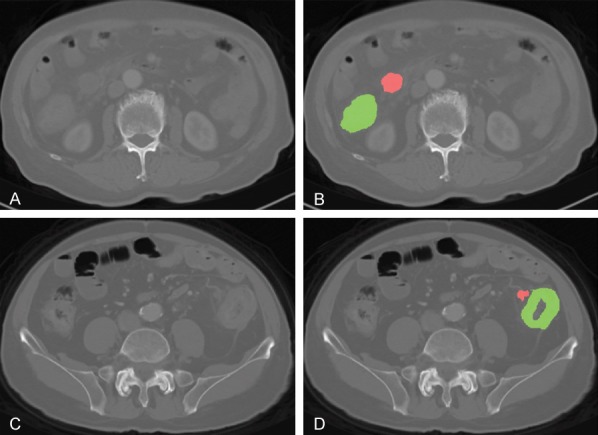
An example of manual segmentation of primary tumor (green regions) and lymph node (red regions) on colon cancer CT images. (A, C) and (B, D) are raw and marked CT image of stage III and IV patients.
Feature extraction
In this study, we utilized five major categories of radiomics features: first order statistics (FOS), gray-level co-occurrence matrix (GLCM), gray-level run-length matrix (GLRM), local binary pattern (LBP) and fractal dimension (FD) to portray characteristics of the CT images. Originally proposed by Haralick et al. [25], GLCM features were calculated from gray-level co-occurrence matrix, which represents joint probabilities of two pixels on a specified distance in a certain direction. The co-occurrence matrix was calculated for four main directions (0°, 90°, 180°, and 270°), and the features extracted for each direction were merged by averaging. GLRM features were computed over the run-length matrix which describes the length of gray level intensity runs on certain directions to measure coarseness of the textures [26]. We computed a total of 11 GLRM features using four main directions and averaged features calculated using different directions. For LBP approach, texture information was analyzed by comparing the relationship between each pixel and its neighbors within a region, and a signature was constructed by generating a histogram of the relationship [27]. We calculated a total of ten LBP features for each region of interests. We also aimed to measure structural complexity on texture using FD method [28].
Gradient information represents the variation of pixel intensities on specified directions and also provides the velocity of the variation. Based on the textural structure of the tissues, this measurement can be used to portray the coarseness or fineness of the textures. In this study, we employed gradient images to calculate statistical (FOS) and two types of textural features (GLCM and GLRM). We also calculated the histogram of the gradient (HoG) features, grouping gradient magnitudes into nine directional clusters [29].
In addition to conventional texture analysis methods, we utilized wavelet transform to extract spatial characteristics from a special representation form of the images using Daubechies basis function with overlapping windows [30]. In two-dimensional wavelet transform, we obtained four quarterly sized images e.g. approximate, vertical, horizontal, and diagonal detail coefficient wavelet images and computed FOS features including power measure and two types of textural features (GLCM, and GLRM) of all four wavelet images. The radiomic features of the tumor and LN tissues were calculated using an in-house developed script implemented in Matlab® (ver. 9.5.0, Mathworks, MA, USA) utilizing conventional CT images.
Statistical analysis and radiomics model building
We analyzed the demographic characteristics of the colon cancer patients with the chi-square validation using GraphPad prism software version 7.0 (La Jolla, CA, USA). A value of less than 0.05 was considered as statistically significant during the experiments.
During this study, we calculated 286 quantitative features from tumor and LN tissue regions segmented on conventional CT images using eight feature extraction approaches. To reduce the redundancy between features and to determine the most significant features, we adopted the least absolute shrinkage selection operator (LASSO) method to determine the significance of the features. In the LASSO method, the coefficients of features were determined as minimizing the sum of squared error of the regression function. We evaluated the performance of LASSO regression using 10-fold cross-validation approach in our experiments. The significance of the features was identified by observing the coefficients of predictor variables of the regression model with the lowest sum of squared error. During the feature selection process, we examined the feature data of tumor and LN tissues individually to prevent any potential counter effects on the selection process. Hence, we generated two distinctive LASSO regularization models for identifying the significant features of the tissues.
Therefore, we used a kernel-based SVM classification approach to identify the association between radiomic features and staging factors of CC patients as a linear model could not successfully identify CC stages. In the SVM approach, the solution was optimized as minimizing the distance between separating hyperplane and closest instances which will be assigned as support vectors. To solve the quadratic optimization problem, sequential minimal optimization algorithm was employed while the radial basis kernel function (RBF) was used to map feature data to high dimensional space until the data became linearly separable. 10-fold cross-validation was employed to evaluate the performance of the generated classifier model during the training process. The RBF kernel scale and regularization penalty factors were optimized using an empirical approach during the training process is accuracy as an eventual performance metric of the SVM model. In all of the classification experiments, we split the data into two clusters - training and validation sets - with a rate of 70% and 30% of the data, respectively.
To evaluate the efficacy of using LN with tumor tissue characteristics, we performed two classification experiments using tumor tissue and merging the information obtained from both tumor and LN tissues. During the experiments, patients in stage III were declared as positive class instances while patients of stage IV were negative class samples.
Results
Patient characteristics
A total of 195 patients were finally incorporated into our research including 146 patients with stage III and 49 patients with stage IV CC. According to pathological results of the patients, 822 of the 3566 LNs are metastatic LNs. A total of 356 LNs were collected to ensure matching LNs between preoperative CT-labeled and post-operative pathology results. Among stage IV patients, 8 patients had known distant metastasis before operation (simultaneous resection of the primary tumor and liver metastases), 18 patients were found to have peritoneal metastasis during operation, and 23 patients were treated with operation due to complications. We divided patients into training and validation cohorts by keeping the distribution of the imaging characteristics similar.
Ultimately, the training cohort included 136 patients with 102 cases of stage III and 34 cases of stage IV; the validation cohort included 59 patients with 44 cases of stage III and 15 cases of stage IV. The clinicopathologic characteristics of patients in the training and validation cohorts are presented in Table 1. There were no significant differences in gender, age, primary tumor site, and T stage between the training and validation cohorts.
Table 1.
Characteristics of CC patients in training and validation cohorts (n = 195)
| Characteristics | Training cohort (n = 136) | P | Validation cohort (n = 59) | P | ||
|---|---|---|---|---|---|---|
|
|
|
|||||
| Stage III (n = 102) | Stage IV (n = 34) | Stage III (n = 44) | Stage IV (n = 15) | |||
| Age, years (Mean ± SD) | 62.26 ± 12.63 | 60.56 ± 13.92 | 0.539 | 60.89 ± 12.86 | 64.93 ± 8.60 | 0.178 |
| Gender, n (%) | 0.840 | 0.829 | ||||
| Male | 61 (59.8%) | 21 (61.8%) | 19 (43.2%) | 6 (40.0%) | ||
| Female | 41 (40.2%) | 13 (38.2%) | 25 (56.8%) | 9 (60.0%) | ||
| Tumor site, n (%) | 0.551 | 0.824 | ||||
| Right | 45 (44.1%) | 17 (50.0%) | 22 (50.0%) | 8 (53.3%) | ||
| Left | 57 (55.9%) | 17 (50.0%) | 22 (50.0%) | 7 (46.7%) | ||
| Histologic grade, n (%) | 0.018* | 0.798 | ||||
| Well differentiated | 0 (0) | 0 (0) | 1 (0.23%) | 0 (0) | ||
| Moderately differentiated | 71 (69.6%) | 16 (47.1%) | 25 (56.8%) | 10 (66.7%) | ||
| Poorly differentiated | 31 (30.4%) | 18 (52.9%) | 18 (40.9%) | 5 (33.3%) | ||
| Tumor diameter, cm (Mean ± SD) | 7.01 ± 2.17 | 7.21 ± 2.17 | 0.633 | 6.92 ± 1.79 | 7.79 ± 2.92 | 0.302 |
| LN diameter, cm (Mean ± SD) | 1.51 ± 0.59 | 1.69 ± 0.59 | 0.158 | 1.84 ± 0.74 | 1.59 ± 0.49 | 0.161 |
| T stage, n (%) | 0.017* | 0.234 | ||||
| T1 | 0 (0) | 0 (0) | 1 (2.3%) | 0 (0) | ||
| T2 | 2 (2.0%) | 0 (0) | 1 (2.3%) | 0 (0) | ||
| T3 | 75 (73.5%) | 17 (50.0%) | 33 (75.0%) | 8 (53.3%) | ||
| T4 | 25 (24.5%) | 17 (50.0%) | 9 (20.4%) | 7 (46.7%) | ||
| Radiomics score (Mean ± SD) | 0.97 ± 0.16 | -0.02 ± 0.87 | < 0.001* | 0.88 ± 0.35 | -0.28 ± 0.93 | < 0.001* |
Note: n, number; LN, lymph node; SD, standard deviation. P value was derived from the univariable association analyses between each characteristic and stage; tumor size was measured at the thickest part of the colon lesion vertical to the bowel wall on the cross-sectional image.
P < 0.05.
Feature selection
For tumor tissues, LASSO model identified two textural features as distinctive among all the features extracted from conventional CT images, e.g. variance of horizontal detail wavelet representation image and gray-level non-uniformity of gradient image (Figure 4A). On the other hand, three textural features were observed as a significant set of features on LN images, inducing mean intensity of the gray-level image, the variance of diagonal detail wavelet representation image, and homogeneity of vertical detail wavelet representation image (Figure 4B). The coefficients of the constructed LASSO model for tumor and LN regions were provided in Table 2 to demonstrate the dominance of radiomic features. The linear classifier model based on feature coefficients obtained with the LASSO method demonstrated close tissue characteristics of the patients in different stages.
Figure 4.
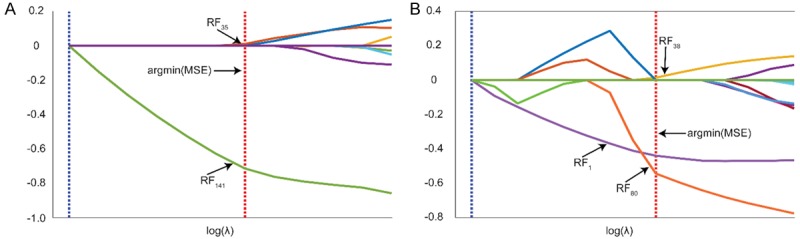
Selection of a subset of features for tumor and lymph node tissues using LASSO regularization. The features were selected among the experiments at the location that minimum error was obtained (argmin (MSE)). 2 features (RF35: variance of horizontal detail wavelet representation image, RF141: gray level non-uniformity of gradient image) for tumor (A) and 3 features (RF1: mean, RF38: variance of diagonal detail wavelet representation image, RF80: contrast of vertical detail wavelet representation image) for lymph node (B) were selected among 286 features that calculated using eight different feature extraction approaches.
Table 2.
List of selected features using least absolute shrinkage and selection operator method
| Tissue Type | Feature Family | Feature Name | Coefficients |
|---|---|---|---|
| Tumor | WT | Variance of horizontal detail wavelet representation image | 0.0107 |
| GGRM | Gray level non-uniformity of gradient image | -0.7146 | |
| LN | FOS | Mean | -0.4401 |
| WT | Variance of diagonal detail wavelet representation image | 0.0143 | |
| WT | Contrast of vertical detail wavelet representation image | -0.5440 |
Performance evaluation of classification framework
To investigate the potential effects of LN texture during the staging of CC patients, we performed two different experiments e.g. tumor features used during the first experiments while combining the features of tumor and LN tissues in the second experiment. As evaluating the performance of the generated prediction models, we mainly focused on classifier accuracy for training and validation cohorts (Table 3).
Table 3.
Predictive performance of the radiomics signature
| Tissue Type | Dataset | Accuracy | Sensitivity | F-1 | AUC |
|---|---|---|---|---|---|
| Tumor | Training | 78.68 | 99.02 | 87.45 | 69.58 |
| Validation | 76.27 | 95.45 | 85.71 | 55.00 | |
| Tumor + LN | Training | 86.03 | 99.02 | 91.40 | 89.16 |
| Validation | 83.05 | 97.73 | 89.58 | 75.15 |
Initially, the SVM classifier was trained using only two features of tumor tissue that identified with the LASSO method. The generated SVM model resulted in an accuracy of 78.68% in training and 76.27% in the validation set. The model has demonstrated 99.02% and 95.45% sensitivity, which reflects the correct classification of stage III CC patients for data separated as training and validation sets, respectively. Unfortunately, the classifier showed low specificity performance for training and validation processes, which might be caused by the high similarity of tissue for stage III and IV patients, which were 17.65% and 20% respectively. Additionally, we calculated F1-score due to uneven instances for classes. The tumor classifier generated a score of 87.45% for training and 85.71% for the validation set. In ROC analysis, we measured AUC as performance characteristic of the generated model e.g. 69.5% [95% CI, 60.33% to 78.67%] and 55% [95% CI, 43.78% to 66.22%] for training and validation set, respectively. The behavior of the classifier model was demonstrated in Figure 5A as interpreting sensitivity and the specificity of the model optimized to have maximum accuracy.
Figure 5.
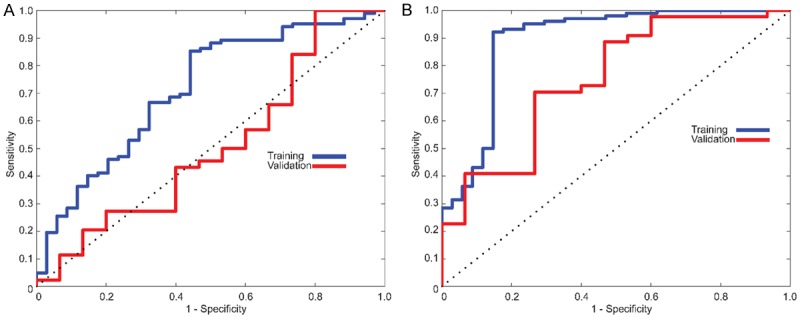
ROC curves in the training and validation cohort. A. For initial experiments, an SVM classifier was generated using only tumor texture which resulted in 78.68% and 76.27% for training and validation cohort. B. Classifier model utilizing features combined tumor and lymph node with an accuracy of 86.03% and 83.05% for training and validation cohort, respectively.
To investigate the effect of information extracted from LNs, we considered the textural features of LN tissue in addition to features of tumor tissue. The SVM classifier was trained with five features (2 features of the tumor and 3 features of LN tissues). The classifier performance resulted in 86.03% and 83.05% with an average 7.07% increase in accuracy. As model sensitivity for the training cohort was the same for both models, we observed a 2.27% increase for the patients in the validation cohort (97.73%). Although we still observe a low specificity (47.06% for training and 40% for validation cohort), there was a remarkable increase specificity by mean of LN features for patients in both classes respectively. Besides, F1-score of this classifier model improved with LN characteristics with a rate of 3.91% resulting 91.40% for training and 89.58% for the validation cohort. In ROC analysis, our RBF kernel-based SVM classifier model showed a significant improvement measuring as 89.16% [95% CI, 83.84% to 94.48%] of AUC for training cohort and 75.15% [95% CI, 66.61% to 83.69%] of AUC for the validation cohort. The characteristic behavior of the classifier was drawn in Figure 5B with respect to sensitivity and specificity.
Discussion
Radiomics is an emerging field of translational research aimed at finding correlations between qualitative information extracted from medical images and clinical data to support evidence-based clinical decision-making systems improving diagnosis, prognosis, and prediction accuracy [11,24,31]. Innumerable quantitative features can now be extracted from CT, MRI (magnetic resonance imaging), and/or PET (positron emission tomography)-CT [32-34]. In our previous study, we used a faster region-based convolutional neural network (Faster R-CNN) to analyze 28,080 MRI images of rectal cancer metastatic LN. The results revealed that Faster R-CNN is a feasible method with ease of clinical application and improved accuracy and efficiency compared with the traditional diagnosis method [35]. In this study, we focused on stage III and IV colon cancer patients as their therapeutic strategies and outcomes are significantly different. We developed and validated radiomics signature based on CT images of the primary tumor and metastatic LNs from stage III and IV colon cancer. Our results revealed that a novel 5-features based radiomics signature should be selected from 286 features, including two features from the primary tumor and three features from metastatic LN images. Furthermore, radiomics signature from extracted quantitative features can successfully identify stage III from stage IV CC preoperatively.
Different from previous studies that discriminated stage I-III from stage IV or stage I-II from stage III-IV of CRC [19], we focused on advanced colon cancer as our research objects were mostly from China. Although CT is recommended by the NCCN guidelines as the preferred imaging examination in the staging of CC in clinical practice, the diagnostic sensitivity and accuracy of CT for LN and peritoneal metastasis are not satisfactory [7]. In this study, 18 patients were diagnosed as stage IV CC by intraoperative exploration due to peritoneal metastases. However, preoperative imaging data could not detect this situation in these patients, so this demonstrated the insufficiency of preoperative CT examinations. Therefore, we investigated the predictive ability of radiomics signature based on conventional CT images for the preoperative staging. While superior to previous studies solely focusing on tumor scans [36], our study collected information from tumor and LN images due to the crucial impact of LN on CC stage identification. Determination of LN metastasis on CT images is usually difficult and complicated [37,38]. To ensure the LN segmentation accuracy, we collected the target LNs in our operation that have been marked in preoperative CT and were verified by postoperative pathological diagnosis. Our study shows that the sensitivity and accuracy of the radiomics signature for combined tumor and LNs were greatly higher than tumor alone, which make combining features of tumor and LN plausible for CC staging.
Radiomics analysis aims to generate a high dimensional characteristic model for the quantitative representation of medical images to identify distinctive aspects of the biological structures for various purposes such as diagnosis and prognosis. The selection of the features by their significant association was required to reduce the complexity of the constructed model and improve the generalization performance of artificial decision models. Despite the existence of various techniques for this procedure, the challenge still remains in the selection of optimal approach and parameter sets. In this study, 286 candidate radiomics features were reduced to 5 potential predictors utilizing the LASSO method, which is appropriate for analyzing high dimensional features with a relatively small sample size as avoiding overfitting. Due to the remarkable clinical similarity between stage III and IV, we observed structurally non-separable data using linear classifier models. Therefore, we preferred to build an RBF kernel-based SVM classifier model to distinguish patients by their disease stages instead of building a radiomics signature using features identified with LASSO. The performance of the cross-validated classifier model was evaluated using patients in the validation cohort. A total of 5 features extracted from conventional CT of tumor and LN tissues were clustered in the training cohort according to their disease severity with 86.03% accuracy while 83.05% was observed in the validation cohort. Besides, we also showed that including the textural information from LN tissues improved the classification accuracy in both training (7.35%) and validation (6.78%) cohorts compared with the tumor only feature classifier model. In ROC analysis, the SVM classifier model showed a significant improvement for training (AUC 89.16% vs. 69.58%) and validation (AUC 75.15% vs. 55%) cohorts in comparison of the combined and the tumor alone.
Limitations of our study include several aspects. Firstly, it was a retrospective study that included only a relatively small sample for machine learning. A larger amount of data will improve the confidence and performance of our model. Secondly, all data in this study were derived from the same institution, and our findings lacked multi-center validation. Finally, our study lacked postoperative follow-up data, so we cannot find a relationship between radiomics signature and survival outcomes. In the future, we will attempt to investigate the performance of adding those factors into our study.
In conclusion, we constructed radiomic signatures based on conventional CT images and successfully identified stage III from stage IV CC preoperatively. In addition, the radiomic features from the combined images achieved better classification performance than the tumor alone. The precise staging was achieved by extracting and analyzing the tumor and LN imaging features before treatment which is essential for the planning of the individual therapeutic strategy.
Acknowledgements
This study was supported by the National Cancer Institute (grants R01CA209886, R01CA196967).
Disclosure of conflict of interest
None.
References
- 1.Bray F, Ferlay J, Soerjomataram I, Siegel R, Torre L, Jemal A. Global cancer statistics 2018: GLOBOCAN estimates of incidence and mortality worldwide for 36 cancers in 185 countries. CA Cancer J Clin. 2018;68:394–424. doi: 10.3322/caac.21492. [DOI] [PubMed] [Google Scholar]
- 2.DeSantis CE, Lin CC, Mariotto AB, Siegel RL, Stein KD, Kramer JL, Alteri R, Robbins AS, Jemal A. Cancer treatment and survivorship statistics, 2014. CA Cancer J Clin. 2014;64:252–271. doi: 10.3322/caac.21235. [DOI] [PubMed] [Google Scholar]
- 3.Siegel R, Desantis C, Jemal A. Colorectal cancer statistics, 2014. CA Cancer J Clin. 2014;64:104–117. doi: 10.3322/caac.21220. [DOI] [PubMed] [Google Scholar]
- 4.National Comprehensive Cancer Network (NCCN) Clinical practice guidelines in oncology. Colon Cancer. (Version 4) 2018 doi: 10.6004/jnccn.2009.0056. [DOI] [PubMed] [Google Scholar]
- 5.Ting DT, Ryan DP. The wide gulf between stage III and stage IV colon cancer. Lancet Oncol. 2014;15:785–786. doi: 10.1016/S1470-2045(14)70272-4. [DOI] [PubMed] [Google Scholar]
- 6.Smith NJ, Bees N, Barbachano Y, Norman AR, Swift RI, Brown G. Preoperative computed tomography staging of nonmetastatic colon cancer predicts outcome: implications for clinical trials. Br J Cancer. 2007;96:1030–6. doi: 10.1038/sj.bjc.6603646. [DOI] [PMC free article] [PubMed] [Google Scholar]
- 7.Tan YN, Li XF, Li JJ, Song YM, Jiang B, Yang J, Yuan Y. The accuracy of computed tomography in the pretreatment staging of colorectal cancer. Hepato-gastroenterology. 2014;61:1207–1212. [PubMed] [Google Scholar]
- 8.Filippone A, Ambrosini R, Fuschi M, Marinelli T, Genovesi D, Bonomo L. Preoperative T and N staging of colorectal cancer: accuracy of contrast-enhanced multi-detector row CT colonography-initial experience. Radiology. 2004;231:83–90. doi: 10.1148/radiol.2311021152. [DOI] [PubMed] [Google Scholar]
- 9.de Vries FE, da Costa DW, van der Mooren K, van Dorp TA, Vrouenraets BC. The value of pre-operative computed tomography scanning for the assessment of lymph node status in patients with colon cancer. Eur J Surg Oncol. 2014;40:1777–1781. doi: 10.1016/j.ejso.2014.08.483. [DOI] [PubMed] [Google Scholar]
- 10.Pinker K, Chin J, Melsaether AN, Morris EA, Moy L. Precision medicine and radiogenomics in breast cancer: new approaches toward diagnosis and treatment. Radiology. 2018;287:732–747. doi: 10.1148/radiol.2018172171. [DOI] [PubMed] [Google Scholar]
- 11.Gillies RJ, Kinahan PE, Hricak H. Radiomics: images are more than pictures, they are data. Radiology. 2016;278:563–577. doi: 10.1148/radiol.2015151169. [DOI] [PMC free article] [PubMed] [Google Scholar]
- 12.Lambin P, Rios-Velazquez E, Leijenaar R, Carvalho S, van Stiphout RG, Granton P, Zegers CM, Gillies R, Boellard R, Dekker A, Aerts HJ. Radiomics: extracting more information from medical images using advanced feature analysis. Eur J Cancer. 2012;48:441–6. doi: 10.1016/j.ejca.2011.11.036. [DOI] [PMC free article] [PubMed] [Google Scholar]
- 13.Lambin P, Leijenaar RTH, Deist TM, Peerlings J, de Jong EEC, van Timmeren J, Sanduleanu S, Larue RTHM, Even AJG, Jochems A, van Wijk Y, Woodruff H, van Soest J, Lustberg T, Roelofs E, van Elmpt W, Dekker A, Mottaghy FM, Wildberger JE, Walsh S. Radiomics: the bridge between medical imaging and personalized medicine. Nat Rev Clin Oncol. 2017;14:749–762. doi: 10.1038/nrclinonc.2017.141. [DOI] [PubMed] [Google Scholar]
- 14.Zhou Y, He L, Huang Y, Chen S, Wu P, Ye W, Liu Z, Liang C. CT-based radiomics signature: a potential biomarker for preoperative prediction of early recurrence in hepatocellular carcinoma. Abdom Radiol (NY) 2017;42:1695–1704. doi: 10.1007/s00261-017-1072-0. [DOI] [PubMed] [Google Scholar]
- 15.Parmar C, Grossmann P, Rietveld D, Rietbergen MM, Lambin P, Aerts HJ. Radiomic machine-learning classifiers for prognostic biomarkers of head and neck cancer. Front Oncol. 2015;5:272. doi: 10.3389/fonc.2015.00272. [DOI] [PMC free article] [PubMed] [Google Scholar]
- 16.Wang G, He L, Yuan C, Huang Y, Liu Z, Liang C. Pretreatment MR imaging radiomics signatures for response prediction to induction chemotherapy in patients with nasopharyngeal carcinoma. Eur J Radiol. 2018;98:100–106. doi: 10.1016/j.ejrad.2017.11.007. [DOI] [PubMed] [Google Scholar]
- 17.Grossmann P, Gutman DA, Dunn WD Jr, Holder CA, Aerts HJ. Imaging-genomics reveals driving pathways of MRI derived volumetric tumor phenotype features in Glioblastoma. BMC Cancer. 2016;16:611. doi: 10.1186/s12885-016-2659-5. [DOI] [PMC free article] [PubMed] [Google Scholar]
- 18.Liang W, Yang P, Huang R, Xu L, Wang J, Liu W, Zhang L, Wan D, Huang Q, Lu Y, Kuang Y, Niu T. A combined nomogram model to preoperatively predict histologic grade in pancreatic neuroendocrine tumors. Clin Cancer Res. 2019;25:584–594. doi: 10.1158/1078-0432.CCR-18-1305. [DOI] [PubMed] [Google Scholar]
- 19.Liang C, Huang Y, He L, Chen X, Ma Z, Dong D, Tian J, Liang C, Liu Z. The development and validation of a CT-based radiomics signature for the preoperative discrimination of stage I-II and stage III-IV colorectal cancer. Oncotarget. 2016;7:31401–31412. doi: 10.18632/oncotarget.8919. [DOI] [PMC free article] [PubMed] [Google Scholar]
- 20.Ren J, Tian J, Yuan Y, Dong D, Li X, Shi Y, Tao X. Magnetic resonance imaging based radiomics signature for the preoperative discrimination of stage I-II and III-IV head and neck squamous cell carcinoma. Eur J Radiol. 2018;106:1–6. doi: 10.1016/j.ejrad.2018.07.002. [DOI] [PubMed] [Google Scholar]
- 21.Wu L, Wang C, Tan X, Cheng Z, Zhao K, Yan L, Liang Y, Liu Z, Liang C. Radiomics approach for preoperative identification of stages III and IIIIV of esophageal cancer. Chin J Cancer Res. 2018;30:396–405. doi: 10.21147/j.issn.1000-9604.2018.04.02. [DOI] [PMC free article] [PubMed] [Google Scholar]
- 22.Amin MB, Edge SB, Greene FL, Byrd D. AJCC cancer staging manual. 8th edition. New York: Springer; 2017. [Google Scholar]
- 23.Yushkevich PA, Piven J, Hazlett HC, Smith RG, Ho S, Gee JC, Gerig G. User-guided 3D active contour segmentation of anatomical structures: Significantly improved efficiency and reliability. NeuroImage. 2006;31:1116–1128. doi: 10.1016/j.neuroimage.2006.01.015. [DOI] [PubMed] [Google Scholar]
- 24.Rizzo S, Botta F, Raimondi S, Origgi D, Fanciullo C, Morganti AG, Bellomi M. Radiomics: the facts and the challenges of image analysis. Eur Radiol Exp. 2018;2:36. doi: 10.1186/s41747-018-0068-z. [DOI] [PMC free article] [PubMed] [Google Scholar]
- 25.Haralick RM, Shanmugam K, Dinstein IH. Textural features for image classification. IEEE Transactions on Systems, Man, and Cybernetics. 1973;SMC-3:610–621. [Google Scholar]
- 26.Galloway MM. Texture analysis using gray level run lengths. Computer Graphics and Image Processing. 1975;4:172–179. [Google Scholar]
- 27.Ojala T, Pietikainen M, Maenpaa T. Multiresolution gray-scale and rotation invariant texture classification with local binary patterns. IEEE Transactions on Pattern Analysis and Machine Intelligence. 2002;24:971–987. [Google Scholar]
- 28.Falconer K. Fractal geometry. Biometrics. 1997;53:1183. [Google Scholar]
- 29.Dalal N, Triggs B. Histograms of oriented gradients for human detection. IEEE. 2005;1:886–893. [Google Scholar]
- 30.Daubechies I. Ten lectures on wavelets. Philadelphia, PA: Society for Industrial and Applied Mathematics; 1992. [Google Scholar]
- 31.Liu Z, Zhang XY, Shi YJ, Wang L, Zhu HT, Tang Z, Wang S, Li XT, Tian J, Sun YS. Radiomics analysis for evaluation of pathological complete response to neoadjuvant chemoradiotherapy in locally advanced rectal cancer. Clin Cancer Res. 2017;23:7253–7262. doi: 10.1158/1078-0432.CCR-17-1038. [DOI] [PubMed] [Google Scholar]
- 32.Shen C, Liu Z, Wang Z, Guo J, Zhang H, Wang Y, Qin J, Li H, Fang M, Tang Z, Li Y, Qu J, Tian J. Building CT radiomics based nomogram for preoperative esophageal cancer patients lymph node metastasis prediction. Transl Oncol. 2018;11:815–824. doi: 10.1016/j.tranon.2018.04.005. [DOI] [PMC free article] [PubMed] [Google Scholar]
- 33.Fei G, Bin Y, Jian C, Minghui W, Dapeng S. Pathological grading of Hepatocellular Carcinomas in MRI using a LASSO algorithm. Journal of Physics: Conference Series. 2018;1053:012095. [Google Scholar]
- 34.Helden E, Vacher Y, Wieringen W, Velden F, Verheul H, Hoekstra O, Boellaard R, Menke-van der Houven van Oordt C. Radiomics analysis of pre-treatment [18F]FDG PET/CT for patients with metastatic colorectal cancer undergoing palliative systemic treatment. Eur J Nucl Med Mol Imaging. 2018;45:2307–2317. doi: 10.1007/s00259-018-4100-6. [DOI] [PMC free article] [PubMed] [Google Scholar]
- 35.Lu Y, Yu Q, Gao Y, Zhou Y, Liu G, Dong Q, Ma J, Ding L, Yao H, Zhang Z, Xiao G, An Q, Wang G, Xi J, Yuan W, Lian Y, Zhang D, Zhao C, Yao Q, Liu W, Zhou X, Liu S, Wu Q, Xu W, Zhang J, Wang D, Sun Z, Gao Y, Zhang X, Hu J, Zhang M, Wang G, Zheng X, Wang L, Zhao J, Yang S. Identification of metastatic lymph nodes in MR imaging with faster region-based convolutional neural networks. Cancer Res. 2018;78:5135. doi: 10.1158/0008-5472.CAN-18-0494. [DOI] [PubMed] [Google Scholar]
- 36.Huang YQ, Liang CH, He L, Tian J, Liang CS, Chen X, Ma ZL, Liu ZY. Development and validation of a radiomics nomogram for preoperative prediction of lymph node metastasis in colorectal cancer. J. Clin. Oncol. 2016;34:2157–64. doi: 10.1200/JCO.2015.65.9128. [DOI] [PubMed] [Google Scholar]
- 37.Wu S, Zheng J, Li Y, Yu H, Shi S, Xie W, Liu H, Su Y, Huang J, Lin T. A radiomics nomogram for the preoperative prediction of lymph node metastasis in bladder cancer. Clin Cancer Res. 2017;23:6904–6911. doi: 10.1158/1078-0432.CCR-17-1510. [DOI] [PubMed] [Google Scholar]
- 38.Bayanati H, E Thornhill R, Souza CA, Sethi-Virmani V, Gupta A, Maziak D, Amjadi K, Dennie C. Quantitative CT texture and shape analysis: can it differentiate benign and malignant mediastinal lymph nodes in patients with primary lung cancer? Eur Radiol. 2015;25:480–487. doi: 10.1007/s00330-014-3420-6. [DOI] [PubMed] [Google Scholar]