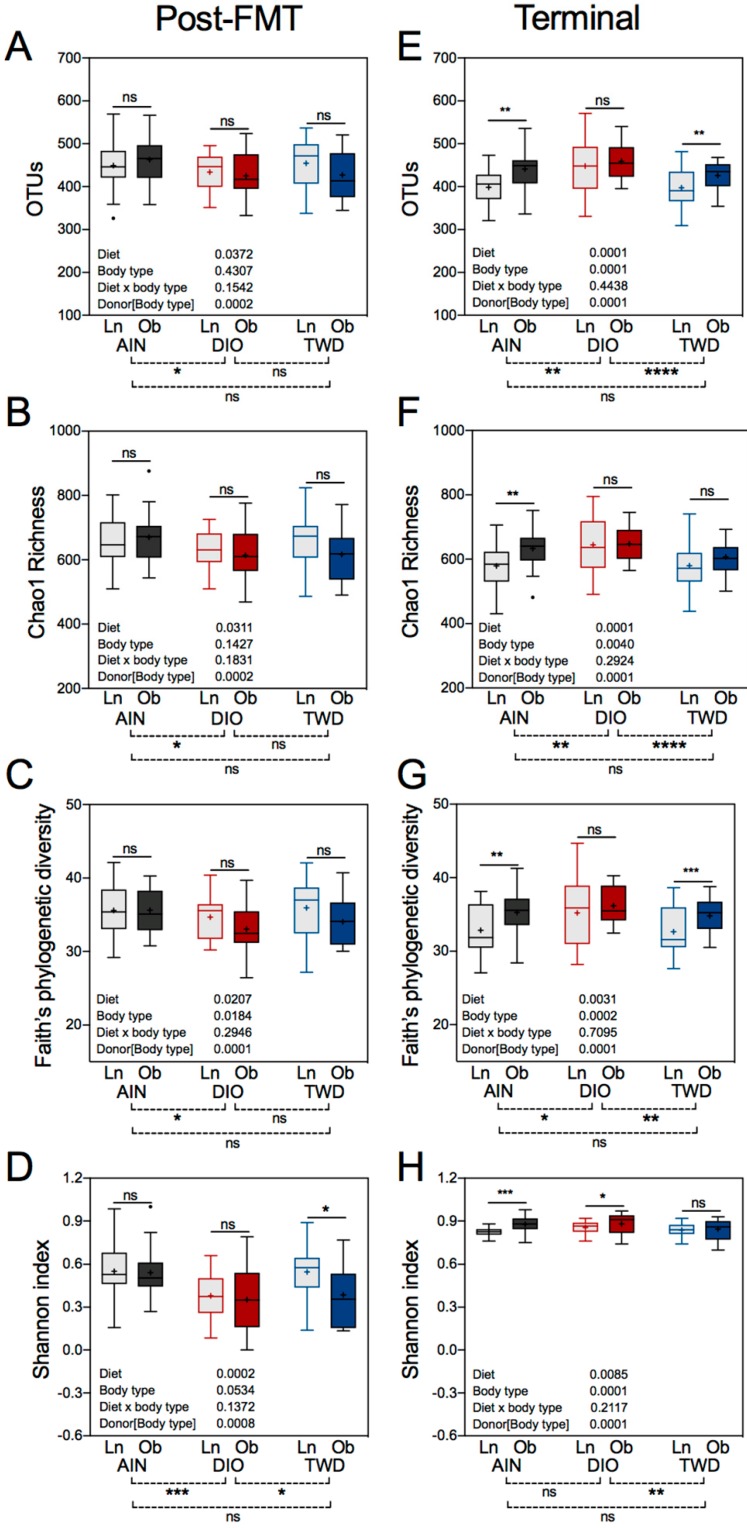
Figure 11.
Alpha diversity of recipient microbiomes post-FMT and at necropsy. Operational taxonomical units (OTUs) (A,E), Chao1 richness (B,F), Faith’s phylogenetic diversity (C,G), and Shannon index (D,H) alpha diversity measures for fecal mouse microbiomes post-FMT and at necropsy are presented as Tukey box plots (box, 25th to 75th percentiles; whiskers, 1.5 IQR; +, mean) (n = 6 to 9). The tables within each panel show p-values for the main effects of each experimental factor as determined by the mixed model analysis. Below each plot, brackets indicate the results of Tukey post hoc tests for the overall effects of each diet. Within each diet group, symbols above the box and whisker bars indicate the results of post hoc tests comparing mice that received bacteria from lean (Ln) or obese (Ob) human donors. * p < 0.05, ** p < 0.01, *** p < 0.001, **** p < 0.0001, ns = not significant.

