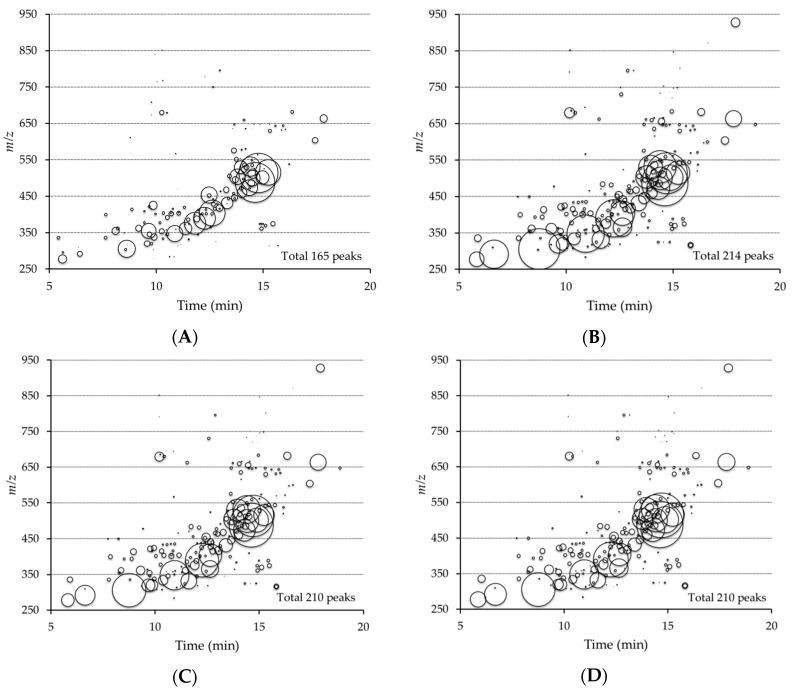
Figure 4.
Reactive carbonyl species (RC) maps of cerebral cortices obtained from SAMP10 mice in the (A) YC, (B) OC, (C) OS0.02, and (D) OS0.05 groups. Experimental groups are indicated as: Young control, fed basal diet (YC), old control, fed basal diet (OC), old, fed basal diet supplemented with 0.02% sesame lignans (OS0.02), and old, fed diet supplemented with 0.05% sesame lignans (OS0.05). The area of each circle represents the relative intensity of the RCs compared to an internal standard. RC maps are presented as averages of each map (n = 5).

