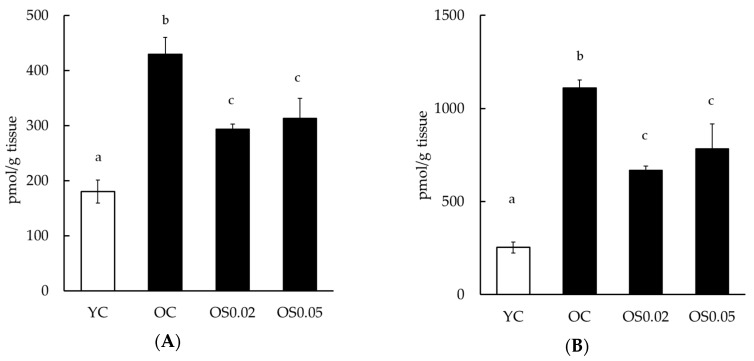
Figure 5.
4-hydroxy-2-nonenal (HNE) (A) and 4-hydroxy-2-hexenal (HHE) (B) in cerebral cortices obtained from mice in the YC, OC, OS0.02, and OS0.05 groups (n = 5). Experimental groups are indicated as: Young control, fed basal diet (YC), old control, fed basal diet (OC), old, fed basal diet supplemented with 0.02% sesame lignans (OS0.02), and old, fed diet supplemented with 0.05% sesame lignans (OS0.05). Statistical analyses were performed using a one-way ANOVA followed by a Tukey–Kramer post hoc analysis. Different letters indicate significant differences (p < 0.05). The retention times for HNE and HHE were 10.42 min and 8.36 min, and the m/z information for HNE and HHE were m/z 362 and m/z 404, respectively.

