Abstract
We report on the reflectance, transmittance and fluorescence spectra (λ=200–1200 nm) of four types of chicken eggshells (white, brown, light green, dark green) measured in situ without pretreatment and after ablation of 20–100 μm of the outer shell regions. The color pigment protoporphyrin IX (PPIX) is embedded in the protein phase of all four shell types as highly fluorescent monomers, in the white and light green shells additionally as non‐fluorescent dimers, and in the brown and dark green shells mainly as non‐fluorescent poly‐aggregates. The green shell colors are formed from an approximately equimolar mixture of PPIX and biliverdin. The axial distribution of protein and colorpigments were evaluated from the combined reflectances of both the outer and inner shell surfaces, as well as from the transmittances. For the data generation we used the radiative transfer model in the random walk and Kubelka‐Munk approaches.
Keywords: chicken eggshells, fluorescence spectroscopy, UV/Vis spectroscopy, porphyrinoids, proteins, amino acids
1. Introduction
The avian eggshell is a complex biomineral that combines mechanical stiffness, bio‐functionality, and aesthetic appearance. The chicken eggshell mainly consists of calcite crystallites (≈95 % w/w) with a small contribution of apatite (≈1% w/w),1 a pervading organic matrix (1–3.5 % w/w of the palisade layer),2 pigments as colorants (0.15–1200 nmol/g),3, 4, 5, 6, 7, 8 and, according to own results, more than 10 % (v/v) void cavities with about 0.4 % (w/w) of adsorbed water. The architecture of the shell has mainly been investigated with imaging methods (scanning electron microscopy,9 transmission electron microscopy,2 optical microscopy,10 and X‐Ray11). The inner shell surface consists of two protein membranes followed by interstitial calcite columns, so‐called mammillary knobs, which converge to the calcareous palisade layer topped with an outer protein layer, the cuticle. More detailed information can be found in review articles.12, 13, 14
Of particular interest to the present contribution are the properties of the organic matrix. It consists of a series of proteins15, 16, 17 and of pigments responsible for the color of the shell. The brown shells contain cyclic tetrapyrrole derivatives18, 19 with the main representative protoporphyrin IX (PPIX), the free base (metal‐free) version of heme. The green and blue‐green shells contain biliverdin (BV),20, 21 an oxidative ring opening product of PPIX with broad absorption in the blue and orange‐red region. Slight variations in the absorption width or maximum induce the change of the color impression from more green to more blue. The green shells often comprise PPIX in addition to BV, resulting in a dark color.22 In white shells, no color pigment is visible to the naked eye. If any is present, it will be masked by the shell's blue fluorescence, which acts as an optical brightener. Tamura et al. studied the distribution of porphyrin pigments in each layer of the coverings of eggs. They concluded that the pigments were distributed in the shells and cuticles. The pigments concentrations in the shell membranes were in the range of or below the detection limit and thus could not be clearly observed.23
Eggshell pigmentation is quantitatively analyzed either in solution or directly on the shell. For the analysis in solution, the shell must be dissolved. Complete dissolution in acidic media yields the integral pigment content of the entire shell. This method is widely applied in the literature.8, 18 More specifically, the shell is soaked in a neutral or slightly alkaline solution of ethylenediaminetetraacetate (EDTA) which dissolves the cuticle and pigments therein but only slightly affects the calcareous region.24 An alternative is surface etching with diluted hydrochloric acid to extract pigment from eggshell.25 These methods allow one to differentiate between pigment positions close to the outer surface and the interior of the shell.26, 27 Samiullah and Roberts found more PPIX in the calcareous part than in the cuticle.28 An approach for assessing eggshell pigmentation without sample preparation is measuring directly on the surface using the shell as turbid medium for optical spectroscopy in the diffuse reflectance mode. Reflectance spectra deliver an objective tool for the description of eggshell colors under e. g. aesthetic, physiological, or classifying points of view. The spectra are converted into the CIE color space or into hexadecimal color codes.8, 22 Some authors additionally specify blue‐green chroma as reflectance differences Rmax–Rmin at significant wavelengths of the BV‐spectrum in the shell29, 30, 31 or brown chroma for PPIX‐containing shells.32 The representation of eggshell colors in the avian tetrachromatic color opponent space is practiced.33, 34 Optical spectroscopy is furthermore beneficial for the separation of specular from diffuse reflectance with emphasis on highly glossy specimens,35 for the investigation of reflectance spectra under the aspect of correlation with the pigment concentration,3, 36, 37, 38 as well as for the aspect of the pigment stability against strong photo‐irradiation.39 Maurer et al. compared the spectrally resolved transmitted light through wild bird eggshells to their reflectance values.40 Lahti et al. observed reflectance and absorbance by the eggshell, and the transmittance through the shell.41 Vibrational spectroscopy has been applied as IR technique to analyze the properties of eggshell layers,42, 43 or as Raman technique to identify avian eggshell pigments.5
In this paper, we disconnect the inner mebranes from the calcareous main parts of white, brown, light green and dark green chicken eggshells. According to the graphical TOC, we apply diffuse reflectance, diffuse transmittance and fluorescence spectroscopy for the in‐shell analysis of the optical concentrations and axial concentration profiles of PPIX, BV, and proteins in the multiple scattering shell. The sampling depth of reflectance reaches up to one third of the total layer thickness but decreases with increasing absorption.44 Transmittance probes the whole layer depth with slight preference of the central region. For a full analysis, we acquire data with irradiation from both surface sides and, when indicated, after mechanical ablation of the outer shell regions. Despite the particulate nature of the shell, we evaluate the data with the continuum model of radiative transfer in multiple scattering media45 including the popular one‐dimensional approximation of Kubelka‐Munk.46, 47, 48 The calculated optical parameters can in principle be transferred into molar concentrations. However, the appearance of the brown shell spectra is rather different from spectra of pigments and proteins in aqueous solution so that we do not know the exact molar extinction coefficients at the moment. We discuss the absorption and fluorescence spectra under the aspects of molecular aggregation and intermolecular energy transfer which can be very probable processes because the local pigment and protein concentrations are about two orders of magnitude higher than the average over the entire shell.
Experimental Section
White and brown eggs of domestic chicken Gallus gallus were purchased from local supermarkets. Green eggs of Araucana chicken, a breed of domestic chicken from Chile, were delivered from a regional chicken farm. In sum, we chose four types of chicken eggs with different colors as described in Table 1.
Table 1.
Apparent colors of four types of chicken eggshells under day light.
| Type | Outer shell surface | Inner shell surface | |
|---|---|---|---|
| I | Gallus gallus | Light grayish white | Light grayish white |
| II | Gallus gallus | Medium to dark brown | Light brownish white |
| III | Araucana | Light green | Light green |
| IV | Araucana | Dark green | Light green |
The eggs were cracked by hand and the shells were separated from egg white, egg yolk and the inner membranes. The remaining shells were investigated i) without further cleaning, ii) after mechanical ablation of the outermost shell regions using a rotary tool (Dremel), fitted with a metal wire brush (diameter 2 cm). The degree of ablation was measured with a micrometer caliper.
Optical absorption and scattering spectra were recorded with a Lambda 1050 double beam spectrophotometer (PerkinElmer) equipped with a photometric integrating sphere including sample ports for diffuse transmittance and diffuse reflectance. The samples were monochromatically excited (typically with bandwidths of Δλ=1 nm) and the sum of elastic and inelastic backward or forward scattered radiation was recorded with four shell positions against the “white” reference spectralonTM (polytetrafluoroethylene); yielding diffuse reflectance from the outer (Rout) and inner (Rin) shell surfaces as well as diffuse transmittance through the outer (Tout) and inner (Tin) surface. The curvatures of the shells reduce somewhat the solid angle of radiation that impinges on the photometric sphere in the positions Rin and Tout. Therefore, the spectra were adjusted in the region of negligible absorption, λ=900–1100 nm, to the corresponding values of Rout and Tin, respectively. This conventional method of spectra acquisition according to Figure 1 (a) has its limitations for luminescent samples because luminescence can greatly enhance the registered signal, especially when the detector is more sensitive to luminescence than to primary radiation, e. g. in the UV‐range. For quantitative photometry of the absorption band at 280 nm, we therefore applied a two‐monochromator equipment as described in Figure 1 (b). Here, a Fluorolog 3 instrument was used to perform not only fluorescence excitation and fluorescence emission spectra but also diffuse reflectance spectra, free from fluorescence. For all measurements, emitted or reflected light was collected in a 23°‐angle front‐face detection. The bandwidths of both monochromators were adjusted to Δλ=1 nm.
Figure 1.
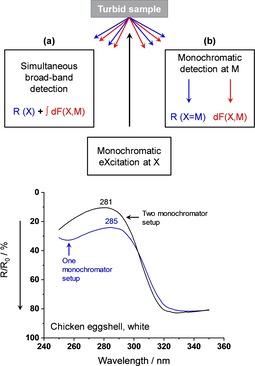
Top: Spectrometry of a diffusely reflecting (R, blue) and fluorescing (F, red) turbid sample upon monochromatic excitation at X. In (a), a broad‐band detection in a conventional one monochromator setup results in the sum of diffuse reflectance and backscattered fluorescence. (b) A spectrometer setup with two independently driven monochromators X and M almost completely separates fluorescence from reflectance. Bottom: Diffuse reflectance spectra of a white chicken eggshell acquired with a conventional UV/Vis spectrophotometer and a two‐monochromator X, M spectrometer setup. Note: The reflectance is scaled from top to bottom. Hence, the absorption of fluorescent tryptophan becomes higher with two monochromators, and the absorption maximum shifts to its correct value.
The tryptophan (Trp) and tyrosine (Tyr) concentrations in brown and white eggshells were determined after preparing five brown and five white chicken eggs each as initially described. The eggshells were ground by a Retsch Mixer Mill (model MM 400). The resulting powders were hydrolysed in barium hydroxide solution for the Trp determination and in hydrochloric acid for the Tyr determination. Both amino acids were quantified by HPLC with fluorescence detection.49
The optical parameters of the shells were calculated from the spectroscopic data with the continuum model of radiative transfer,45 which is an extension of Beer's law to three‐dimensionally multiple scattering systems. In order to reduce the mathematical effort for the description of the photo‐stationary state, we used the random‐walk (RW) approach,44, 50 and split the incident radiation flux into a large number (e. g. one million) of bunched beams (“photons”), and recorded one after the other their stochastic fates through the sample until reflection, transmission or absorption. The sum of all experiments yields the photo‐stationary state, with the disadvantage of lacking analytical presentation, but the great advantage of applicability to systems with axial and radial material gradients as, e. g., in an eggshell. The distance s between two statistical events (scattering or absorption) is described by the probability transformation of the extended Beer's law
The polar and azimuth angles between two events are given by
The probability of total absorption is given by a random number greater than the albedo
Otherwise the bunched beam stays intact.
In a different approach we apply the popular Kubelka‐Munk (KM) equations46, 47, 48 which are exact solutions of the model of radiative transfer in one dimension. The formalism has been described in a number of original papers and monographs. Here, we start from very thin finite layer elements of thickness Δz with transmittance 1T and reflectance 1R
| (1) |
where S=scattering coefficient/unit length, K=absorption coefficient/unit length, (Kubelka notation). Starting from this basic approach, the optical properties of a stratified n‐layer system can be expressed by the recursion formulae
| (2) |
which were already applied by Stokes51 to calculate the optics of a stack of glass sheets.
The method becomes valuable for depth‐dependent optical parameters. Otherwise the analytical KM‐solutions are simpler to handle. An approximate correlation between RW‐ and KM‐ parameters can be established for diffuse incidence, not too thin layers (σ+α)z >10, and scattering that dominates over absorption
| (3) |
where the anisotropy parameter 0≤g≤1 considers the forward tendency of a single scattering event.
2. Results and Discussion
2.1. Phenomenological Description of Absorption and Fluorescence Spectra Including Band Assignment
According to Table 1, the visual color impression of the shells can be very different by inspection from the outer and inner shell surfaces. Therefore, the absorption and fluorescence spectra were measured by irradiation from both sides.
White eggshells typically show the diffuse reflectance and transmittance spectra in Figure 2, measured with the one monochromator equipment of Figure 1 (a). Prominent electronic absorption bands are only found in the UV – range starting just below the visible with λ max=390 nm in reflectance from the shell outside, λmax=380 nm in transmittance, and λ max=360 nm in reflectance from the shell inside. Additional strong bands are emerging in the mid‐UV with λ max=284 and 238 nm. The Vis‐range appears virtually white due to strong multiple scattering and almost negligible absorption. However, closer inspection reveals four very weak absorption signatures with ΔR≈−0.005 and ΔT≈−0.002. They can easily be localized because of their small bandwidths, as visualized in the insets of Figure 2. We compared the band positions to the absorption spectrum of PPIX in dilute trichloromethane solution.52 All four absorption signatures of the shell coincide with the Q‐band positions of dissolved monomeric PPIX (Figure 5).
Figure 2.
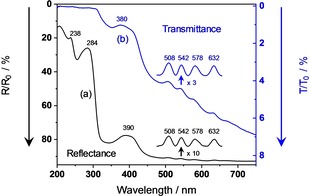
UV/Vis spectra of a white chicken eggshell. (a) Diffuse reflectance, irradiation from outside. In the inset, the intensity scale is magnified by a factor of 10, and the spectrum has undergone a baseline correction. (b) Diffuse transmittance, irradiation from either outside or inside. In the inset, the intensity scale is magnified by a factor of 3, and the spectrum has undergone a baseline correction. For comparability to the fluorescence spectra, the axes of reflectance and transmittance are labeled from top to bottom.
Figure 5.
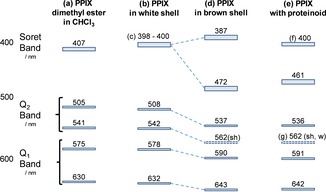
Term diagram with band maxima of protoporphyrin IX. (a) From absorbance spectra of PPIX dimethyl ester in CHCl3.52 (b) From reflectance spectra of white chicken eggshells, except (c) which originates from fluorescence excitation spectra at λ em=690 nm. (d) From reflectance spectra of brown eggshells. (e) From absorption spectra of PPIX in phosphate buffer with proteinoid.61 (f) Soret band of PPIX monomers. (g) Very weak shoulder.
For further band assignment, we studied the fluorescence excitation and emission spectra, as presented in Figure 3. Fluorescence (red curves) spreads over a wide wavelength range forming maxima in the UV at λ M,max=345 nm, in the Blue at λ M,max=430–460 nm with a long wavelength tail extending to more than 550 nm, and in the Red with two vibronic maxima at λ M,max=632 and 673 nm. The red fluorescence can be clearly assigned to monomeric PPIX because it shows the same exact excitation spectrum (blue curves) in the Q‐band region as the absorption spectrum in dilute solution or in the shell (Figure 2). In addition, the excitation spectrum reveals the position of the intense Soret‐band with λ X,max=398 nm. This band cannot unambiguously be located in absorption because it is embedded in a series of other absorbing pigments which are responsible for the blue fluorescence. The absorption spectra of these pigments overlap so that the sum maximum of excitation shifts with the detection wavelength of the blue fluorescence and vice versa. Since the sum maximum of absorption also depends on the geometry of measurement (Rout, Rin, T, see above), the blue emitting pigments have to be located in the interior of the shell and not close to the outer surface (see later). Unfortunately, we were not yet able to assign the chemical nature of the pigments. The UV‐fluorescence reveals the classical behavior of a one‐component system. We measured over a wide range in the λ X,λ M – space and found stable maxima at λ X,max=280 and λ M,max=345 nm. Thus, fluorescence originates from the strong absorption band with false maximum at λ max=284 nm that shifts to λ max=281 nm after fluorescence elimination (Figure 1, bottom). The majority of protein literature53, 54, 55, 56 assigns the 280 nm absorption to the La,b‐transition of the indole skeleton in tryptophan (Trp) with a considerable contribution of the corresponding phenol transition in tyrosine (Tyr). We follow this assignment and determined the concentrations of Trp=0.25 mg/g and Tyr=0.56 mg/g as average from five powderized shells of our flock. With the decadic molar extinction coefficients ϵ280=5500 and 1000 cm2/mmol one obtains the absorption coefficients α280=35 and 14 cm−1 for the two amino acids. According to our experience with the absorption of aromatic molecules adsorbed onto multiple scattering metal oxide powders,57, 58 the α‐value is rather low as to produce the high absorption of the 280 nm‐band. A qualitative explanation will be given in the following chapter by the fact that Trp and Tyr are non‐uniformly distributed over the shell in axial and lateral directions.
Figure 3.
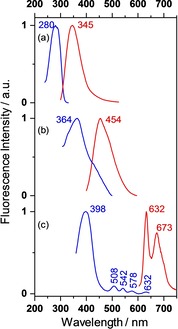
Fluorescence excitation (X, blue curves) and emission (M, red curves) spectra of a white chicken eggshell irradiated onto the outer surface and measured in backscattering mode (23° against incidence). Wavelength numbers represent curve maxima. (a) X spectrum for λ M=350 nm and M spectrum for λ X=270 nm. (b) X for λ M=520 nm and M for λ X=388 nm. (c) X for λ M=690 nm and M for λ X=388 nm. For clarity, the blue fluorescence is not displayed in (c). The complete spectrum will be found in Figure 9 (a).
Brown eggshells begin to absorb at λ<750 nm by irradiation through the outer surface side and produce a nice vibronically structured reflectance spectrum, as shown in Figure 4 (a). The overall absorption strength varies somewhat with the flock and age of the hens but the vibronic structure does not change.36 Irradiation from the inner surface side exhibits the same vibronic structure in the Vis range, but with very low absorption strength, Figure 4 (b). Hence, the Vis‐pigment must be non‐uniformly distributed over the shell depth. This property is common knowledge by visual inspection. The distribution was quantitavely examined by partial dissolution of PPIX localized close to the outer shell surface.25, 28 The transmittance spectra absorb with equal strength upon irradiation from both surface sides, see Figure 4 (c), and (d). It should be noted that T‐spectra do not render the gradient but still the absolute extent of non‐uniformity so that they help to understand the pigment distribution over the layer depth. Comparably to the reflectance spectra of the white shell, the near‐UV absorption maxima somewhat depend on the side of irradiation, indicating different chromophores with different axial positions (unfortunately, transmittance is too low in this range as to be reliably evaluated). The first absorption maximum of the amino acids, mainly Trp, remains at λ max=283 nm from both irradiation sides with lower intensity from inside.
Figure 4.
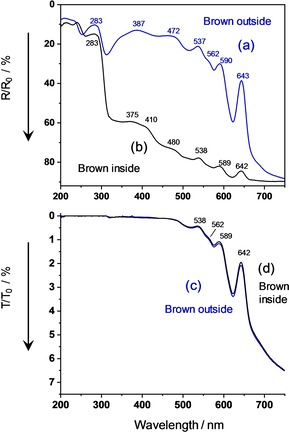
UV/Vis spectra of a brown chicken eggshell. (a) Blue curve: diffuse reflectance, outside. (b) Black curve: diffuse reflectance, inside. (c) Blue curve: diffuse transmittance, outside. (d) Black curve: diffuse transmittance, inside. For comparability to the fluorescence spectra, the axes of reflectance and transmittance are labeled from top to bottom.
2.1.1. Aggregation Tendency of PPIX
The assignment of the Vis‐spectrum uses the fact that dissolved porphyrins tend to aggregate like many other poly‐conjugated molecules by concentration, addition of proteins, adsorption on sol‐gel matrices, and deposition on solid substrates.59, 60 The weak absorption bands of the monomer broaden and shift by aggregation to the red because the polarizability of the environment becomes higher than the solvent, the strong bands additionally split up into several components. The fluorescence yield often becomes very low due to enhanced singlet‐triplet intersystem crossing or excited‐state electron transfer as in the primary step of photosynthesis (remember that PPIX is very comparable to chlorophyll). The visible spectrum of the brown eggshell follows these features and correlates with the low‐concentrated white eggshell as shown in the term diagram of Figure 5: the Q1‐bands shift by Δν=−300 cm−1 to the red with indication of band splitting in the long‐wavelength tail, the Q2‐bands shift by Δν=−1000 cm−1, the strong Soret‐band by Δν=− 3700 cm−1 with an additional blue‐shift of Δν=+1300 cm−1. In total, the spectrum becomes similar to PPIX aggregates in proteinoid.61
The onset of aggregation can also be observed in white‐shelled specimens with relatively high PPIX‐content. Figure 6 shows absorption and fluorescence excitation details of a shell with more than 5 times the PPIX‐concentration than in the specimen of Figure 2 and Figure 3. In comparison to Figure 2, the Q1‐band shifts by Δλ≥5 nm to the red wavelength region and lies between the monomer and the poly‐aggregates bands of the brown shell. We assign the Q1‐absorption to the head‐to‐tail transition of a tile‐shaped dimer. Q2 is the orthogonal side‐by‐side transition with a large center‐to‐center distance, weak intermolecular coupling, and thus negligible spectral shift against the monomer. The situation changes in the three‐dimensional poly‐aggregates of the brown shell, where Q2 shifts stronger to the red than Q1.
Figure 6.
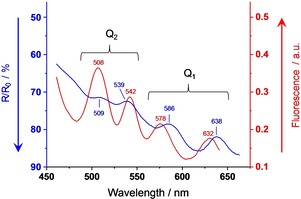
Q‐band region of the diffuse reflectance absorption spectrum (blue curve) and fluorescence excitation spectrum, λ X=690 nm, (red curve) of a white eggshell with eight times the PPIX‐concentration of that in Figure 2 and Figure 3. Absorption mainly arises from aggregates, and fluorescence exclusively originates from monomers.
No fluorescence of aggregated PPIX could be detected in white, brown, or green shells. However, we always measured intense fluorescence of the monomer with the same emission and excitation Q‐ band positions as in Figure 3. Hence, the monomer must be present in all samples, even if its absorption is masked by the aggregates. A significant intensity difference remains between white and brown in the ratio of the first (632 nm) and second fluorescence vibronic (673 nm). The first one is strongly re‐absorbed by the brown pigment and thus loses intensity against the white shell, as seen in Figure 9.
Figure 9.
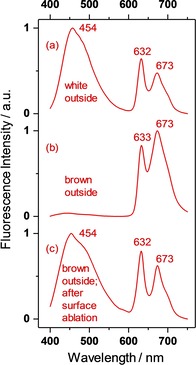
Fluorescence emission (M) spectra of white and brown chicken eggshells for λ X=388 nm irradiated onto the outer surface and measured in backscattering mode (23° against incidence). Wavelength numbers represent curve maxima. The fluorescence spectra are unit vector normalized. (a) White chicken eggshell outside. (b) Brown chicken eggshell outside. (c) Brown chicken eggshell outside after ablation of an outer layer of Δz≈80 μm.
Green shells become mainly colored by biliverdin (BV), a formal oxidative ring‐opening product of PPIX. The resulting polyene‐1,ω‐dione molecule is much more flexible than PPIX and provides a series of −C=C− and O=C‐valence as well as low‐energetic deformation vibrations that couple with the electronic π,π*‐transitions. The resulting absorption bands are broad and structureless with maxima at 375 nm (ϵ=56000 cm2/mmol) and 670 nm (ϵ=15800 cm2/mmol) in EtOH. The corresponding maxima are localized in the shell at 383–385 nm and≈645 nm. The band shifts against solution are tentatively interpreted as aggregation effect in J‐direction (UV‐band) and H‐direction (red band).
The spectra of lightly colored shells in Figure 7 (a) reveal a distinct intensity contrast between outer and inner surface, which is much weaker than in the brown shells. In addition to BV, we found all four Q‐band signatures of PPIX in our flock, as shown in the inset of Figure 7 (a). The band positions comply with the pattern in Figure 6, and are therefore assigned to PPIX‐dimers, which were also observed in the white shell with high PPIX‐content. The dimers are non‐fluorescent, but both sides of irradiation show the fluorescence of PPIX‐monomers with the same emission and excitation spectra as in Figure 3 or Figure 6.
Figure 7.
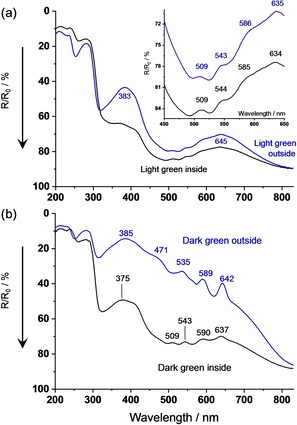
UV/Vis spectra of light green and dark green chicken eggshells. (a) Diffuse reflectance of light green shell, measured from inside and outside. (b) Diffuse reflectance of dark green shell, measured from inside and outside.
The intensity contrast between outer and inner surface irradiation of deeply colored shells is fairly strong, Figure 7 (b). The outer surface region absorbs due to a mixture of BV and highly aggregated PPIXn with the same spectral pattern as in the brown shell. The inner surface, however, absorbs similarily to the lightly colored shell ascribed to a mixture of BV and non‐fluorescent PPIX‐dimers. Again, the detected fluorescence results from PPIX‐monomers on both sides of the deeply colored eggshells, but no clear evidence of their absorption was found (very tentative; the shoulder at≈400 nm can be assigned to the Soret‐band).
2.2. Optical Parameters and Depth Profiles of the Pigments
2.2.1. The Uniform Layer Approximation
The situation of negligible axial σ‐ and/or α‐gradients yields equal reflectances from outside and inside irradiation, Routside=Rinside. This situation is mainly found in the wavelength regions λ=500, 800, 900–1200 nm of white, brown, or green shells, where absorption is very weak. We evaluated the optical data originating from a triple layer, R010 and T010 (0=internal shell boundaries, 1=turbid medium). It should be noted that, without consideration of Fresnel backscattering at the internal sample boundaries, the absorption (scattering) coefficients would be significantly greater (less) than in reality. Table 2 summarizes results obtained with the RW‐ and KM‐ formalisms, in the latter case by iterative application of the recursion formulae (Eq. 2) and with insertion of the internal boundary reflection R0=0.6. The calculated scattering coefficients depend on the wavelength, σ∼λ −0.65, indicating scattering centers with dimensions marginally greater than λ.62 The absorption of the white shell is formed from a weak unspecified background in the Vis‐range superimposed by even weaker, but clearly assignable Q‐bands of PPIX (Figure 2). The KM‐absorption coefficient of the first Q1‐band maximum is calculated as K632=0.07 cm−1, and the corresponding RW‐ coefficient, which is closely related to the Beer‐Lambert absorption coefficient in transparent media, as α632=0.03 cm−1. Based on the decadic extinction coefficient in solution, ϵ632=5200 cm2/mmol, the volume concentration of PPIX is cPP=(3 1) nMol cm−3 in the white eggshell. However, this value cannot be considered as a general mean for all white chicken eggshells. As described in Figure 6 we also found specimens with almost ten times higher PPIX concentration. These eggs still appear as “white” because color‐measuring instruments do not fully identify the narrow Q‐bands. Additionally, the blue fluorescence of the shell acts as an optical brightener.
Table 2.
Selected optical parameters of a white chicken eggshell in the weak absorption region; shell thickness=400 μm; RW‐ and KM‐ evaluations from R and T considering total internal boundary reflection at polar scattering angles sinθ>n−1=1.56−1 corresponding to partial boundary reflectance R0=0.6 for diffuse flux; αU, KU=unspecified absorption loss.
| λ [nm] | Experiment | Scattering coeff. [cm−1] | Absorption coeff. [cm−1] | |||
|---|---|---|---|---|---|---|
| R | T | σ | S | αU | KU | |
| 1200 | 0.880 | 0.097 | 690 | 545 | 0.12 | 0.27 |
| 1000 | 0.890 | 0.085 | 780 | 625 | 0.13 | 0.29 |
| 800 | 0.905 | 0.071 | 960 | 760 | 0.13 | 0.28 |
| 632 | ||||||
| Baseline | 0.915 | 0.060 | 1120 | 890 | 0.14 | 0.30 |
| Q1 – max | 0.911 | 0.058 | +0.03 | +0.07 | ||
| PPIX absorption | ||||||
| 400 | ||||||
| Baseline | 0.920 | 0.045 | 1350 | 1100 | ||
2.2.2. Depth Profiles of the Shell Proteins
Eggshell proteins are the main carrier of the color pigments. We determined the protein content from the absorption band at λ max=281 nm which mainly originates from Trp and Tyr (the small contribution of Phe can be neglected). Both amino acids are representative constituents of the eggshell proteins with average concentrations of 1–1.3 % w/w and 2–4 % w/w. With the molar absorbances from the solution, the protein content is in principle accessible from optical measurements. However, the non‐uniform axial and lateral distribution of the proteins, as well as the lack of reliable transmittance data (the T‐values are too low for quantitative evaluation, see Figure 2 and Figure 4) make a full analysis almost impossible. In a simple approach, we treated the shell as semi‐infinite layer with an optical sampling depth of 5–10 μm,44 and extrapolated the scattering coefficient from Table 2. The results are presented in Table 3. The calculated absorption coefficients may be somewhat different from reality, but the trend of axial protein content is clearly represented by the results. In the brown shell, the outer cuticle region is formed from protein particles63, 64, 65 with a rather high packing of P=0.4–0.5 relative to a compact layer with no voids. In the white shell, the packing is only half the hight. Ablation of a small layer depth strongly reduces the protein content since now most of the shell volume is occupied by calcite. Further ablation reduces the (protein) content even more until the content increases again in the region of the inner shell surface to about half of the cuticle value (the egg membranes were not present in these experiments). The graphical TOC of the abstract visualizes this behavior as cartoon.
Table 3.
(Trp+Tyr) ‐ absorption coefficients α in a white and brown shell estimated from diffuse reflectance data at 280 nm, total internal boundary reflectivity at polar scattering angles sinθ>1.6−1 (corresponding to R0≈0.7), and effective scattering coefficient σ=1300 cm−1. The estimates are valid within an error of ±15 %.
| Irradiation from the | White shell | Brown shell | ||
|---|---|---|---|---|
| R280 | α280 [cm−1] | R280 | α280 [cm−1] | |
| outer surface | 0.140 | 360 | 0.087 | 710 |
| outer surface after mechanical ablation of | ||||
| Δz=20 μm | 0.320 | 55 | 0.214 | 170 |
| Δz≈100 μm | 0.360 | 45 | 0.350 | 50 |
| inner surface | 0.220 | 160 | 0.140 | 350 |
| analytical mean | αmean=50 cm−1 | αmean=90 cm−1 | ||
| (Trp+Tyr) – absorption in a compact transparent protein layer | αcompact=(1400–1600) cm−1 | |||
2.2.3. Depth Distribution of the Color Pigments in the Bi‐Layer Model
The photometric in‐situ analysis of colored shells is challenging because the visible pigment is non‐uniformly distributed over the shell depth. As an analytically manageable crude approximation, we formally subdivide the shell into an outer part 1 with thickness dout and inner part 2. The system can then be described as quadruple layer with three experimental information sets R0120, R0210, and T0120=T0210 (0=shell boundary). Since the scattering coefficients are available by extrapolation from the long wavelength region or from the white shell, the absorption coefficients and thicknesses of the two layer parts are mathematically exactly accessible by iteration (without giving them a priori physical meaning). Table 4 presents results for the first absorption maximum of the brown shell which is not distorted by fluorescence, and for the green shells, here somewhat outside of the broad maximum so that the BV absorption is not distorted by PPIX. Calculations for the outer layer yield very small thicknesses of dout≈10–20 μm, as mentioned in literature.63 Nonetheless, this layer absorbs strongly. The inner layer absorbs much weaker, but still about ten to fifty times more than the white shell, and due to its thickness carries an appreciable fraction of the pigments. It should be mentioned that the results of the simple KM‐model are very comparable to the elaborate RW‐method (remember that K≈2α, see also the evaluations of Table 2). According to the molar absorbance ratios of the two pigments monomers BV/PPIX≈3, the total BV content is much lower than that of PPIX. With the protein data of Figure 3 it is also reasonable to assume that BV is dissolved in the proteins in more or less constant concentration over the whole shell depth, whereas PPIX is segregated to an appreciable fraction close to the outer surface.
Table 4.
Exemplary absorption and scattering coefficients of brown and green eggshells as evaluated for the first absorption maxima in the double‐layer approximation of the i) Kubelka‐Munk (KM) model, considering internal reflectance R0=0.6 at the inner shell boundaries, ii) isotropic Random Walk (RW) approach, considering internal total reflectance of beams emitted with polar angles sinθ>n−1=1.56−1.The scattering coefficients were extrapolated from the wavelength region out of absorption (λ=900–1100 nm). The average concentrations were estimated from the molar absorbances of the monomers in solution.
| Brown shell λ=642 nm dtot=400 μm | Routside | Rinside | Toutside = Tinside | absorption coefficients/cm−1 | dout/μm | average absorption coefficients and concentrations | |
| Experiment | 0.410 | 0.880 | 0.019 | ||||
| Calculated with KM S=800 cm −1 | 0.410 | 0.880 | 0.019 | Kout 171.2 | Kin 0.950 | 14.9 | Kav=7.29 cm−1 Cav=130 nmol/g |
| Calculated with RW σ=1100 cm −1 | 0.409 | 0.882 | 0.019 | αout 85 | αin 0.45 | 18 | αav=4.25 cm−1 Cav=150 nmol/g |
| Light green shell λ=670 nm dtot=360 μm | Routside | Rinside | Toutside = Tinside | absorption coefficients/cm−1 | dout/μm | average absorption coefficient and concentration | |
| Experiment calculated S=750 cm −1 | 0.710 | 0.780 | 0.026 | Kout 31±1 | Kin 3.1±0.3 | 8–10 | Kav=3.8 cm−1 Cav=23 nmol/g |
| Dark green shell λ=670 nm dtot=360 μm | Routside | Rinside | Toutside = Tinside | absorption coefficients/cm−1 | dout/μm | average absorption coefficient and concentration | |
| Experiment calculated S=600 cm −1 | 0.520 | 0.730 | 0.016 | Kout 105±5 | Kin 5.2±0.5 | 9–11 | Kav=7.7 cm−1 Cav=47 nmol/g |
2.2.4. Depth Distribution of the Brown Pigment in the Multi‐Layer Model
The bi‐layer model provides acceptable average absorption coefficients but unrealistic steep gradients between the outer and inner layer parts. We experimentally examined the axial distribution of the brown pigment by mechanical surface ablation. Figure 8 presents results as red points. After ablation of Δz≈20 μm, the reflectance at Q1,max increases appreciably from R642=0.41 to R642=0.59, which is less than expected according to the bi‐layer model (R642=0.88). A large amount of the brown pigment is still present, mainly concentrated in the pores, and visible to the naked eye as dark brown dots. Further ablation reduces the color intensity of the dots, and increases the reflectance via R642=0.73 to R642=0.79. A similar approach was published by Lang and Wells26 who measured the brown shell color with a reflectometer and obtained a reading of R=0.38. After soaking in EDTA, the reading increased to R=0.62 (white shell reference R=0.83).
Figure 8.
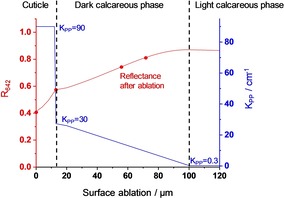
Model of the depth profile of aggregated PPIXn in the brown eggshell, presented as KM‐absorption coefficients KPP (blue curve). Red points: experimental reflectances at the first Q1‐maximum, measured from the outer shell surface during mechanical surface ablation. Red curve: Calculated reflectance inserting KPP(z) with S=800 cm−1 and R0=0.6.
Unlike the bi‐layer approach, a closed analytical presentation of the experiments in Figure 8 is not possible for us. Hence, we used intuitive axial distribution profiles of PPIX (Gaussian, exponential, second order, linear) in order to fit the experiments. Figure 8 presents an acceptable result. The concentration of PPIX is assumed to be constant inside the cuticle. With the beginning presence of calcite, the mean concentration decreases, because only the volume outside of calcite is accessible to PPIX. This volume descends linearly with z to the value responsible for the reflectance from the inner surface of the shell. The theoretical reflectance and transmittance were calculated with the finite‐element method by repetitive application of Eq. 1 and Eq. 2 with the absorption coefficients KPP(z) as given in Figure 8. The result is plotted as a red curve. According to these measurements and the data of Lang and Wells26 vide supra, about 50 % of PPIX is localized in the thin cuticle. The rest is distributed over the shell depth with a decaying gradient. It is is currently unclear whether the decline is due to the protein depth profile of Table 3 or due to the PPIX – concentration in protein.
2.2.5. Depth Positions of the Fluorophores
In Figure 9, we excited fluorescence at λ X=388 nm where the blue‐ as well as the red‐emitting fluorophores absorb. We found both types of fluorescence spectra with comparable intensity (curve a) in the white shell. In the brown shell, we found almost exclusively the red fluorescence (curve b). However, after surface ablation of d≈80 μm, the blue fluorescence re‐appeared with an intensity comparable to the red one (curve c). Within the framework of KM, the intensity of the exciting incident radiation exponentially decays inside the shell according to I exp(‐ . Considering K388≈S/100 in the white shell, the mean penetration depth is then zmean≈70 μm so that the incident radiation reaches the cuticle and the calcareous phase. In the brown shell, the absorption coefficient of K388≈S is resulting in a mean penetration depth of zmean 5 μm so that the incident radiation only reaches the cuticle. Thus, the presence of the monomeric PPIX‐fluorescence can only be explained if the PPIXn‐aggregates dissolved in the protein of the cuticle partly dissociate into monomers
On the other hand, the blue‐emitting fluorophores cannot be localized in the cuticle. They are either formed in the fiber‐structured internal protein, as ionic activators in the calcite structure, or as organic matter entrapped during the fast carbonate synthesis inside or at the surface of the crystallites.66 A hint on the nature of the fluorophore is found in the excitation spectrum of the green fluorescence region at 520 nm. In addition to the excitation maximum at 380 nm (see Figure 3) we detected a second maximum at 276 nm which corresponds to the absorption of Tyr. It is assumed that the triad of adjacent amino acids Ser‐Tyr‐Gly oxidatively forms the imidazolinone ring system which is regarded as precursor of the green fluorescent protein.67
3. Conclusion
In this paper, the depth distribution of the eggshell proteins and the color pigments dissolved therein was analyzed by a combination of optical absorption and fluorescence spectroscopy with irradiation from both shell sides. The interpretation of the data could be supported by additional experiments after mechanical ablation of the outer shell regions. The proteins form a loose agglomerate of particles directly on the outer surface as well as deeply in between the calcite environment. The main color pigment PPIX is dissolved in the strongly pigmented shells preferably as poly‐aggregate in the outer shell regions but also, with lower density, across the whole shell depth. The weakly pigmented shells are dominated by PPIX – dimers, and the “white” shells by PPIX – monomers. The latter were detected by their fluorescence in all shells, whether white, brown or green. We conclude: No eggshell is like the other.
Conflict of interest
The authors declare no conflict of interest.
Supporting information
As a service to our authors and readers, this journal provides supporting information supplied by the authors. Such materials are peer reviewed and may be re‐organized for online delivery, but are not copy‐edited or typeset. Technical support issues arising from supporting information (other than missing files) should be addressed to the authors.
Supplementary
Acknowledgements
The authors thank Dr. Klaus Schwadorf, University of Hohenheim, for the determination of tryptophan and tyrosine in chicken eggshells.
E. Ostertag, M. Scholz, J. Klein, K. Rebner, D. Oelkrug, ChemistryOpen 2019, 8, 1084.
Dedicated to Prof. Dr. Rudolf Kessler on the occasion of his 70th birthday.
Contributor Information
Dr. Edwin Ostertag, Email: edwin.ostertag@reutlingen-university.de.
Prof. Dr. Dieter Oelkrug, Email: dieter.oelkrug@uni-tuebingen.de
References
- 1. Geiger G. S., Maclaury O. W., Quigley G. O., Rollins F. O., Schano E. A., Talmadge O. W., Poult. Sci. 1974, 53, 456–503. [Google Scholar]
- 2. Arias J. L., Fink D. J., Xiao S.-Q., Heuer A. H., Caplan A. I., International Review of Cytology, K. W. Jeon, J. Jarvik, Eds., Academic Press, 1993, Vol. 145, pp 217–250. [DOI] [PubMed] [Google Scholar]
- 3. Zhao R., Xu G. Y., Liu Z. Z., Li J. Y., Yang N., Poult. Sci. 2006, 85, 546–549. [DOI] [PubMed] [Google Scholar]
- 4. Wang X. T., Zhao C. J., Li J. Y., Xu G. Y., Lian L. S., Wu C. X., Deng X. M., Poult. Sci. 2009, 88, 1735–1739. [DOI] [PubMed] [Google Scholar]
- 5. Thomas D. B., Hauber M. E., Hanley D., Waterhouse G. I. N., Fraser S., Gordon K. C., J. Exp. Biol. 2015, 218, 2670–2674. [DOI] [PubMed] [Google Scholar]
- 6. Verdes A., Cho W., Hossain M., Brennan P. L. R., Hanley D., Grim T., Hauber M. E., Holford M., PLoS One 2015, 10, e0143545. [DOI] [PMC free article] [PubMed] [Google Scholar]
- 7. Dearborn D. C., Page S. M., Dainson M., Hauber M. E., Hanley D., Ecol. Evol. 2017, 7, 9711–9719. [DOI] [PMC free article] [PubMed] [Google Scholar]
- 8. Bi H., Liu Z., Sun C., Li G., Wu G., Shi F., Liu A., Yang N., Poult. Sci. 2018, 97, 1948–1953. [DOI] [PubMed] [Google Scholar]
- 9. Narbaitz R., Tsang C. P. W., Grunder A. A., Soares J. H., Poult. Sci. 1987, 66, 341–347. [DOI] [PubMed] [Google Scholar]
- 10. Dennis J. E., Xiao S.-Q., Agarwal M., Fink D. J., Heuer A. H., Caplan A. I., J. Morphol. 1996, 228, 287–306. [DOI] [PubMed] [Google Scholar]
- 11. Lammie D., Bain M. M., Solomon S. E., Wess T. J., J. Bionic Eng. 2006, 3, 11–18. [Google Scholar]
- 12. Parsons A. H., Poult. Sci. 1982, 61, 2013–2021. [Google Scholar]
- 13. Hamilton R. M. G., J. Food Struct. 1986, 5, 13. [Google Scholar]
- 14. Hincke M. T., Nys Y., Gautron J., Mann K., Rodriguez-Navarro A. B., McKee M. D., Front. Biosci. 2012, 17, 1266–1280. [DOI] [PubMed] [Google Scholar]
- 15. Mann K., Olsen J. V., Maček B., Gnad F., Mann M., Proteomics 2007, 7, 106–115. [DOI] [PubMed] [Google Scholar]
- 16. Hincke M. T., Nys Y., Gautron J., J. Poultry Sci. 2010, 47, 208–219. [Google Scholar]
- 17. Mikšík I., Sedláková P., Lacinová K., Pataridis S., Eckhardt A., Anal. Bioanal. Chem. 2010, 397, 205–214. [DOI] [PubMed] [Google Scholar]
- 18. With T. K., Biochem. J. 1974, 137, 596.2. [Google Scholar]
- 19. Wilson P. B., Poult. Sci. 2017, 96, 3747–3754. [DOI] [PMC free article] [PubMed] [Google Scholar]
- 20. Kennedy G. Y., Vevers H. G., Comp. Biochem. Physiol. Part B 1973, 44, 11–25. [DOI] [PubMed] [Google Scholar]
- 21. Halepas S., Hamchand R., Lindeyer S. E. D., Brückner C., J. Chem. Educ. 2017, 94, 1533–1537. [Google Scholar]
- 22. Lukanov H., Genchev A., Pavlov A., Trakia J. Sci. 2015, 2, 149–158. [Google Scholar]
- 23. Tamura T., Fujii S., J. Fac. Fish. Anim. Husb. Hiroshima Univ., Hiroshima University ; 1967, 7, 35–41. [Google Scholar]
- 24. Baker J. R., Balch D. A., Biochem. J. 1962, 82, 352. [DOI] [PMC free article] [PubMed] [Google Scholar]
- 25. Dean M. L., Miller T. A., Brückner C., J. Chem. Educ. 2011, 88, 788–792. [Google Scholar]
- 26. Lang M. R., Wells J. W., World Poultry Sci. J. 2007, 43, 238–246. [Google Scholar]
- 27. Fecheyr-Lippens D. C., Igic B., D′Alba L., Hanley D., Verdes A., Holford M., Waterhouse G. I. N., Grim T., Hauber M. E., Shawkey M. D., Biol. Open 2015, 4, 753–759. [DOI] [PMC free article] [PubMed] [Google Scholar]
- 28. Samiullah S., Roberts J. R., Poult. Sci. 2013, 92, 2783–2788. [DOI] [PubMed] [Google Scholar]
- 29. Siefferman L., Navara K. J., Hill G. E., Behav. Ecol. Sociobiol. 2006, 59, 651–656. [Google Scholar]
- 30. Lahti D. C., The Auk: Ornithol. Adv. 2008, 125, 796–802. [Google Scholar]
- 31. Butler M. W., Waite H. S., J. Avian Biol. 2016, 47, 491–499. [Google Scholar]
- 32. Hargitai R., Boross N., Nyiri Z., Eke Z., J. Avian Biol. 2018, 49, 1–12. [Google Scholar]
- 33. Cassey P., Portugal S. J., Maurer G., Ewen J. G., Boulton R. L., Hauber M. E., Blackburn T. M., PLoS One 2010, 5, e12054. [DOI] [PMC free article] [PubMed] [Google Scholar]
- 34. Kelber A., Vorobyev M., Osorio D., Biol. Rev. 2003, 78, 81–118. [DOI] [PubMed] [Google Scholar]
- 35. Igic B., Fecheyr-Lippens D., Xiao M., Chan A., Hanley D., Brennan P. R. L., Grim T., Waterhouse G. I. N., Hauber M. E., Shawkey M. D., J. R. Soc. Interface 2015, 12. [DOI] [PMC free article] [PubMed] [Google Scholar]
- 36. Wegmann M., Vallat-Michel A., Richner H., J. Avian Biol. 2015, 46, 597–607. [Google Scholar]
- 37. Cassey P., Hauber M. E., Maurer G., Ewen J. G., Methods Ecol. Evol. 2012, 3, 450–456. [Google Scholar]
- 38. Hanley D., Šulc M., Brennan P. L. R., Hauber M. E., Grim T., M. Honza, Ecol. Evol. 2016, 6, 4192–4202. [DOI] [PMC free article] [PubMed] [Google Scholar]
- 39. Navarro J. Y., Lahti D. C., PLoS One 2014, 9, e116112. [DOI] [PMC free article] [PubMed] [Google Scholar]
- 40. Maurer G., Portugal S. J., Hauber M. E., Mikšík I., Russell D. G. D., Cassey P., Funct. Ecol. 2015, 29, 209–218. [Google Scholar]
- 41. Lahti D. C., Ardia D. R., Am. Nat. 2016, 187, 547–563. [DOI] [PubMed] [Google Scholar]
- 42.L. Berzina-Cimdina, N. Borodajenko, Research of calcium phosphates using Fourier transform infrared spectroscopy. In Infrared Spectroscopy-Materials Science, Engineering and Technology, T. Theophile, Ed., IntechOpen, Rijeka, 2012.
- 43. Rodríguez-Navarro A. B., Domínguez-Gasca N., Muñoz A., Ortega-Huertas M., Poultr. Sci. 2013, 92, 3026–3035. [DOI] [PubMed] [Google Scholar]
- 44. Oelkrug D., Brun M., Rebner K., Boldrini B., Kessler R. W., Appl. Spectrosc. 2012, 66, 934–943. [DOI] [PubMed] [Google Scholar]
- 45. Chandrasekhar S., Radiative Transfer. Dover Publications, 1960. [Google Scholar]
- 46. Kubelka P., Munk F., Z. Tech. Phys. 1931, 12, 593–601. [Google Scholar]
- 47. Kubelka P., J. Opt. Soc. Am. 1948, 38, 448–448. [DOI] [PubMed] [Google Scholar]
- 48. Kubelka P., J. Opt. Soc. Am. 1954, 44, 330–335. [Google Scholar]
- 49.Regulation of the European Community no. 152/2009 laying down the methods of sampling and analysis for the official control of feed, 2009.
- 50. Oelkrug D., Brun M., Hubner P., Rebner K., Boldrini B., Kessler R., Appl. Spectrosc. 2013, 67, 385–395. [DOI] [PubMed] [Google Scholar]
- 51. Stokes G. G., Proc. R. Soc. London 1862, 11, 545–556. [Google Scholar]
- 52. Falk J. E. R., Porphyrins and metalloporphyrins. Elsevier, Amsterdam, 1964. [Google Scholar]
- 53. Teale F. W. J., Biochem. J. 1960, 76, 381. [DOI] [PMC free article] [PubMed] [Google Scholar]
- 54. Wetlaufer D. B., Ultraviolet spectra of proteins and amino acids. In Advances in Protein Chemistry, C. B. Anfinsen, K. Bailey, M. L. Anson, J. T. Edsall, Eds., Academic Press, 1963, Vol. 17, pp 303–390. [Google Scholar]
- 55. Strickland E. H., Horwitz J., Kay E., Shannon L. M., Wilchek M., Billups C., Biochem. 1971, 10, 2631–2638. [DOI] [PubMed] [Google Scholar]
- 56. Ghisaidoobe A., Chung S., Int. J. Mol. Sci. 2014, 15, 22518–22538. [DOI] [PMC free article] [PubMed] [Google Scholar]
- 57. Oelkrug D., Radjaipour M., Erbse H., Z. Phys. Chem. 1974, 88, 23–36. [Google Scholar]
- 58. Oelkrug D., Erbse H., Plauschinat M., Z. Phys. Chem. 1975, 96, 283–296. [Google Scholar]
- 59. Ohno O., Kaizu Y., Kobayashi H., J. Chem. Phys. 1993, 99, 4128–4139. [Google Scholar]
- 60. Hestand N. J., Spano F. C., Chem. Rev. 2018, 118, 7069–7163. [DOI] [PubMed] [Google Scholar]
- 61. Lozovaya G. I., Masinovsky Z., Sivash A. A., Origins Life Evol. Biospheres 1990, 20, 321–330. [Google Scholar]
- 62. Kortüm G., Oelkrug D., ZNA 1964, 19, 28. [Google Scholar]
- 63. Simons P. C. M., Wiertz G., Z. Zellforsch. Mikrosk. Anat. 1963, 59, 555–567. [Google Scholar]
- 64. Fraser A. C., Bain M. M., Solomon S. E., Br. Poult. Sci. 1999, 40, 626–631. [DOI] [PubMed] [Google Scholar]
- 65. Kusuda S., Iwasawa A., Doi O., Ohya Y., Yoshizaki N., J. Poultry Sci. 2011, 48, 119–124. [Google Scholar]
- 66. Chalmin E., Perrette Y., Fanget B., Susini J., Microsc. Microanal. 2012, 19, 132–144. [DOI] [PubMed] [Google Scholar]
- 67.D. W. Piston, G. H. Patterson, J. Lippincott-Schwartz, N. S. Claxton, M. W. Davidson, Introduction to fluorescent proteins.https://www.microscopyu.com/techniques/fluorescence/introduction-to-fluorescent-proteins (accessed 1903).
Associated Data
This section collects any data citations, data availability statements, or supplementary materials included in this article.
Supplementary Materials
As a service to our authors and readers, this journal provides supporting information supplied by the authors. Such materials are peer reviewed and may be re‐organized for online delivery, but are not copy‐edited or typeset. Technical support issues arising from supporting information (other than missing files) should be addressed to the authors.
Supplementary


