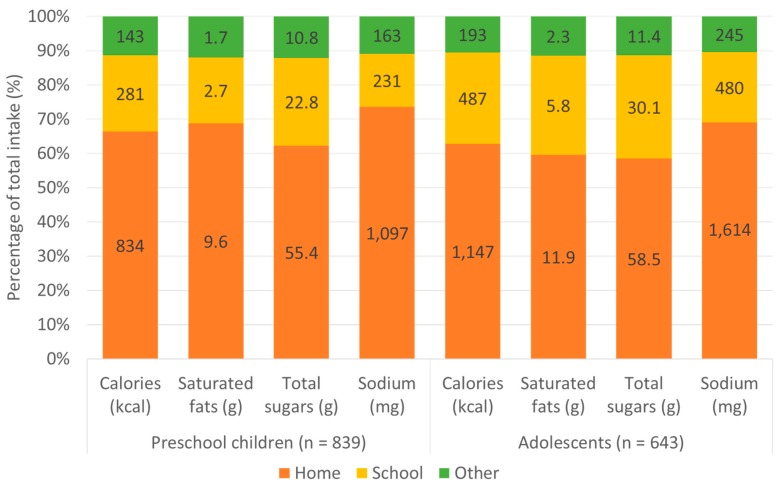
Figure 2.
Percentage and absolute per capita intake of calories and key nutrients of concern by eating location among low- and middle-income Chilean preschool children and adolescents from Southeast Santiago, 2016. Note: Values inside the bars represent the absolute intake by eating location. We calculated percentages by dividing the total intake of each nutrient by the intake at each eating location.

