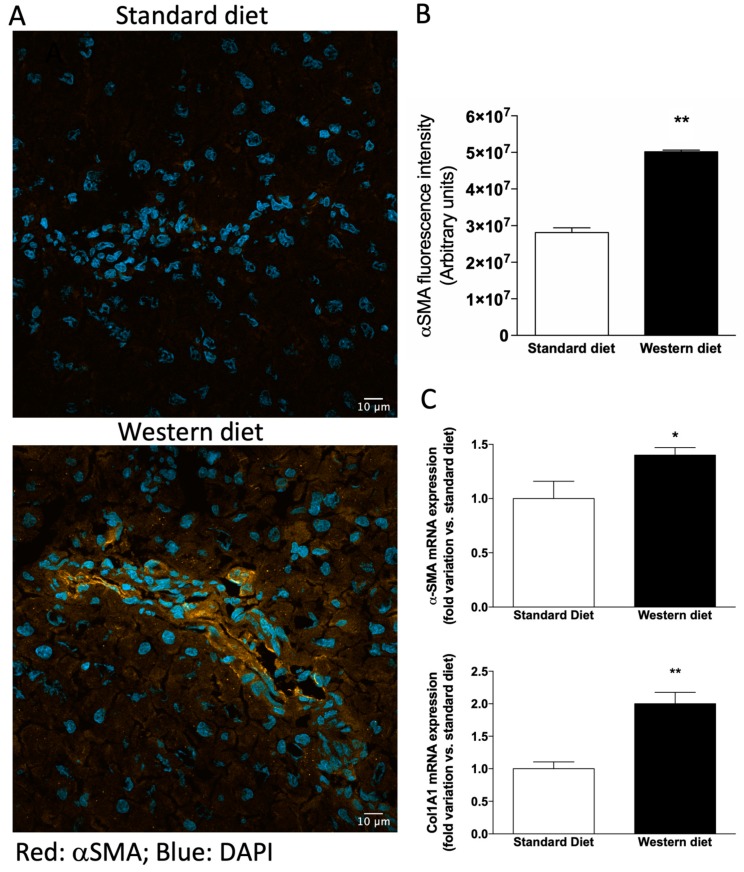
Figure 4.
Activation of hepatic stellate cells. (A) Representative photomicrographs of liver tissue obtained from a rat fed with a standard (upper panel) and Western (lower panel) diet stained with α−SMA, a marker of hepatic stellate cells (HSCs) activation. (B) Quantification of α−SMA-related immunofluorescence. Values are reported as means ± S.E.M. Representative images from five independent experiments are shown. Cell nuclei are stained blue with DAPI. (C) mRNA expression of the fibrosis markers α−SMA and Col1A1. * p < 0.05 and ** p < 0.01 vs. rats fed with standard diet.

