Abstract
Background
Plasma-free amino acid profiles have been reported to correlate with obesity and glucose metabolism, and have been studied as potentially useful biomarkers of lifestyle-related diseases affecting metabolism in adulthood. However, knowledge of these relationships is lacking in children, despite the growing public health problem posed by childhood obesity.
The aim of this study was to assess whether plasma-free amino acid profiles can serve as useful biomarkers of lifestyle-related diseases in children with obesity.
Methods
This retrospective study used the medical records of 26 patients (15 male, 11 female) aged 9 or 10 years presenting with moderate to severe obesity and hyperlipidemia between April 2015 and March 2017. A degree of obesity of 30% or more was defined as moderate or severe. Amino acid levels were compared between obese children with and without impaired glucose tolerance using a t-test or Mann–Whitney U test. In addition, the influence of factors such as intima media thickness, low-density lipoprotein cholesterol, high-density lipoprotein cholesterol, amino acids, and homeostasis model assessment-insulin resistance (HOMA-IR) were analyzed pairwise using Pearson’s correlation or Spearman’s rank correlation.
Results
HOMA-IR was positively correlated with valine, leucine (Leu), isoleucine, phenylalanine, tryptophan, methionine, threonine, lysine, alanine, tyrosine, glutamate (Glu), proline, arginine, ornithine, total free amino acids (all P < 0.01), and aspartate (P = 0.010). Moreover, blood uric acid levels were positively correlated with Leu (P = 0.005) and Glu (P = 0.019), and negatively correlated with serine, glycine, and asparagine (P = 0.007, P = 0.003, and P = 0.013, respectively).
Conclusions
Amino acid profile reflects impaired glucose tolerance and hyperuricemia at an early stage of obesity. It is therefore a useful marker to inform early intervention in children with obesity, as in adults.
Electronic supplementary material
The online version of this article (10.1186/s12887-019-1647-8) contains supplementary material, which is available to authorized users.
Keywords: Amino acids, Homeostasis model assessment-insulin resistance, Obesity, Uric acid
Background
Childhood obesity is one of the most serious public health problems. The number of obese children under the age of five is gradually increasing all over the world. Forty-two million children under 5 years of age are estimated to be affected by overweightness and obesity worldwide [1]. Overweightness and obesity in early childhood also lead to a higher risk of overweightness and obesity in adulthood [2], and confer an increased risk of chronic inflammatory conditions including diabetes mellitus (DM), cardiovascular diseases, non-alcoholic fatty liver disease, and some cancers. Although cerebrovascular and cardiovascular events rarely occur in childhood, even in severe obesity, obesity in childhood is likely to result in a significant long-term economic burden on society, with associated excess lifetime health care [3] and indirect costs [4] including sick leave, reduced productivity, and premature mortality. Symptomatic pediatric lifestyle-related diseases are present in 5–15% of obese children and their incidence increases after late elementary school age. Moreover, obesity in childhood drives higher morbidity and mortality compared to obesity developed during adulthood. Therefore, intervention against childhood obesity is very important. This study focused on children aged 9 or 10 years who were subjected to screening and intervention for obesity to prevent adult and pediatric lifestyle diseases.
Amino acid (AA) profiles have been used as a biomarker of obesity and DM. We previously reported that the plasma concentrations of valine (Val), leucine (Leu), and isoleucine (Ile), as well as the total branched chain amino acids (BCAA), alanine (Ala), citrulline (Cit), and proline (Pro), were significantly higher in diabetic mice than in normal mice [5]. Wang et al. [6] reported a 12-year follow-up study showing that plasma levels of BCAA, tyrosine (Tyr), and phenylalanine (Phe) could be predictors of the future development of diabetes in nondiabetic subjects. Other studies have reported significant associations between the plasma levels of specific AAs and body mass index (BMI) [7], AAs, and glucose regulation [8]. In a study on Japanese obesity, Takashina et al. [9] reported specific associations between specific AAs including Val, Leu, Ala, and Cit, the type/degree of obesity, and indices of glucose/insulin regulation in Japanese adults with normal glucose metabolism.
In this study, we analyzed the correlation of blood amino acids and obese metabolic states to assess whether plasma-free amino acid profiles can become useful biomarkers of lifestyle-related diseases in children with obesity. Moreover, we discussed the metabolic role of amino acids in children with obesity. This study included a clinical laboratory-based examination and measurement of the intima media thickness (IMT) of the internal carotid artery as a marker of metabolic state.
Methods
Study design
We retrospectively studied the medical records of 26 patients (male: 15, female: 11), aged 9 or 10 years, who presented in the Department of Pediatrics, Kumamoto University Hospital with moderate to severe obesity (defined as a degree of obesity ≥30%) at the first and second (after 6 months) screenings performed in Kumamoto City between April 2014 and March 2016. Degree of obesity was calculated according to the formula: ([real body weight–standard body weight depending on age] ÷ the standard weight × 100), as defined by the Japanese Society for Pediatric Endocrinology [10].
Clinical evaluation
Clinical information, including age, sex, symptoms, present condition, medical history, medication use, and family history, was recorded on a standardized data form by the examining medical staff during the patients’ visits. The degree of obesity, body mass index (BMI), blood pressure, blood uric acid (UA), liver function [alanine aminotransferase (ALT), aspartate aminotransferase (AST), lactate dehydrogenase (LDH), and γ-glutamyltransferase (γ-GTP)], glucose tolerance [fasting blood glucose, insulin, C-peptide, and homeostasis model assessment-insulin resistance (HOMA – IR)], and blood lipid levels [total cholesterol (T-CHO), low-density lipoprotein cholesterol (LDL-CHO), high-density lipoprotein cholesterol (HDL-CHO), and triglyceride (TG)] were evaluated. The blood samples of obese children were collected after fasting for 12 h.
Assay of amino acid levels and measurement of intima media thickness
Plasma amino acids were analyzed using a liquid chromatograph mass spectrometer (SRL, Inc., Tokyo, Japan). The IMTs of the internal left and right carotid arteries were measured using an Aplio XG ultrasound machine (Toshiba Medical System Corporation, Tochigi, Japan) and double-checked by two technicians. The IMTs were measured at three points of both internal carotid arteries and averaged (Additional file 1).
Data quality analysis
Two researchers, who did not participate in the medical diagnosis, ultrasonography, blood analysis, or medical record evaluation, performed the data and statistical analyses in this study.
Statistical analysis
We compared amino acid levels between obese children with and without impaired glucose tolerance using a t-test or Mann–Whitney U test. The factors IMT, LDL- and HDL-CHO (LDL/HDL ratio), amino acids, HOMA-IR, and UA were analyzed pairwise using Pearson’s correlation or Spearman’s rank correlation in IBM SPSS Statistics ver. 25. HOMA-IR and UA were dependent variables for predicting blood amino acid values, such as Val, Leu, and Ile, which are independent variables. The IMT and LDL/HDL ratio, were not dependent variables for blood amino acid values. A two-sided probability value of P < 0.05 was considered to be statistically significant. We also compared BMI, IMT, insulin, LDL-CHO, and amino acid levels before and after intervention using a paired t-test or Wilcoxon signed-rank test. Average values are presented as the mean ± one standard deviation.
Ethical approval and informed consent
This study was approved by the Ethics Committee of the Graduate School of Medical Sciences, Kumamoto University. Informed consent was obtained from the parents of all the children included in this study or the parents and children.
Results
Clinical observations
In this study, we evaluated 15 male (age: 122.2 ± 4.2 months) and 11 female (age: 122.9 ± 4.1 months) obese children. Their heights, weights, and BMIs were 140.4 ± 6.4 and 140.0 ± 4.2 cm, 46.6 ± 7.6 and 45.8 ± 6.9 kg, and 23.5 ± 2.5 and 23.3 ± 2.4, respectively (Additional file 1).
Nineteen percent (5/26) of obese children in this study developed simple obesity with no abnormalities in blood data, 58% (15/26) developed hypercholesterolemia (LDL-CHO ≥ 140 mg/dL), 19% (5/26) developed hypertriglyceridemia (TG ≥ 120 mg/dL), 8% (2/26) developed hypoHDLemia (HDL-CHO < 40 mg/dL), 19% (5/26) developed hyperuricemia (UA ≥ 6 mg/dL), 35% (9/26) developed impaired glucose tolerance (HOMA-R ≥ 2.5), and 27% (7/26) developed liver damage (ALT > 30 IU/L). None of the children presented significant arteriosclerotic lesions in either of their internal carotid arteries. The average IMTs were 0.54 ± 0.06 mm (left: 0.55 ± 0.07 mm; right: 0.54 ± 0.07 mm).
Correlations involving lipid levels
T-CHO and LDL-CHO levels were negatively correlated with BMI, HOMA-IR, blood insulin, and γ-GTP levels (Table 1). Levels of HDL were negatively correlated with IMT (N = 26; P = 0.039), and LDL/HDL ratios were positively correlated with IMT (N = 26; P = 0.023) (Table 1). We also observed a negative correlation between the LDL/HDL ratio and blood Tyr levels. Additional file 1 details comparisons of laboratory metabolic data between obese children with LDL/HDL ratio ≤ 2.0 and LDL/HDL ratio > 2.0. There were no significant associations between LDL/HDL ratio and HOMA-IR or LDL/HDL ratio and amino acids (Tables 1 and 2, Additional file 1). However, LDL/HDL ratio was positively correlated with IMT (Additional file 1).
Table 1.
Correlation of physical and biochemical variables in children with obesity
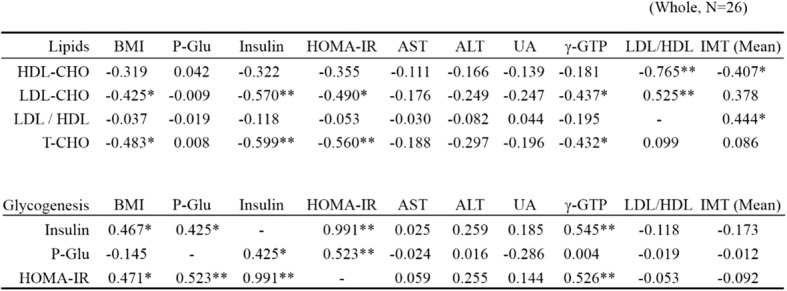
BMI body mass index, P-Glu plasma glucose, AST aspartate aminotransferase, ALT alanine aminotransferase, UA Uric acid, γ-GTP γ-glutamyltransferase, IMT intima media thickness, HDL high-density lipoprotein, LDL low-density lipoprotein, TCHO total cholesterol. N = 26; *P < 0.05; **P < 0.01
Table 2.
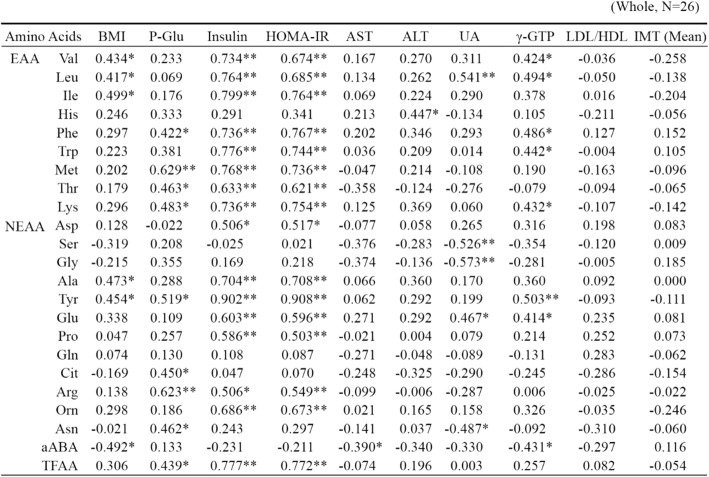
Plasma amino acids profile in children with obesity
BMI body mass index, P-Glu plasma glucose, AST aspartate aminotransferase, ALT alanine aminotransferase, UA uric acid, γ-GTP γ-glutamyltransferase, HDL high-density lipoprotein, LDL low-density lipoprotein, IMT intima media thickness, EAA essential amino acids, Val Valine, Leu leucine, Ile isoleucine, His histidine, Phe phenylalanine, Trp tryptophan, Met methionine, Thr threonine, Lys lysine, NEAA non-essential amino acids, Asp aspartate, Ser Serine, Gly glycine, Ala alanine, Tyr tyrosine, Glu glutamate, Pro proline, Gln glutamine, Cit citrulline, Arg arginine, Orn ornithine, Asn asparagine, aABA α-aminobutyric acid, TAA total amino acids. N = 26; *P < 0.05; **P < 0.01
Correlations involving insulin resistance
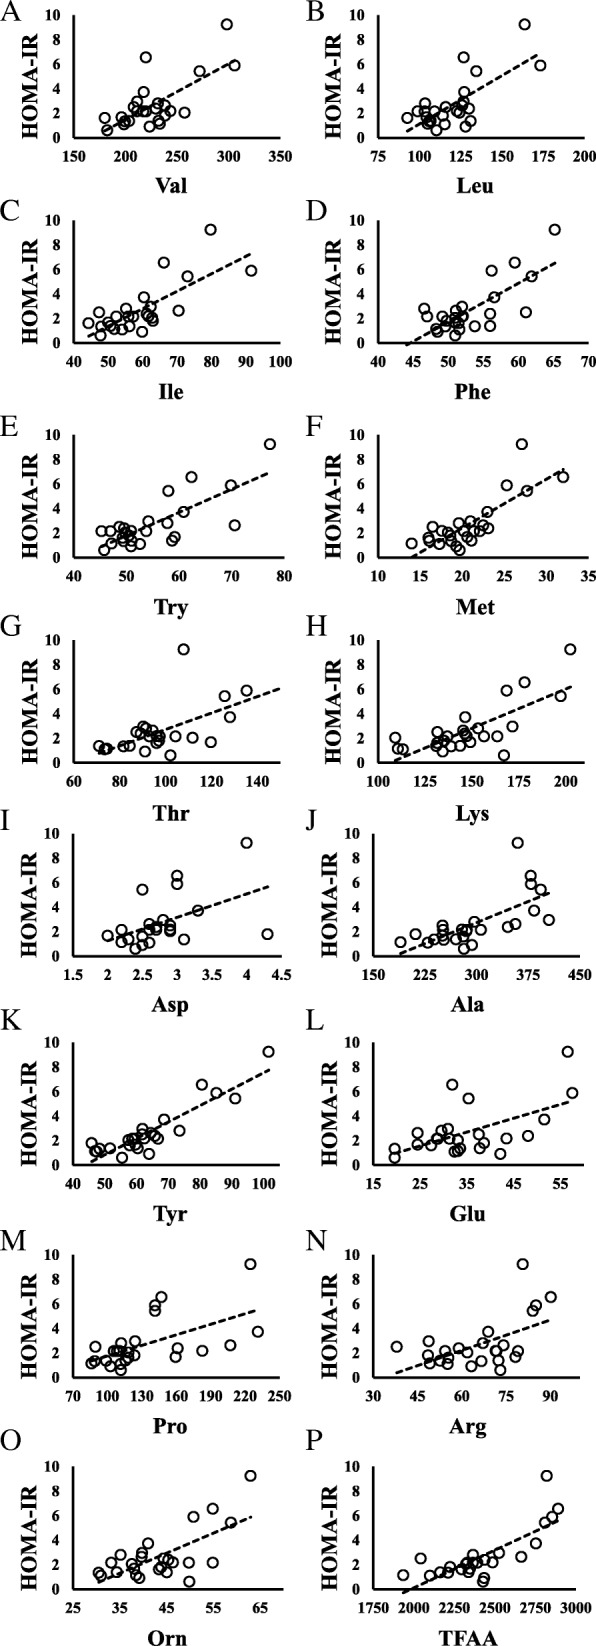
Figure 1 shows scatter diagrams demonstrating correlations between HOMA-IR and amino acid levels. HOMA-IR was positively correlated with Val, Leu, Ile, Phe, tryptophan (Trp), methionine (Met), threonine (Thr), lysine (Lys), Ala, Tyr, glutamate (Glu), Pro, arginine (Arg), ornithine (Orn), and total free amino acids (TFAA) (all P < 0.01), and aspartate (Asp) (P = 0.010) (Table 2).
Fig. 1.
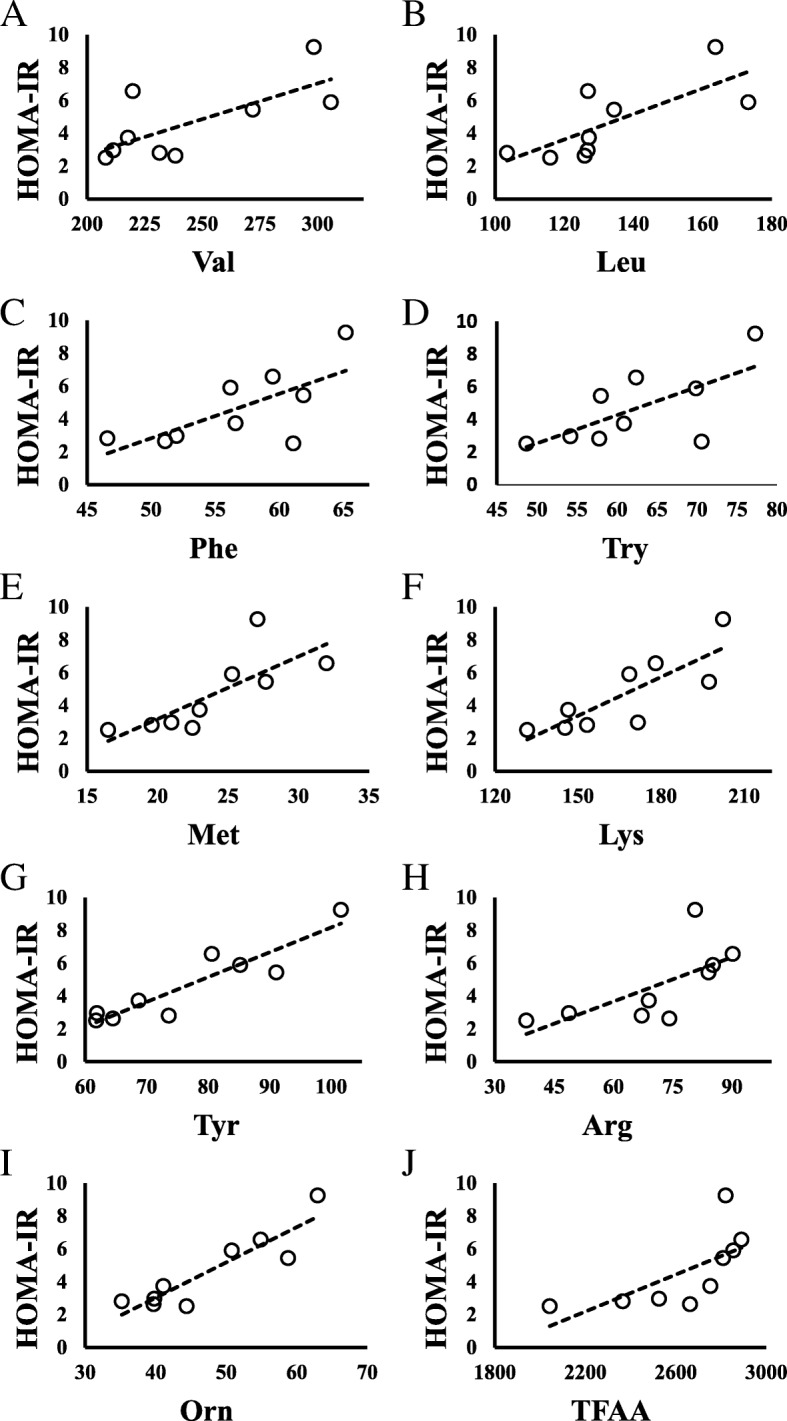
Relationship between HOMA-IR and amino acids in children with impaired glucose tolerance (HOMA-IR ≥2.5). a HOMA-IR vs Valine; N = 9, y = 0.0434x - 5.9926, R2 = 0.5007, P = 0.033. b HOMA-IR vs Leucine; N = 9, y = 0.0776x - 5.6865, R2 = 0.5482, P = 0.023. c HOMA-IR vs Phenylalanine; N = 9, y = 0.2707x - 10.711, R2 = 0.4843, P = 0.037. d HOMA-IR vs Tryptophan; N = 9, y = 0.1725x - 6.0928, R2 = 0.4479, P = 0.049. e HOMA-IR vs Methionine; N = 9, y = 0.3807x - 4.4448, R2 = 0.5995, P = 0.014. f HOMA-IR vs Lysine; N = 9, y = 0.0787x - 8.4333, R2 = 0.6733, P = 0.007. g HOMA-IR vs Tyrosine; N = 9, y = 0.151x - 6.9265, R2 = 0.843, P = 0.000. h HOMA-IR vs Arginine; N = 9, y = 0.0899x - 1.7275, R2 = 0.4625, P = 0.044. i HOMA-IR vs Ornithine; N = 9, y = 0.2148x - 5.5718, R2 = 0.8164, P = 0.001. j HOMA-IR vs Total amino acids; N = 9, y = 0.0056x - 10.198, R2 = 0.4655, P = 0.043
Metabolic data from obese children with HOMA-IR ≤1.6, 1.6 < HOMA-IR < 2.5, and HOMA-IR ≥ 2.5 are presented in Tables 3 and 4. The blood levels of Val, Leu, Ile, Phe, Trp, Met, Thr, Lys, Asp, Ala, Tyr, Pro, Hydroroxyproline, TFAA, essential amino acids (EAA), non-essential amino acids (NEAA), and branched-chain amino acids (BCAA) were higher in obese children with impaired glucose tolerance (HOMA-IR ≥ 2.5, N = 8) than in those without impaired glucose tolerance (HOMA -IR ≤1.6, N = 9) (Table 4). Children with impaired glucose tolerance (HOMA-IR ≥2.5) showed positive correlations between HOMA-IR and levels of Val, Leu, Phe, Trp, Met, Lys, Tyr, Arg, Orn, and TFAA. Figure 2 shows scatter diagrams demonstrating correlations between HOMA-IR and blood amino acid levels.
Table 3.
Blood test values in children with and without impaired glucose tolerance
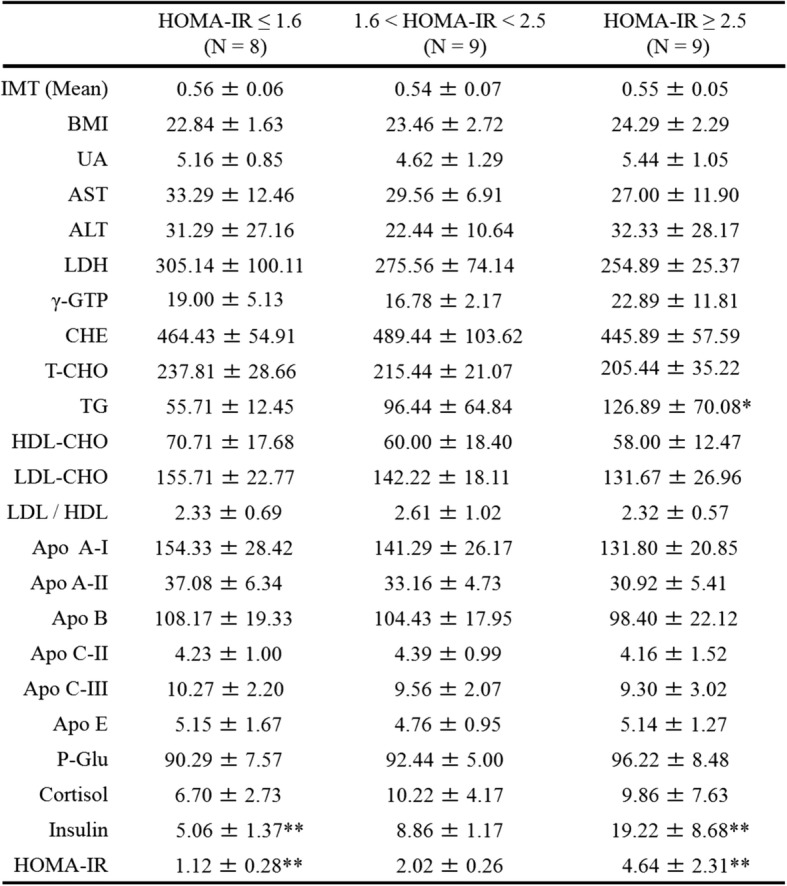
BMI body mass index, UA uric acid, AST aspartate aminotransferase, ALT alanine aminotransferase, LDH lactase dehydrogenase, γ-GTP γ-glutamyltransferase, CHE colinesterase, T-CHO total cholesterol, TG triglyseride, HDL-CHO high-density lipoprotein cholesterol, LDL-CHO low-density lipoprotein cholesterol, Apo A-I apolipoprotein fraction A-I, Apo A-II apolipoprotein fraction A-II, Apo B apolipoprotein fraction B, Apo C-II apolipoprotein fraction C-II, Apo C-III Apolipoprotein fraction C-III, Apo E apolipoprotein fraction E, P-Glu Plasma glucose, AST aspartate aminotransferase, ALT alanine aminotransferase, IMT intima media thickness. Values are shown as the mean ± SD; *P < 0.05; **P < 0.01. P value VS a group with HOMA-IR ≤1.6
Table 4.
Blood amino acid levels in children with and without impaired glucose tolerance
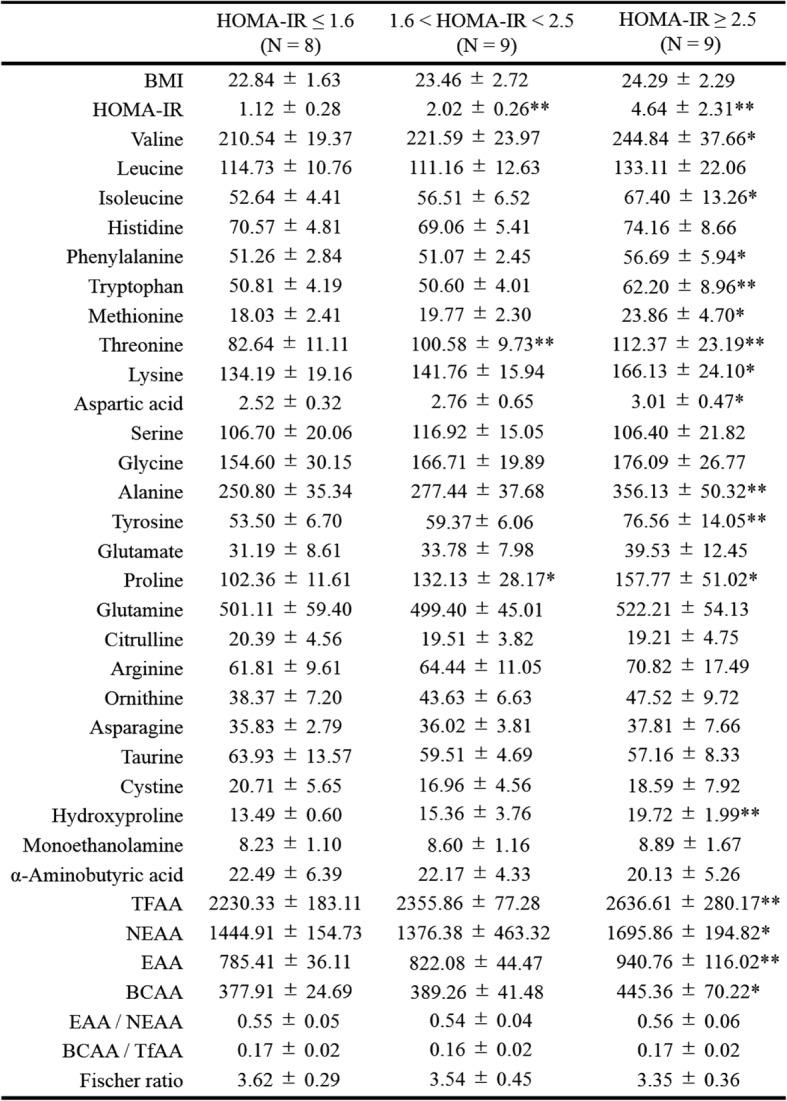
TFAA total free amino acids, EAA essential amino acids, NEAA non-essential amino acids, BCAA branched chain amino acids, amino acids nmol/mL. Values are shown as mean ± SD; *P < 0.05; **P < 0.01. P value VS a group with HOMA-IR ≤1.6
Fig. 2.
Relationship between HOMA-IR and amino acids in all children. a HOMA-IR vs Valine; N = 26, y = 0.0456x - 7.6445, R2 = 0.488, P = 0.000. b HOMA-IR vs Leucine; N = 26, y = 0.0791x - 6.7905, R2 = 0.5249, P = 0.000. c HOMA-IR vs Isoleucine; N = 26, y = 0.1423x - 5.7363, R2 = 0.5791, P = 0.000. d HOMA-IR vs Phenylalanine; N = 26, y = 0.3157x - 14.067, R2 = 0.5585, P = 0.000. e HOMA-IR vs Tryptophan; N = 26, y = 0.1893x - 7.6714, R2 = 0.5930, P = 0.000. f HOMA-IR vs Methionine; N = 26, y = 0.3979x - 5.5475, R2 = 0.6411, P = 0.000. g HOMA-IR vs Threonine; N = 26, y = 0.067x - 3.9788, R2 = 0.4209, P = 0.001. h HOMA-IR vs Lysine; N = 26, y = 0.0641x - 6.8073, R2 = 0.5611, P = 0.000. i HOMA-IR vs Aspartate; N = 26, y = 1.9114x - 2.5529, R2 = 0.2374, P = 0.010. j HOMA-IR vs Alanine; N = 26, y = 0.0228x - 4.105, R2 = 0.4683, P = 0.000. k HOMA-IR vs Tyrosine; N = 26, y = 0.1339x - 5.8458, R2 = 0.8182, P = 0.000. l HOMA-IR vs Glutamate; N = 26, y = 0.1127x - 1.2491, R2 = 0.3196, P = 0.001. m HOMA-IR vs Proline; N = 26, y = 0.0287x - 1.1086, R2 = 0.3333, P = 0.002. n HOMA-IR vs Arginine; N = 26, y = 0.0827x - 2.7473, R2 = 0.2986, P = 0.004. o HOMA-IR vs Ornithine; N = 26, y = 0.1631x - 4.394, R2 = 0.4691, P = 0.000. p HOMA-IR vs Total AA; N = 26, y = 0.0061x - 12.182, R2 = 0.6059, P = 0.000
In obese children with decreased HOMA-IR after 6 months of medication-free intervention such as nutritional and exercise guidance, the levels of Val, Leu, Ile, Asp, Ala, Tyr, Glu, and Pro decreased, but those of Gly and Ser increased (Additional file 1). In contrast, in obese children with increased HOMA-IR after intervention, all these amino acids tended to increase (Additional file 1).
Correlations involving UA
Interestingly, UA was positively correlated with Leu (P = 0.005) and Glu (P = 0.019), and negatively correlated with serine (Ser), glycine (Gly), and asparagine (Asn) (P = 0.007, P = 0.003, and P = 0.013, respectively) (Table 2). Figure 3 shows scatter diagrams depicting these correlations. No amino acids were correlated with IMT (Table 2).
Fig. 3.
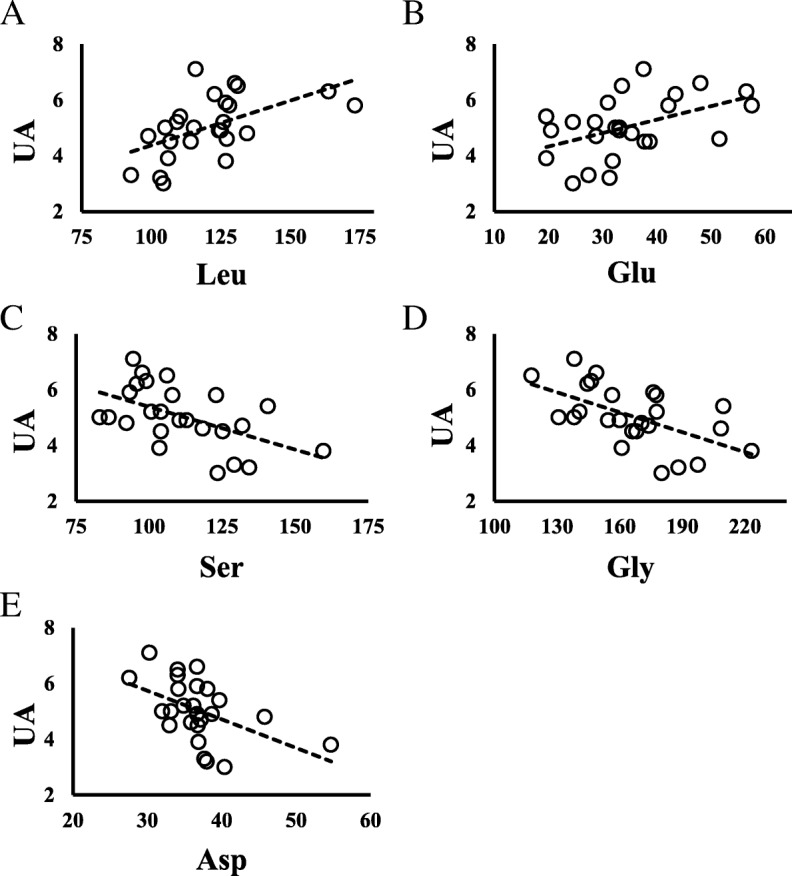
Relationships between UA and amino acids in all children. a UA vs Leucine; N = 26, y = 0.032x + 1.1692, R2 = 0.2925, P = 0.005. b UA vs Glutamate; N = 26, y = 0.048x + 3.3752, R2 = 0.2183, P = 0.019. c UA vs Serine; N = 26, y = − 0.0307x + 8.4566, R2 = 0.2769, P = 0.007. d UA vs Glycine; N = 26, y = − 0.0238x + 9.0036, R2 = 0.328, P = 0.003. e UA vs Asparagine; N = 26, y = − 0.1028x + 8.826, R2 = 0.2375, P = 0.013
Discussion
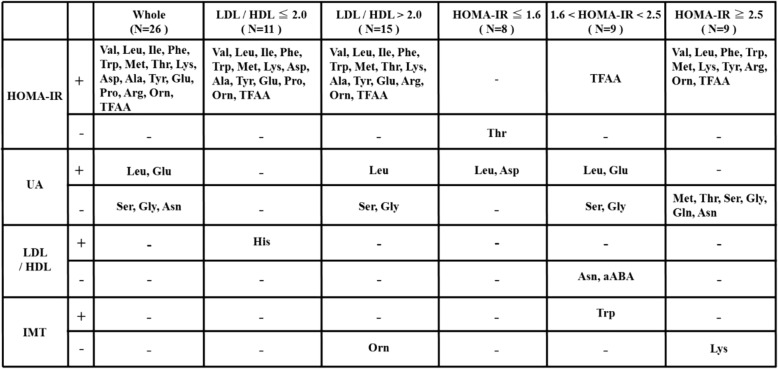
Table 5 summarizes the relationship between blood amino acids and HOMA-IR, UA, LDL/HDL, and IMT. Obesity often transfers from early childhood through school age, and it extends into adulthood in an estimated 50% of cases. There are some reports that obesity, hyperlipidemia, and hyperglycemia in the adult are significantly correlated with IMT, and are risk factors for severely elevated IMT [11, 12]. This correlation has also been seen in children [13, 14]. Although arteriosclerosis is not common in obese children, their IMT tends to be higher than in non-obese children [14, 15]. In this study, we found that IMT correlated negatively with HDL-CHO and positively with LDL/HDL ratio, although a positive correlation with LDL-CHO was not present. These findings suggest that obesity drives arteriosclerotic changes even in childhood. The risk factors for atherosclerosis include hypertension, hyperglycemia, and hyperlipidemia; however, few obese children develop hypertension. Hyperlipidemia and hyperglycemia are considered to be the most important risk factors for atherosclerosis. In our obese children group, blood glucose and insulin resistance did not affect IMT significantly, but the lipid metabolic parameter significantly correlated with IMT.
Table 5.
Summary of correlations between blood amino acids and HOMA-IR, UA, LDL/HDL ratio, and IMT
Val valine, Leu leucine, Ile isoleucine, Phe phenylalanine, Trp tryptophan, Met methionine, Thr threonine, Lys lysine, Asp asparate, Ala alanine, Tyr tyrosine, Glu glutamate, Pro proline, Arg arginine, Orn ornithine, Ser serine, Gly glycine, Asn asparagine, aABA α-aminobutyric acid
The presence in childhood of a higher number of risk factors for the development of lifestyle-related diseases is associated with greater IMT in adults [16, 17]. Raitakari et al. [16] reported that a number of risk factors for atherosclerosis measured in 12- to 18-year-old adolescents, including high levels of LDL-CHO, BMI, and systolic blood pressure, were directly related to carotid IMT in adults. The presence of these risk factors at infant and school ages also affected IMT in adults. Therefore, we should consider treating children with obesity as a disease group, rather than simply as a group with lifestyle-related risk factors for future illness.
Elevated levels of amino acids such as BCAA, Ala, Glu, Asp, and Tyr, which are related to type II diabetes, have previously been shown in obese children with HOMA-IR ≥ 2.5 [7]. We showed positive correlations between HOMA-IR and several amino acids, including TFAA, in children with impaired glucose tolerance (HOMA-IR ≥2.5). In these children, TFAA was also significantly correlated with blood glucose and insulin. When hyper-nutrition advances and impaired glucose tolerance develops, both glucose and amino acids accumulate. Cells such as hepatocytes and skeletal muscle cells become saturated, and this is considered to lead to hyper aminoacidemia.
Relevant associations between plasma amino acid levels and several other factors have also been documented. Insulin, growth hormone, glucagon, and IGF-1 play important roles in the regulation of energy metabolism in the living body [18–20], and as demonstrated in this study, insulin affects plasma amino acid levels. Some reports have demonstrated a relationship between IMT and amino acids [21, 22]. However, blood amino acids were not significantly correlated with IMT in our study. This phenomenon may be explained by a change in amino acid metabolism and insulin sensitivity in moderately obese children, because IMT was associated with LDL/HDL but not with blood insulin levels or HOMA-IR.
Associations have been shown between BCAAs and metabolic syndrome, obesity, type II diabetes, and/or insulin resistance [7, 23, 24], and BCAAs are a cardiometabolic risk marker independently of BMI category [25]. Increased plasma BCAA and lipids can lead to the development of β-cell dysfunction, which can accelerate the transition from an obese, insulin-resistant state to metabolic syndrome and type II diabetes [24]. Pozefsky et al. [26] suggested that impaired insulin activity and decreased utilization of amino acids in the muscles increased plasma BCAA levels owing to reduced uptake of BCAA in the muscles in lifestyle-related diseases. Moreover, Newgard [24] reasoned that the increased circulating blood BCAA in obese and insulin-resistant subjects partly results from a decline of AA catabolism in their adipose tissue. Readily usable glucose and lipid substrates are considered to obviate the need for AA catabolism in adipose tissue by downregulation of the BCAA catabolic enzymes through the suppression of peroxisome proliferator-activated receptor-γ signaling in such metabolic adaptations.
Another particularly relevant amino acid is Ala. Würtz et al. [27] reported that gluconeogenesis substrates including Ala increased in adults with impaired glucose tolerance. Moreover, Shimizu et al. [28] reported that depletion of plasma Ala serves as a cue to increase plasma fibroblast growth factor 21 values and enhance liver-fat communication, resulting in the activation of lipolytic genes in adipose tissues.
Amino acids are not only essential nutrients serving as an energy source for the human body, but are also involved in many biochemical processes including the biosynthesis of purines and UA production. In recent years, many factors including BMI, alcohol intake, hyperlipidemia, and diabetes have been found to contribute to increasing blood UA levels [29]. Our study indicated that in obese children, UA may be affected by amino acid metabolism rather than hyperglycemia and hyperinsulinemia. We found decreased levels of Gly and Ser with increased blood UA levels. Decreased blood Gly and Ser levels have previously been shown in adult patients with asymptomatic hyperuricemia or gout compared with healthy adult controls [30]. The same study found increased blood levels of Ala, Val, Ile, and Orn in adult patients with asymptomatic hyperuricemia, but these amino acids were not correlated with UA in our study. It seems that Gly and Ser are related to the metabolic process of increasing blood UA level [31]. Although Ser has no known relevant link with UA synthesis, Gly is needed for the de novo synthesis of purine [32], which is the biosynthetic precursor of UA. More Gly may be consumed for the biosynthesis of purine in children with obesity under hyperinsulinemia.
This study has a number of notable limitations. Principally, our sample size was relatively small, in particular with regard to comparisons between children with and without impaired glucose tolerance. This limited the statistical power to draw firm conclusions. Finally, we did not evaluate the impact of dietary and lifestyle factors, or genetic factors including family history of obesity on amino acid patterns.
In recent years, early childhood obesity prevention is required because the prevalence of overweightness and obesity in children aged 5 years and below has been increasing worldwide [33]. In Japan, examinations of physical and mental development were performed on young children at 1.5 and 3 years of age. Geserick et al. reported that most children who were obese between 2 and 6 years of age were obese in adolescence [34]. In the future, we need to perform screening and intervention for obesity at the ages of 3 and 6, prior to their entry into kindergarten and primary school, respectively. This should involve assessment of their metabolic state. It would also be desirable to study junior high school students with obesity. Analysis of metabolic profiles including amino acids in obese children and adolescents from different age groups may reveal additional problems and remedies relevant to childhood obesity.
Conclusions
Our data support the potential of amino acid profiles as a useful marker for early intervention in childhood obesity. Importantly, these profiles reflect impaired glucose tolerance and hyperuricemia at an early obese stage. Moreover, a state of unbalanced or increased amino acids associated with obesity, such as BCAA in the blood, may exacerbate obesity and insulin sensitivity. Therefore, our results also support the view that a diet with good nutritional balance and exercise therapy that normalizes the balance of blood amino acids is important in the treatment of obesity.
Additional file
Table S1. (A) Blood test values in children with and without dyslipidemia. Values are given as mean ± SD; *P < 0.05; **P < 0.01. (B) Blood amino acids values in children with and without dyslipidemia. amino acid concentrations: nmol/mL. Values are given as mean ± SD; *P < 0.05; **P < 0.01. Table S2. Relationship between LDL/HDL ratio and IMT in children with obesity. (A) LDL/HDL vs right side IMT; N = 26; y = 6.3399x – 1.0341; R2 = 0.3125; P = 0.003. (B) LDL/HDL vs left side IMT; N = 26; y = 1.9197x + 1.334; R2 = 0.0312; P = 0.388. (C) LDL/HDL vs mean IMT; N = 26; y = 6.0181x – 0.8849; R2 = 0.1972; P = 0.023. Table S3. (A) Amino acid profiles in obese children with decreased HOMA-IR and BMI after intervention. Valine, leucine, isoleucine, alanine, and tyrosine tended to decrease, and glycine tended to increase with decreased HOMA-IR and BMI after intervention (N = 7). (B) Amino acid profiles in obese children with increased HOMA-IR and decreased BMI after intervention. Valine, leucine, isoleucine, phenylalanine, tryptophan, methionine, lysine, glycine, alanine, and tyrosine increased with increased HOMA-IR and decreased BMI after intervention (N = 14). (PPTX 88 kb)
Acknowledgements
We thank all the staff at our institution who cooperated to collect the patients’ samples, as well as those at the Department of Central Clinical Laboratory, Kumamoto University Hospital, who performed the laboratory examinations and cervical ultrasonography.
Abbreviations
- AA
Amino acid
- Ala
Alanine
- ALT
Alanine aminotransferase
- Arg
Arginine
- Asn
Asparagine
- Asp
Aspartate
- AST
Aspartate aminotransferase
- BCAA
Branched chain amino acids
- Cit
Citrulline
- DM
Diabetes mellitus
- EAA
Essential amino acids
- Glu
Glutamate
- Gly
Glycine
- HDL-CHO
High-density lipoprotein cholesterol
- HOMA – IR
Homeostasis model assessment-insulin resistance
- Ile
Isoleucine
- IMT
Intima media thickness
- LDH
Lactate dehydrogenase
- LDL-CHO
Low-density lipoprotein cholesterol
- Leu
Leucine
- Met
Methionine
- Orn
Ornithine
- Phe
Phenylalanine
- Pro
Proline
- Ser
Serine
- T-CHO
Total cholesterol
- TFAA
Total free amino acids
- TG
Triglyceride
- Trp
Tryptophan
- Tyr
Tyrosine
- γ-GTP
γ-glutamyltransferase
- UA
Uric Acid
- Val
Valine
Authors’ contributions
YS, JK, SM, and KN were responsible for the design of the research. SM and KS contributed to measurements and data collection. YS and JK checked and analyzed data. JK and SM wrote the manuscript. All authors read and approved the final manuscript.
Funding
This study was in part funded by a grant-in-aid for JSPS KAKENHI [Grant Number JP15K09625] and a grant-in-aid for The International Council on Amino Acid Science Japan Research Funding. The funding body funded the collection and analysis of data in this research and writing the manuscript.
Availability of data and materials
The datasets used and/or analysed during the current study are available from the corresponding author on reasonable request.
Ethics approval and consent to participate
This study was approved by the Ethics Committee of the Graduate School of Medical Sciences, Kumamoto University. Informed consent was obtained from all the children included in this study and/or their parent.
Consent for publication
Not applicable.
Competing interests
The authors declare that they have no competing interests.
Footnotes
Publisher’s Note
Springer Nature remains neutral with regard to jurisdictional claims in published maps and institutional affiliations.
References
- 1.World Health Organisation . Report of the commission on ending childhood obesity. Geneva: WHO; 2016. [Google Scholar]
- 2.Singh AS, Mulder C, Twisk JW, van Mechelen W, Chinapaw MJ. Tracking of childhood overweight into adulthood: a systematic review of the literature. Obes Rev. 2008;9:474–488. doi: 10.1111/j.1467-789X.2008.00475.x. [DOI] [PubMed] [Google Scholar]
- 3.Sonntag D, Ali S, Lehnert T, Konnopka A, Riedel-Heller S, König HH. Estimating the lifetime cost of childhood obesity in Germany: results of a Markov model. Pediatr Obes. 2015;10:416–422. doi: 10.1111/ijpo.278. [DOI] [PubMed] [Google Scholar]
- 4.Sonntag D, Ali S, De Bock F. Lifetime indirect cost of childhood overweight and obesity: a decision analytic model. Obesity (Silver Spring) 2016;24:200–206. doi: 10.1002/oby.21323. [DOI] [PubMed] [Google Scholar]
- 5.Mochida T, Tanaka T, Shiraki Y, Tajiri H, Matsumoto S, Shimbo K, Ando T, Nakamura K, Okamoto M, Endo F. Time-dependent changes in the plasma amino acid concentration in diabetes mellitus. Mol Genet Metab. 2011;103:406–409. doi: 10.1016/j.ymgme.2011.05.002. [DOI] [PubMed] [Google Scholar]
- 6.Wang TJ, Larson MG, Vasan RS, Cheng S, Rhee EP, McCabe E, Lewis GD, Fox CS, Jacques PF, Fernandez C, O’Donnell CJ, Carr SA, Mootha VK, Florez JC, Souza A, Melander O, Clish CB, Gerszten RE. Metabolite profiles and the risk of developing diabetes. Nat Med. 2011;17:448–453. doi: 10.1038/nm.2307. [DOI] [PMC free article] [PubMed] [Google Scholar]
- 7.Newgard CB, An J, Bain JR, Muehlbauer MJ, Stevens RD, Lien LF, Haqq AM, Shah SH, Arlotto M, Slentz CA, Rochon J, Gallup D, Ilkayeva O, Wenner BR, Yancy WS, Jr, Eisenson H, Musante G, Surwit RS, Millington DS, Butler MD, Svetkey LP. A branched-chain amino acid-related metabolic signature that differentiates obese and lean humans and contributes to insulin resistance. Cell Metab. 2009;9:11–326. doi: 10.1016/j.cmet.2009.02.002. [DOI] [PMC free article] [PubMed] [Google Scholar]
- 8.Schwenk WF, Haymond MW. Decreased uptake of glucose by human forearm during infusion of leucine, isoleucine, or threonine. Diabetes. 1987;36:199–204. doi: 10.2337/diab.36.2.199. [DOI] [PubMed] [Google Scholar]
- 9.Takashina C, Tsujino I, Watanabe T, Sakaue S, Ikeda D, Yamada A, Sato T, Ohira H, Otsuka Y, Oyama-Manabe N, Ito YM, Nishimura M. Associations among the plasma amino acid profile, obesity, and glucose metabolism in Japanese adults with normal glucose tolerance. Nutr Metab. 2016;13(5). 10.1186/s12986-015-0059-5 PMID: 26788116. [DOI] [PMC free article] [PubMed]
- 10.Nagai N, Takekawa A. Assessment of the weight change in the improvement class for obese children. Jpn J Nutr. 1999;57:211–220. doi: 10.5264/eiyogakuzashi.57.211. [DOI] [Google Scholar]
- 11.Oren A, Vos LE, Uiterwaal CS, Grobbee DE, Bots ML. Cardiovascular risk factors and increased carotid intima-media thickness in healthy young adults: the atherosclerosis risk in young adults (ARYA) study. Arch Intern Med. 2003;163:1787–1792. doi: 10.1001/archinte.163.15.1787. [DOI] [PubMed] [Google Scholar]
- 12.Lo J, Dolan SE, Kanter JR, Hemphill LC, Connelly JM, Lees RS, Grinspoon SK. Effects of obesity, body composition, and adiponectin on carotid intima-media thickness in healthy women. J Clin Endocrinol Metab. 2006;91:1677–1682. doi: 10.1210/jc.2005-2775. [DOI] [PMC free article] [PubMed] [Google Scholar]
- 13.Iannuzzi A, Licenziati MR, Acampora C, Salvatore V, Auriemma L, Romano ML, Panico S, Rubba P, Trevisan M. Increased carotid intima-media thickness and stiffness in obese children. Diabetes Care. 2004;27:2506–2508. doi: 10.2337/diacare.27.10.2506. [DOI] [PubMed] [Google Scholar]
- 14.Reinehr T, Kiess W, de Sousa G, Stoffel-Wagner B, Wunsch R. Intima media thickness in childhood obesity: relations to inflammatory marker, glucose metabolism, and blood pressure. Metabolism. 2006;55:113–118. doi: 10.1016/j.metabol.2005.07.016. [DOI] [PubMed] [Google Scholar]
- 15.Freedman DS, Dietz WH, Tang R, Mensah GA, Bond MG, Urbina EM, Srinivasan S, Berenson GS. The relation of obesity throughout life to carotid intima-media thickness in adulthood: the Bogalusa heart study. Int J Obes Relat Metab Disord. 2004;28:159–166. doi: 10.1038/sj.ijo.0802515. [DOI] [PubMed] [Google Scholar]
- 16.Raitakari OT, Juonala M, Kähönen M, Taittonen L, Laitinen T, Mäki-Torkko N, Järvisalo MJ, Uhari M, Jokinen E, Rönnemaa T, Akerblom HK, Viikari JS. Cardiovascular risk factors in childhood and carotid artery intima-media thickness in adulthood: the cardiovascular risk in young Finns study. JAMA. 2003;290:2277–2283. doi: 10.1001/jama.290.17.2277. [DOI] [PubMed] [Google Scholar]
- 17.Freedman DS, Patel DA, Srinivasan SR, Chen W, Tang R, Bond MG, Berenson GS. The contribution of childhood obesity to adult carotid intima-media thickness: the Bogalusa heart study. Int J Obes. 2008;32:749–756. doi: 10.1038/sj.ijo.0803798. [DOI] [PubMed] [Google Scholar]
- 18.Tremblay F, Marette A. Amino acid and insulin signaling via the mTOR/p70 S6 kinase pathway. A negative feedback mechanism leading to insulin resistance in skeletal muscle cells. J Biol Chem. 2001;276:38052–38060. doi: 10.1074/jbc.M106703200. [DOI] [PubMed] [Google Scholar]
- 19.Calbet JA, MacLean DA. Plasma glucagon and insulin responses depend on the rate of appearance of amino acids after ingestion of different protein solutions in humans. J Nutr. 2002;132:2174–2182. doi: 10.1093/jn/132.8.2174. [DOI] [PubMed] [Google Scholar]
- 20.Kuhara T, Ikeda S, Ohneda A, Sasaki Y. Effects of intravenous infusion of 17 amino acids on the secretion of GH, glucagon, and insulin in sheep. Am J Phys. 1991;260:E21–E26. doi: 10.1152/ajpendo.1991.260.1.E21. [DOI] [PubMed] [Google Scholar]
- 21.Durga J, Verhoef P, Bots ML, Schouten E. Homocysteine and carotid intima-media thickness: a critical appraisal of the evidence. Atherosclerosis. 2004;176:1–19. doi: 10.1016/j.atherosclerosis.2003.11.022. [DOI] [PubMed] [Google Scholar]
- 22.Yang R, Dong J, Zhao H, Li H, Guo H, Wang S, Zhang C, Wang S, Wang M, Yu S, Chen W. Association of branched-chain amino acids with carotid intima-media thickness and coronary artery disease risk factors. PLoS One. 2014;9:e99598. doi: 10.1371/journal.pone.0099598. [DOI] [PMC free article] [PubMed] [Google Scholar]
- 23.Yamakado M, Nagao K, Imaizumi A, Tani M, Toda A, Tanaka T, Jinzu H, Miyano H, Yamamoto H, Daimon T, Horimoto K, Ishizaka Y. Plasma free amino acid profiles predict four-year risk of developing diabetes, metabolic syndrome, dyslipidemia, and hypertension in Japanese population. Sci Rep. 2015;5:11918. doi: 10.1038/srep11918. [DOI] [PMC free article] [PubMed] [Google Scholar]
- 24.Newgard CB. Interplay between lipids and branched-chain amino acids in development of insulin resistance. Cell Metab. 2012;15:606–614. doi: 10.1016/j.cmet.2012.01.024. [DOI] [PMC free article] [PubMed] [Google Scholar]
- 25.Mangge H, Zelzer S, Prüller F, Schnedl WJ, Weghuber D, Enko D, Bergsten P, Haybaeck J, Meinitzer A. Branched-chain amino acids are associated with cardiometabolic risk profiles found already in lean, overweight and obese young. J Nutr Biochem. 2016;32:123–127. doi: 10.1016/j.jnutbio.2016.02.007. [DOI] [PubMed] [Google Scholar]
- 26.Pozefsky T, Felig P, Tobin JD, Soeldner JS, Cahill GF., Jr Amino acid balance across tissues of the forearm in postabsorptive man. Effects of insulin at two dose levels. J Clin Invest. 1969;48:2273–2282. doi: 10.1172/JCI106193. [DOI] [PMC free article] [PubMed] [Google Scholar]
- 27.Würtz P, Tiainen M, Mäkinen VP, Kangas AJ, Soininen P, Saltevo J, Keinänen-Kiukaanniemi S, Mäntyselkä P, Lehtimäki T, Laakso M, Jula A, Kähönen M, Vanhala M, Ala-Korpela M. Circulating metabolite predictors of glycemia in middle-aged men and women. Diabetes Care. 2012;35:1749–1756. doi: 10.2337/dc11-1838. [DOI] [PMC free article] [PubMed] [Google Scholar]
- 28.Shimizu N, Maruyama T, Yoshikawa N, Matsumiya R, Ma Y, Ito N, Tasaka Y, Kuribara-Souta A, Miyata K, Oike Y, Berger S, Schütz G, Takeda S, Tanaka H. A muscle-liver-fat signalling axis is essential for central control of adaptive adipose remodelling. Nat Commun. 2015;6:6693. doi: 10.1038/ncomms7693. [DOI] [PMC free article] [PubMed] [Google Scholar]
- 29.Miao Z, Li C, Chen Y, Zhao S, Wang Y, Wang Z, Chen X, Xu F, Wang F, Sun R, Hu J, Song W, Yan S, Wang CY. Dietary and lifestyle changes associated with high prevalence of hyperuricemia and gout in the Shandong coastal cities of eastern China. J Rheumatol. 2008;35:1859–1864. [PubMed] [Google Scholar]
- 30.Luo Y, Wang L, Liu XY, Chen X, Song YX, Li XH, Jiang C, Peng A, Liu JY. Plasma profiling of amino acids distinguishes acute gout from asymptomatic hyperuricemia. Amino Acids. 2018;50:1539–1548. doi: 10.1007/s00726-018-2627-2. [DOI] [PubMed] [Google Scholar]
- 31.Mahbub MH, Yamaguchi N, Takahashi H, Hase R, Ishimaru Y, Sunagawa H, Amano H, Kobayashi-Miura M, Kanda H, Fujita Y, Yamamoto H, Yamamoto M, Kikuchi S, Ikeda A, Kageyama N, Nakamura M, Tanabe T. Association of plasma free amino acids with hyperuricemia in relation to diabetes mellitus, dyslipidemia, hypertension and metabolic syndrome. Sci Rep. 2017;7:17616. doi: 10.1038/s41598-017-17710-6. [DOI] [PMC free article] [PubMed] [Google Scholar]
- 32.Baggott JE, Gorman GS, Tamura T. 13C enrichment of carbons 2 and 8 of purine by folate-dependent reactions after [13C] formate and [2-13C] glycine dosing in adult humans. Metabolism. 2007;56:708–715. doi: 10.1016/j.metabol.2006.12.020. [DOI] [PMC free article] [PubMed] [Google Scholar]
- 33.Brown Vicki, Ananthapavan Jaithri, Sonntag Diana, Tan Eng Joo, Hayes Alison, Moodie Marj. The potential for long-term cost-effectiveness of obesity prevention interventions in the early years of life. Pediatric Obesity. 2019;14(8):e12517. doi: 10.1111/ijpo.12517. [DOI] [PubMed] [Google Scholar]
- 34.Geserick M, Vogel M, Gausche R, Lipek T, Spielau U, Keller E, Pfäffle R, Kiess W, Körner A. Acceleration of BMI in early childhood and risk of sustained obesity. N Engl J Med. 2018;379:1303–1312. doi: 10.1056/NEJMoa1803527. [DOI] [PubMed] [Google Scholar]
Associated Data
This section collects any data citations, data availability statements, or supplementary materials included in this article.
Supplementary Materials
Table S1. (A) Blood test values in children with and without dyslipidemia. Values are given as mean ± SD; *P < 0.05; **P < 0.01. (B) Blood amino acids values in children with and without dyslipidemia. amino acid concentrations: nmol/mL. Values are given as mean ± SD; *P < 0.05; **P < 0.01. Table S2. Relationship between LDL/HDL ratio and IMT in children with obesity. (A) LDL/HDL vs right side IMT; N = 26; y = 6.3399x – 1.0341; R2 = 0.3125; P = 0.003. (B) LDL/HDL vs left side IMT; N = 26; y = 1.9197x + 1.334; R2 = 0.0312; P = 0.388. (C) LDL/HDL vs mean IMT; N = 26; y = 6.0181x – 0.8849; R2 = 0.1972; P = 0.023. Table S3. (A) Amino acid profiles in obese children with decreased HOMA-IR and BMI after intervention. Valine, leucine, isoleucine, alanine, and tyrosine tended to decrease, and glycine tended to increase with decreased HOMA-IR and BMI after intervention (N = 7). (B) Amino acid profiles in obese children with increased HOMA-IR and decreased BMI after intervention. Valine, leucine, isoleucine, phenylalanine, tryptophan, methionine, lysine, glycine, alanine, and tyrosine increased with increased HOMA-IR and decreased BMI after intervention (N = 14). (PPTX 88 kb)
Data Availability Statement
The datasets used and/or analysed during the current study are available from the corresponding author on reasonable request.


