Abstract
Background
Gastrointestinal symptoms can be triggered by food intake and psychological distress, but individual-level research on food–symptom and stress–symptom associations is scarce.
Objective
We aimed to identify associations between food intake, psychological distress and gastrointestinal symptoms, and their implications for personalised clinical management.
Methods
Through the mobile phone application mySymptoms, 163 users kept, for a median of five weeks, a diary of food intake, psychological distress and gastrointestinal symptoms. We quantified associations between these on the individual level. The presence of individual-level associations was compared over latent classes of daily symptom patterns.
Results
Various gastrointestinal symptoms had demonstrable food–symptom associations (heartburn: 73%, discomfort: 67%, diarrhoea: 57%, bloating: 53%, and gas: 48%). Food–symptom associations for pain in the abdomen (33%) were concentrated in the latent class of individuals with pain in the morning (68%), rather than those with pain in the evening and night (27% and 10%, respectively, p < 0.001). Stress–symptom relations were also found, although only 18% of individuals reported psychological distress.
Conclusion
Personal food–symptom and stress–symptom relations can be detected, and may translate into specific daily symptom patterns. A next step will be to let personal food–symptom and stress–symptom relations serve as the basis for personalised clinical management.
Keywords: Nutrition, gastroenterology, irritable bowel syndrome, psychological distress, abdominal pain, diet, functional gastrointestinal disorders, FGID, diary
Key summary
Current knowledge:
Gastrointestinal symptoms can be triggered by specific food products.
Psychological distress may also trigger gastrointestinal symptoms.
Individual-level food–symptom and stress–symptom associations are not routinely quantified.
Key findings:
Food–symptom and stress–symptom relations were identified in a majority of individuals.
Food–symptom relations may translate into specific daily symptom patterns.
Introduction
Most of us are familiar with them: gastrointestinal symptoms such as abdominal pain, discomfort, bloating, gas, diarrhoea, nausea and belching. Gastrointestinal symptoms are bothersome, often recurrent and can impair quality of life.1 The prevalence of gastrointestinal symptoms is high, with a population-based study suggesting 62% for at least one gastrointestinal symptom2 and 35% for at least one functional gastrointestinal disorder (FGID)3 according to the Rome IV criteria.4 The pathophysiology of FGIDs is complex and heterogeneous, so that existing pharmacological, psychological and dietary management strategies often have limited success.5
One way to study the heterogeneous pathophysiology of gastrointestinal symptoms is through symptom patterns. If the human body is a black box, symptom patterns are its direct output, and can thus teach us about processes inside. A good example is food intake: symptom patterns often correspond to the intake of specific food products.6,7 Food–symptom associations can be objectively identified within an individual. The details of the association (which food group, what delay to symptom onset) give person-specific insights into the mechanism, and thus provide a tool for symptom improvement. Another example is time of day: an individual’s gastrointestinal symptoms often follow a consistent circadian pattern,8 which may reflect processes directly or indirectly regulated by the circadian clock.9,10 Studying symptom patterns also addresses patient heterogeneity by identifying relevant patient subgroups, which may help to personalise clinical management of gastrointestinal symptoms.
Currently, however, symptom patterns are not used at their full potential in symptom management. Although the current Rome IV classification of functional gastrointestinal disorders is symptom-based and distinguishes around 30 functional gastrointestinal disorders,4 it has been noted that these show overlap and fluidity over time, and that treatment responses are heterogeneous.11 Moreover, fine-grained factors such as diet and psychological distress are missing despite their demonstrated importance,6,12 as are longitudinal features of symptom patterns such as fluctuations with time of day.13 In conclusion, there is a need for more detailed studies that use gastrointestinal symptom patterns as the basis for personalised management strategies, and that identify patient subgroups that predict treatment response.
We therefore studied longitudinal patterns of various gastrointestinal symptoms by using food/symptom diaries. Specifically, we analysed temporal relations between gastrointestinal symptoms, as well as food–symptom and stress–symptom relations. We further tested whether the presence of a food–symptom or stress–symptom association could be predicted by the symptom pattern during the day.
Methods
This study used anonymous diaries of food intake, psychological distress and gastrointestinal symptoms, as kept on the mobile phone application mySymptoms (SkyGazer Labs Ltd, courtesy of CEO Darren Launders).14 Users of mySymptoms were invited from within the application to opt in and retrospectively share their anonymous diaries for the present study. With the invitation came a study description, which told about the purpose of the study and data handling. Since data was anonymous (i.e. not encoded), the ethics committee of KU Leuven saw no need for ethics assessment.
Keeping a diary on mySymptoms works as follows. Users enter their food intake and symptoms whenever they deem this necessary (i.e. without instructions). Foods and their quantities are reported as free text input, although suggestions are given by autocomplete whilst typing. Reporting food quantities is optional. Symptoms and psychological distress can be selected from a list, although free text input is also possible. Symptom severity is always on a scale from 1 to 10. Time stamps default to the current time, rounded to the minute, but can also be user-specified.
Diary data pre-processing
Data was handled per diary using R version 3.5.1.15 First, food quantities were homogenised. For each unique item, we standardised the median quantities of weight units, volume units and other units to 1, with the maximum capped at 10 to reduce the influence of incorrect values. Second, data was restructured from free text to predefined categories, using a multilingual in-house developed text recognition library. It recognised strings in full (e.g. ‘[macaroni]’), parts of strings (e.g. ‘[macaroni] with [tomato sauce] and [cheese]’) and multi-category foods (e.g. ‘[Caesar salad]’). Strings of at least seven characters were allowed misspellings at a Damerau–Levenshtein distance16 of 1 in the R package stringdist.17 Third, to ensure both analytic feasibility and interpretability, we pooled categories from specific (e.g. sunflower seeds, 86 food categories) to intermediate (e.g. seeds, 28 food categories) or broad (e.g. nuts and seeds, 14 food categories), until there were at least five occurrences of that category. The same procedure applied to symptoms. We added two further variables. Consumption frequency was the running sum of caloric food consumption occurrences in the past 24 h. Night-time consumption was computed from caloric food intake, where intakes between 01:00 h and 04:00 h were scored a 2, those between 22:00 h and 01:00 h were scored a 1, and others a 0. Geographic origin was estimated using the R-package gtrendsR,18 where all free text strings were scored by country-level Google search frequencies, and the country with the largest score was taken. Finally, as quality control, days with fewer than two food reports were interpreted as missing data, and we excluded diaries with fewer than five symptom occurrences as any further analyses would lack reliability (this was the case for 11 out of the original 174 diaries).
Temporal relations between gastrointestinal symptoms
We computed within-person correlations between all reported symptoms. Briefly, symptom severity was summed for each day’s morning (04:00 h–12:00 h), afternoon (12:00 h–18:00 h) and evening/night (18:00 h–04:00 h). The resolution of three values per day was arbitrarily chosen to best capture lagged associations. Correlations were computed and pooled meta-analytically using the R-package metacor19 (DerSimonian–Laird approach) and visualised in a network using the R-packages qgraph20 and plotrix.21
Symptom patterns during the day
We did a latent class analysis on symptom patterns during the day. Briefly, per symptom per diary, symptom severity was summed by the hour. A personal min–max normalised mean curve was created (i.e. one curve per symptom per person). Subsequently, for each between-person dyad of curves for a given symptom, we obtained a similarity metric through an optimisation algorithm: we maximised the correlation between the curves by giving every hourly value a one-time opportunity to (partially) shift up to 2 h ahead or backwards. The individual with the most correlations larger than 0.5 was identified, and all individuals correlating with this person at r > 0.5 formed a latent class. This process was repeated until exhaustion of the list of unclassified individuals.
Food–symptom and stress–symptom relations
We investigated associations between food variables and symptoms, as well as psychological distress and symptoms. For every intake of every food category of every diary, we multiplied the quantity by the symptom severity in the next 8 h minus the previous 8 h (the latter prevents three biases: reverse causation, changes in reporting style, and long-term developments such as lifestyle changes and regression-to-the-mean) and the sum was taken. This process was repeated at 10.000 iterations, where intake instances were randomly repositioned between days, but not within days, thereby adjusting for circadian patterns and sleep times. From the resulting null-distribution we computed p-values (also for psychological distress). The geometric mean of the top-three food products was recomputed at 1.000 iterations, where, this time, symptoms were randomly repositioned between days and a single food–symptom association p-value was obtained. Subsequently, the population-level number of p-values above 0.5 was subtracted from that below 0.5 and expressed as a percentage with 95% confidence using the Pearson–Klopper method of the R-package binom.22 The resulting percentages at the group level were compared across the latent classes of symptom patterns during the day using Fisher’s exact test.
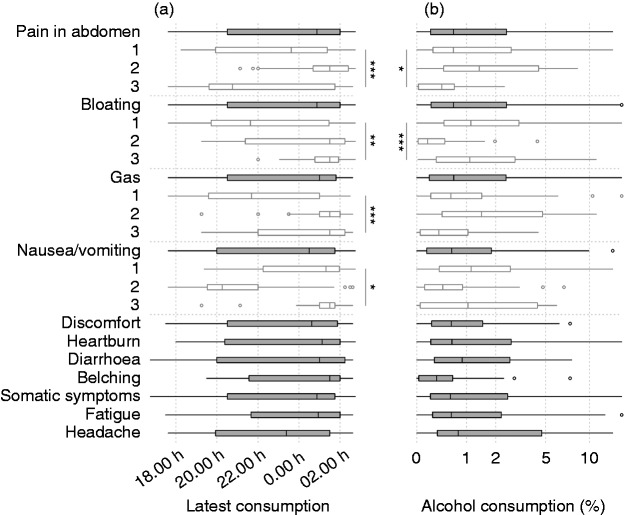
Finally, we explored other diet habits over the latent classes of symptom patterns during the day. This was done for the median time of latest caloric food consumption of the day (midnight until 04:00 h was considered part of the previous day), the percentage of all caloric food consumptions that were alcoholic beverages, the principal dietary components, the usage of probiotics and the avoidance of gluten or lactose as extracted from free-text strings (e.g. containing ‘gluten-free’ or ‘without gluten’). Statistical comparisons were done with Kruskal–Wallis tests.
Results
We received 163 diaries. Most were fully in English (138, 85%) and originated from North America, Europe or Oceania (158, 97%). The median diary length was 36 days (interquartile range 24–84 days). Reported symptoms (with number of individuals in parentheses) were: pain in abdomen (n = 110), gas (n = 91), bloating (n = 86), nausea/vomiting (n = 51), fatigue (n = 41), psychological distress (n = 30), headache (n = 30), heartburn (n = 30), diarrhoea (n = 27), discomfort (n = 18), belching (n = 15) and various somatic symptoms (n = 102).
Temporal relations between gastrointestinal symptoms
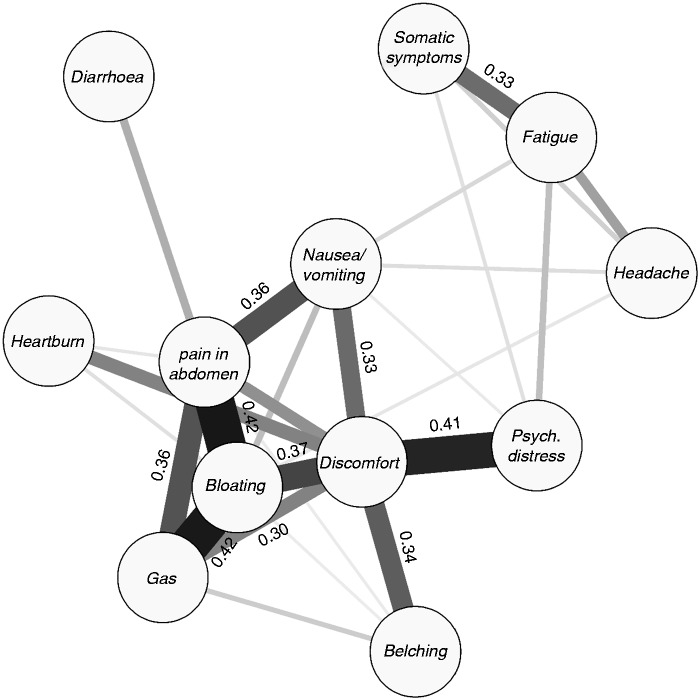
Within-person correlations were strongest between pain in the abdomen, bloating, and gas (r ≥ 0.36; Figure 1). Discomfort in the abdomen was related to this triad, as well as to belching, nausea/vomiting, heartburn, and, uniquely, to psychological distress (r = 0.41). All discussed correlations and most others differed from 0 with statistical significance at p < 0.001 (for a full correlation matrix, see the Supplementary Material online).
Figure 1.
Network of within-person correlations between symptoms. Thickness and colour of lines are proportional to the correlation values, which are displayed in the case r > 0.30.
Psych.: psychological.
Symptom patterns during the day
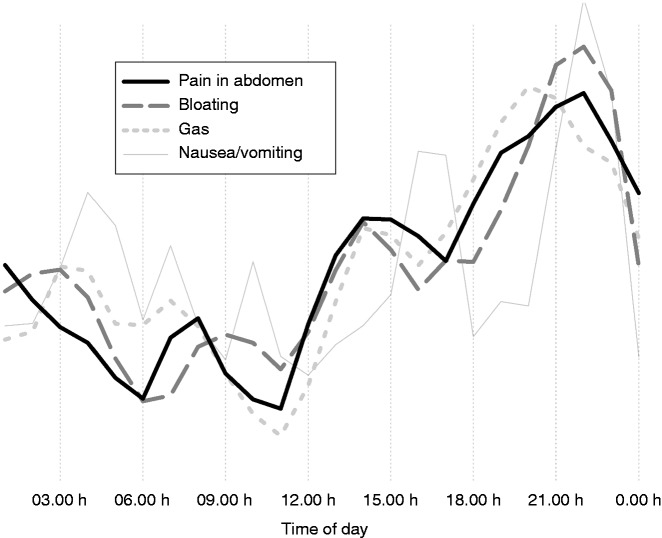
Pain in the abdomen, bloating and gas had a highly similar average symptom pattern during the day. These symptoms were generally mild in the morning (e.g. up to 11:00 h), then worsening until night-time, with particular presence in the evening (Figure 2).
Figure 2.
Symptom pattern during the day: curve of the averages.
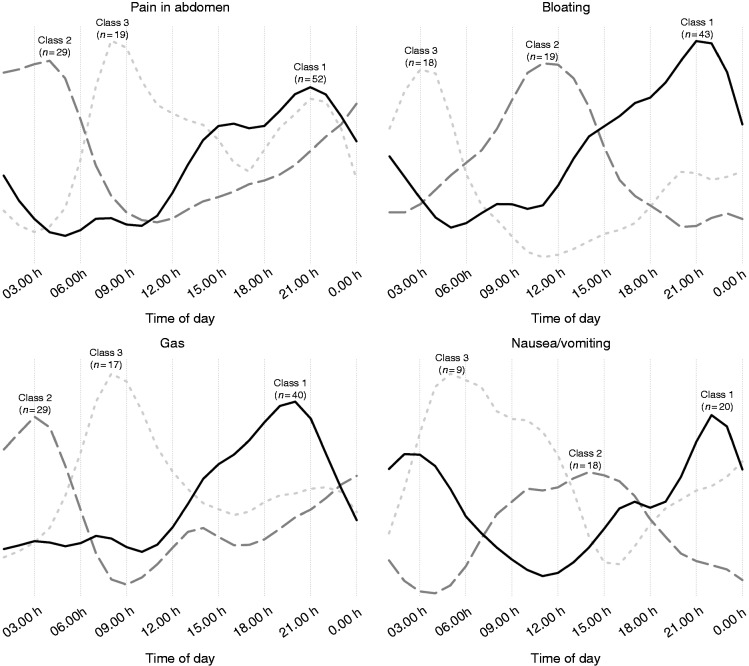
However, there was inter-individual variability in the symptom pattern during the day (Figure 3). Roughly half of individuals with pain in the abdomen, bloating and gas followed the average pattern, that is, increasing throughout the day. Another one-fourth to one-third of individuals had night-time symptoms, typically present around 03:00 h to 04:00 h. Finally, there was a class of individuals with symptoms in the morning, around 09:00 h to 10:00 h. The classification for nausea/vomiting was different, with symptoms occurring in the evening/night (∼40%), afternoon (∼40%) or night/morning (∼20%). Latent class analyses for other symptoms were not performed as there were too few individuals.
Figure 3.
Latent classes of symptom pattern during the day: curves of class averages.
Food–symptom and stress–symptom relations
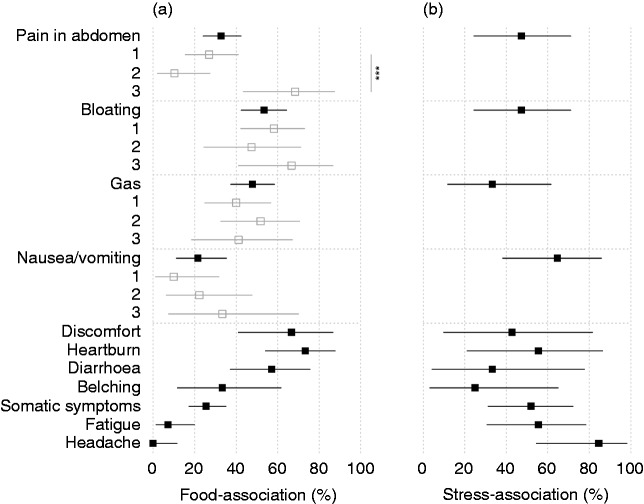
Associations between food variables and symptoms were demonstrably present in many individuals (Figure 4(a)), in particular for heartburn (73%), discomfort (67%), diarrhoea (57%), bloating (53%) and gas (48%). Food–symptom associations were less prevalent for pain in the abdomen (33%), but were concentrated in the latent class of individuals with pain in the morning, that is, class 3 (68%), rather than the classes of individuals with pain in the evening and night (27% and 10%, respectively, p < 0.001). Extra-intestinal symptoms such as headache and fatigue were not demonstrably triggered by food.
Figure 4.
Percentage of individuals with a demonstrable association between food intake and symptoms (a) and between psychological distress and symptoms (b). Also shown for the latent classes of symptom patterns during the day (grey) wherever statistical power allows it. Whiskers are 95% confidence intervals. ***p < 0.001.
Associations between psychological distress and symptoms were demonstrably present for all symptoms, although only 18% of individuals actually reported psychological distress. Stress–symptom relations emerged especially for symptoms where food–symptom relations were absent (headache: 85%, fatigue: 56%, nausea/vomiting: 65%; Figure 4(b)).
In this study population, the average individual still had a caloric food consumption after midnight on most days. Late caloric food consumptions were common amongst individuals with night-time symptoms, such as pain in the abdomen, bloating, gas and nausea/vomiting (classes 2, 3, 2 and 3, respectively), more so than individuals with daytime symptoms (p < 0.05; Figure 5(a)). The night-time symptom classes were further characterised by a higher intake of alcoholic beverages (which constituted > 1% of all reported caloric food consumptions; Figure 5(b)). We further observed trends of gluten-exclusion in individuals with pain in the abdomen, usage of probiotics in diarrhoea, and health-conscious diet profiles in belching (not shown). Symptoms did not differ between weekdays and weekend days.
Figure 5.
Median time of the latest caloric food consumption (a) and the percentage of all caloric consumptions that were alcoholic beverages ((b), log-2 scale). Also shown for the latent classes of symptom patterns during the day (open boxes). ***p < 0.001; **p < 0.01; *p < 0.05.
Discussion
This study analysed gastrointestinal symptom patterns and their relation to time of day, food intake and psychological distress, generating potential implications for personalised clinical management. We empirically show the existence of personal food–symptom, stress–symptom and symptom–symptom relations for various gastrointestinal symptoms. We further show that the presence of food–symptom relations may be associated with latent classes of specific daily symptom patterns (e.g. morning-predominant abdominal pain).
Symptom–symptom relations were strong, especially for pain in the abdomen, bloating, gas and discomfort. While the comorbidity of these gastrointestinal symptoms is well-described,23 we show here that these symptoms also tend to co-occur during the same part of the day. It is tempting to speculate about causal paths where gas causes abdominal distension or bloating24 and that this presents as painful sensation, although in some individuals pain could also be cramps associated with diarrhoea. Discomfort was the most central node in the network of within-person correlations, and was uniquely correlated with psychological distress, suggesting clinical relevance. However, the definition and significance of discomfort have been debated,25 as a result of which discomfort has been removed from the Rome criteria for irritable bowel syndrome.4,26 Since discomfort was not in the list of selectable symptoms on mySymptoms, we relied on free text input to define discomfort and included strings such as ‘gut discomfort’, ‘unpleasant feeling’, ‘nervous tummy’ and ‘upset stomach’. One could comment that, on the one hand, 11% of users apparently felt a sensation not covered by any of the selectable symptoms and took the trouble to explicitly add this symptom, suggesting that abdominal discomfort should be seen as a separate entity. On the other hand, discomfort was strongly related to six gastrointestinal symptoms, so that its meaning and underlying processes may differ between individuals.
There were three latent classes of daily symptom pattern for pain in the abdomen, bloating and gas. Evening symptoms formed the largest class (e.g. bloating: 54% of the studied population), which is in line with earlier studies,8,27 where 73% of irritable bowel syndrome patients self-reported a similar pattern for bloating. We found two more latent classes, however, for night-time and morning symptoms, respectively. The latent classes of daily symptom pattern may reflect different pathophysiological processes, FGIDs or even different symptoms,13 and, if so, could be used to guide personalised management. Indeed, the class of individuals with abdominal pain in the morning was characterised by demonstrable food–symptom relations, suggesting that dietary interventions to reduce abdominal pain have more potential in this class than in the classes of evening and night-time pain. Individuals with night-time pain often consumed food deep into the night, and normalising diet habits may be of help. It is conceivable that stress–symptom relations, too, differ across the latent classes, although the present study lacked power to test this, as only 18% of individuals reported psychological distress. The true prevalence of stress–symptom relations is therefore probably lower, as also suggested in one study, where 34% of irritable bowel syndrome patients self-reported that bloating was worse with psychological distress whereas 82% perceived a link with eating.27 An interesting notion is that symptoms with demonstrable food–symptom relations tended to have fewer stress–symptom relations and vice versa, so that psychological therapies may be successful in the case of failure of dietary interventions. Replication of our results in more extensively phenotyped (FGID) patient populations is warranted.
It will be exciting to take food–symptom and stress–symptom relations fully to the individual level, and let this be a data-driven basis for personalised clinical management. Specifically, diary platforms such as mySymptoms could aid in identifying potential food intolerances, for which diaries of ∼4 weeks apparently suffice, followed by controlled exclusion of the trigger foods. Another opportunity is to couple the symptom patterns found using a diary to results of an actual pharmacological, psychological or dietary intervention and/or to biomarkers in the same individuals. A comprehensive study would account for potentially relevant factors such as psychological distress, the use of medications and sleep. Standardised protocols and thorough phenotyping of participants are therefore important. The present study provides the basis for and takes a first step towards exploiting these opportunities.
Limitations of the present study include that the study population was anonymous and no diagnoses, age or sex are known. Irritable bowel syndrome will be common given that most reported recurrent abdominal pain and, given the functionality of mySymptoms, it is likely that food–symptom associations are more common than in most FGID populations. It is also possible that the prevalence of food–symptom and stress–symptom relations differs between cultures and countries, because of differences in factors such as eating habits, gut microbiota, genetics, availability of treatments and diagnostics of gastrointestinal disorders. For example, in populations with an increased incidence of gastrointestinal infections, infections can explain a share of the symptomatology, and thus fewer demonstrable food–symptom relations are expected. Large-scale international studies could shed light on this issue. We further could not account for medicine usage, sleep, the female menstrual cycle28 and the presence of gastrointestinal infection or inflammation. Moreover, mySymptoms uses the term ‘gas’ rather than ‘flatulence’ and consequently some users may not differentiate between flatulence, belching and abdominal distension (bloating was a separate choice option). Finally, there are residual biases such as misreporting and selection bias.
In conclusion, personal food–symptom and stress–symptom relations, as well as associations amongst different gastrointestinal symptoms, can be detected and may translate into specific daily symptom patterns. A next step will be to let personal food–symptom and stress–symptom relations serve as the basis for personalised clinical management.
Supplemental Material
Supplemental Material for Relations between food intake, psychological distress, and gastrointestinal symptoms: A diary study by Egbert Clevers, Hans Törnblom, Magnus Simrén, Jan Tack and Lukas Van Oudenhove in United European Gastroenterology Journal
Acknowledgements
The authors would like to thank Mr Darren Launders, CEO of SkyGazer Labs, for offering the application mySymptoms and inviting its users to share their data for the present study.
Declaration of conflicting interests
Raw data was kindly provided by SkyGazer Labs.
Funding
This research received no specific grant from any funding agency in the public, commercial, or not-for-profit sectors.
Informed consent
All participants opted in to retrospectively share their anonymous diaries for the present study.
Ethics approval
The ethics committee of KU Leuven was consulted, but saw no role for ethics assessment as data was fully anonymous.
References
- 1.Gralnek IM, Hays RD, Kilbourne A, et al. The impact of irritable bowel syndrome on health-related quality of life. Gastroenterology 2000; 119: 654–660. [DOI] [PubMed] [Google Scholar]
- 2.Clevers E, Whitehead WE, Palsson OS, et al. Factor analysis defines distinct upper and lower gastrointestinal symptom groups compatible with Rome IV criteria in a population-based study. Clin Gastroenterol Hepatol 2018; 16: 1252–1259.e5. [DOI] [PubMed] [Google Scholar]
- 3.Aziz I, Palsson OS, Törnblom H, et al. The prevalence and impact of overlapping Rome IV-diagnosed functional gastrointestinal disorders on somatization, quality of life, and healthcare utilization: A cross-sectional general population study in three countries. Am J Gastroenterol 2018; 113: 86–96. [DOI] [PubMed] [Google Scholar]
- 4.Drossman DA, Hasler WL. Rome IV-functional GI disorders: Disorders of gut–brain interaction. Gastroenterology 2016; 150: 1257–1261. [DOI] [PubMed] [Google Scholar]
- 5.Craig O. New therapies in irritable bowel syndrome: What works and when. Curr Opin Gastroenterol 2018; 34: 50–56. [DOI] [PubMed] [Google Scholar]
- 6.Böhn L, Störsrud S, Törnblom H, et al. Self-reported food-related gastrointestinal symptoms in IBS are common and associated with more severe symptoms and reduced quality of life. Am J Gastroenterol 2013; 108: 634–641. [DOI] [PubMed] [Google Scholar]
- 7.Simrén M, Månsson A, Langkilde AM, et al. Food-related gastrointestinal symptoms in the irritable bowel syndrome. Digestion 2001; 63: 108–115. [DOI] [PubMed] [Google Scholar]
- 8.Sullivan SN. A prospective study of unexplained visible abdominal bloating. N Z Med J 1994; 107: 428–430. [PubMed] [Google Scholar]
- 9.Asher G, Sassone-Corsi P. Time for food: The intimate interplay between nutrition, metabolism, and the circadian clock. Cell 2015; 161: 84–92. [DOI] [PubMed] [Google Scholar]
- 10.Rosselot AE, Hong CI, Moore SR. Rhythm and bugs: Circadian clocks, gut microbiota, and enteric infections. Curr Opin Gastroenterol 2016; 32: 7–11. [DOI] [PMC free article] [PubMed] [Google Scholar]
- 11.Holtmann GJ, Talley NJ. Inconsistent symptom clusters for functional gastrointestinal disorders in Asia: Is Rome burning? Gut 2018; 67: 1911–1915. [DOI] [PubMed] [Google Scholar]
- 12.Grinsvall C, Törnblom H, Tack J, et al. Psychological factors selectively upregulate rectal pain perception in hypersensitive patients with irritable bowel syndrome. Neurogastroenterol Motil 2015; 27: 1772–1782. [DOI] [PubMed] [Google Scholar]
- 13.Tanaka Y, Kanazawa M, Fukudo S, et al. Biopsychosocial model of irritable bowel syndrome. J Neurogastroenterol Motil 2011; 17: 131–139. [DOI] [PMC free article] [PubMed] [Google Scholar]
- 14.Application mySymptoms, 2010, https://skygazerlabs.com/wp/ (accessed 20 December 2018).
- 15.R Core Team. R: A language and environment for statistical computing. Vienna, Austria: R Foundation for Statistical Computing, https://www.R-project.org/ (2018, accessed 20 December 2018).
- 16.Damerau FJ. A technique for computer detection and correction of spelling errors. Commun ACM 1964; 7: 171–176. [Google Scholar]
- 17.Van der Loo M. The stringdist package for approximate string matching. R J 2014; 6: 111–122. [Google Scholar]
- 18.Massicotte P and Eddelbuettel D. gtrendsR: Perform and display Google trends queries. R package version 1.4.2., https://github.com/PMassicotte/gtrendsR (2018, accessed 20 December 2018.
- 19.Laliberté E. metacor: Meta-analysis of correlation coefficients. R package version 1.0-2, https://CRAN.R-project.org/package=metacor (2011, accessed 20 December 2018).
- 20.Epskamp S, Cramer AO, Waldorp LJ, et al. qgraph: Network visualizations of relationships in psychometric data. J Stat Softw 2012; 48: 1–18. [Google Scholar]
- 21.Lemon J. Plotrix: A package in the red light district of R. R-News 2006; 6: 8–12. [Google Scholar]
- 22.Dorai-Raj S. binom: Binomial confidence intervals for several parameterizations. R package version 1.1-1, https://CRAN.R-project.org/package=binom (2014, accessed 30 December 2018).
- 23.Lembo T, Naliboff B, Munakata J, et al. Symptoms and visceral perception in patients with pain-predominant irritable bowel syndrome. Am J Gastroenterol 1999; 94: 1320–1326. [DOI] [PubMed] [Google Scholar]
- 24.Serra J, Azpiroz F, Malagelada JR. Impaired transit and tolerance of intestinal gas in the irritable bowel syndrome. Gut 2001; 48: 14–19. [DOI] [PMC free article] [PubMed] [Google Scholar]
- 25.Spiegel BM, Bolus R, Agarwal N, et al. Measuring symptoms in the irritable bowel syndrome: Development of a framework for clinical trials. Aliment Pharmacol Ther 2010; 32: 1275–1291. [DOI] [PubMed] [Google Scholar]
- 26.Palsson OS, Whitehead WE, van Tilburg MAL, et al. Development and validation of the Rome IV diagnostic questionnaire for adults. Gastroenterology 2016; 150: 1481–1491. [Google Scholar]
- 27.Maxton DG, Martin DF, Whorwell PJ, et al. Abdominal distension in female patients with irritable bowel syndrome: Exploration of possible mechanisms. Gut 1991; 32: 662–664. [DOI] [PMC free article] [PubMed] [Google Scholar]
- 28.Chang L, Lee OY, Naliboff B, et al. Sensation of bloating and visible abdominal distension in patients with irritable bowel syndrome. Am J Gastroenterol 2001; 96: 3341–3347. [DOI] [PubMed] [Google Scholar]
Associated Data
This section collects any data citations, data availability statements, or supplementary materials included in this article.
Supplementary Materials
Supplemental Material for Relations between food intake, psychological distress, and gastrointestinal symptoms: A diary study by Egbert Clevers, Hans Törnblom, Magnus Simrén, Jan Tack and Lukas Van Oudenhove in United European Gastroenterology Journal


