Abstract
The vestibular system enables humans to estimate self-motion, stabilize gaze and maintain posture, but these behaviors are impacted by neural noise at all levels of processing (e.g., sensory, central, motor). Despite its essential importance, the behavioral impact of noise in human vestibular pathways is not completely understood. Here, we characterize the vestibular imprecision that results from neural noise by measuring trial-to-trial vestibulo-ocular reflex (VOR) variability and perceptual just-noticeable differences (JNDs) in the same human subjects as a function of stimulus intensity. We used head-centered yaw rotations about an Earth-vertical axis over a broad range of motion velocities (0°/s to 65°/s for VOR variability and 3°/s to 90°/s peak velocity for JNDs). We found that VOR variability increased from approximately 0.6°/s at a chair velocity of 1°/s to approximately 3°/s at 65°/s; it exhibited a stimulus-independent range below roughly 1°/s. Perceptual imprecision (“sigma”) increased from 0.76°/s at 3°/s to 4.7°/s at 90°/s. Using stimuli that manipulated the relationship between velocity, displacement and acceleration, we found that velocity was the salient cue for VOR variability for our motion stimuli. VOR and perceptual imprecision both increased with stimulus intensity and were broadly similar over a range of stimulus velocities, consistent with a common noise source that affects motor and perceptual pathways. This contrasts with differing perceptual and motor stimulus-dependent imprecision in visual studies. Either stimulus-dependent noise or non-linear signal processing could explain our results, but we argue that afferent non-linearities alone are unlikely to be the source of the observed behavioral stimulus-dependent imprecision.
Keywords: noise, vestibular, vestibulo-ocular reflex, just-noticeable difference
Graphical Abstract
Introduction
The vestibular organs, located in the inner ear, provide a sense of angular and linear motion that is critical for survival, yet imperfect because of neural noise (Faisal et al., 2008). A number of recent studies have investigated imprecision in vestibular behavior arising from this noise. Precision errors, such as trial-to-trial variation in responses, are distinct from accuracy errors, such as systematic (mean) undershooting in a sensorimotor response. Recent studies have shown that precision errors have important public health and scientific relevance. For example, perceptual motion thresholds (e.g., did I perceive a leftward or rightward motion?) in the dark (Benson et al., 1986, Gu et al., 2007, Grabherr et al., 2008, Butler et al., 2010, Roditi and Crane, 2012) are sensitive to disease (Lewis et al., 2011, Valko et al., 2012, Cousins et al., 2013), balance performance (Bermudez Rey et al., 2016, Karmali et al., 2017) and age (Bermudez Rey et al., 2016). Similarly, eye movement thresholds elicited in response to head motion (the vestibulo-ocular reflex; VOR) are affected by vestibular damage (Cousins et al., 2013). As well, a number of theoretical and experimental studies have revealed properties of neural processing by studying precision, including studies of multisensory integration (Landy et al., 1995, Ernst and Banks, 2002, Gu et al., 2008, Lim et al., 2017). Furthermore, models of dynamic, probabilistic vestibular sensory estimation, which have been successful AT predicting a range of behaviors, rely on statistics of sensory precision and experienced motion (Borah et al., 1988, Paulin et al., 1989, Laurens and Droulez, 2007, MacNeilage et al., 2008, Laurens and Angelaki, 2011, Karmali and Merfeld, 2012, Selva and Oman, 2012, Karmali et al., 2018). Thus, public health and scientific advancement may benefit from completely understanding the properties of vestibular imprecision and its impact on perception and action.
It is important to characterize vestibular imprecision over the broad range of motion amplitudes experienced during daily life (Gill et al., 2001).Vestibular perceptual imprecision has been characterized in this range using perceptual just-noticeable differences (JNDs), the ability to discriminate two motion intensities (which are sometimes called difference thresholds or differential thresholds). JNDs in the dark increase with increasing rotation velocity (Mallery et al., 2010, Nesti et al., 2015) and linear acceleration (Naseri and Grant, 2012). These JNDs are related to neural noise via signal detection theory (Green and Swets, 1966, Merfeld, 2011), and a realistic neuro-dynamical model showed that increasing JNDs with increasing stimulus intensity can arise from probabilistic decision-making using noisy signals (Deco and Rolls, 2006). Similarly, VOR imprecision was found to increase slightly with yaw rotation amplitude in non-human primates by measuring trial-to-trial variation in the VOR in responses to sinusoids with a peak velocity between 10°/s and 30°/s (Guo and Raymond, 2010).
Comparing perceptual and motor imprecision can elucidate sources of noise and differences in processing for perception and action. For example, a study of visual object size estimation found different stimulus-dependent errors for perception and motor responses (Ganel et al., 2008, Ganel et al., 2017). No study (to our knowledge) has compared VOR and perceptual imprecision during large, supra-threshold motions, nor characterized VOR imprecision in humans during large, supra-threshold motions. Furthermore, previous studies comparing perception and motor responses using threshold-level stimuli found seemingly conflicting results for vestibular (Seemungal et al., 2004, Haburcakova et al., 2012) and visual tracking behavior (Stone and Krauzlis, 2003, Osborne et al., 2005, Rasche and Gegenfurtner, 2009). We therefore characterize trial-to-trial VOR variability and perceptual JNDs in the same subjects using suprathreshold yaw rotation stimuli to address three questions.
First, how do VOR and perceptual imprecision change as a function of stimulus amplitude?
Second, what is the salient variable that determines the amount of imprecision? Based on perceptual JND results (Mallery et al., 2010, Nesti et al., 2015), we hypothesized that VOR variability depends primarily on velocity. We examined this question using motion stimuli that decoupled the relationship between displacement, velocity and acceleration.
Third, do these VOR and perceptual measures, that capture the noise characteristics of vestibular responses, closely resemble each other, which would imply that they share a principal, vestibular noise source? One approach to support this hypothesis is to test whether perceptual and VOR imprecision are similar across a range of conditions. Thus, we compared perceptual and VOR imprecision and found that they were similar across a range of stimulus velocities, consistent with a common noise source and common processing. We carefully considered potential experimental errors, including motion device variability, eye tracking variability and velocity storage.
Methods
Overview
Human subjects participated in seven sessions in which they experienced passive yaw rotations while upright. In three sessions, the VOR was measured in responses to motions with different peak velocities and frequencies (0°/s @ 1 Hz, ±20°/s @ 2 Hz, ±40°/s @ 1 Hz, ±40°/s @ 2 Hz, ±80°/s @ 1 Hz). In another four sessions, perceptual just-noticeable differences (JNDs) were measured in response to motions with different peak reference velocities (3, 5, 10, 20, 40, 60, 80, 90°/s @ 1 Hz, 3, 20, 40°/s @ 2 Hz). VOR responses were analyzed to determine VOR variability, the trial-to-trial differences in VOR responses to identical stimuli. Perceptual responses were analyzed to determine perceptual sigma, the parameter describing the noise underlying the measured JNDs. VOR variability as a function of chair velocity and JNDs as a function of reference velocity were then compared.
Subjects
Six healthy volunteers participated in the study (all female) with an average age of 30.2+/−6.3 years (mean+/−SD, range 22–41). Two additional subjects were excluded from the study before completion because eye movement recordings were not usable. A questionnaire was used to indicate any history of dizziness or vertigo, back/neck problems, cardiovascular, neurological, and other physical problems. All subjects had normal results on a vestibular diagnostic testing screen including Hallpike testing, electronystagmography, and sinusoidal vertical-axis angular VOR evoked via rotation. Informed consent was obtained and the study was approved by the Human Studies Committee (HSC) at the Massachusetts Eye and Ear Infirmary (MEEI) in accordance with the ethical standards laid down in the 1975 Declaration of Helsinki.
Conceptual framework
A multitude of imperfect processes (Faisal et al., 2008) add noise to neural systems, including: membrane excitability, ion channel opening and closing, sensory transduction and amplification, synaptic transmission, and muscles contraction. Signal detection theory (Green and Swets, 1966, Merfeld, 2011) relates perceptual errors characterized by threshold and JND measurements to the noise corrupting the underlying sensation, which is often described by the standard deviation of a Gaussian distribution. VOR trial-to-trial variability can be characterized using the standard deviation, as has been done to study other oculomotor behaviors (Osborne et al., 2005, Medina and Lisberger, 2007, Schoppik et al., 2008, Rasche and Gegenfurtner, 2009, Guo and Raymond, 2010). While noise arises from billions of sources that contaminate sensorimotor responses and perception, these noise sources can be combined for analysis into groups that approximate a normal distribution, according to the central limit theorem. Thus, both the perceptual and VOR measurements have a theoretical basis relating them to the standard deviation of the underlying noise, which allows imprecision to be compared across systems. While we assume a Gaussian noise distribution, we do not assume any particular frequency content (e.g., white noise).
Figure 1 outlines our conceptual framework. “Shared noise” includes noise sources that are common to motor and perceptual pathways, and can include hair cells, afferent neurons and early central processing. Papers describing noise sources in visual tracking suggest that shared noise is likely dominated by sensory noise sources (Stone and Krauzlis, 2003, Osborne et al., 2005, Medina and Lisberger, 2007, Schoppik et al., 2008, Rasche and Gegenfurtner, 2009). “Perceptual noise” and “motor noise” are added within the two independent streams, including sources such as central processing, motor neurons, and muscles. “Perceptual imprecision” is the measured error in perceptual responses, and is affected by perceptual and shared noise. Similarly, “motor imprecision” is affected by motor and shared noise. Our broad approach is to measure and compare perceptual and motor imprecision via responses to motion stimuli.
Figure 1:
Conceptual framework showing how shared, perceptual and motor noises result in perceptual and motor imprecision.
Motion device and motion stimuli
Subjects were seating upright in a chair on a low-vibration (Chaudhuri et al., 2013) motion device (Neurokinetics, Pittsburg, USA) in a light-tight, dark room. To minimize body movement relative to the chair, the subjects wore a five-point harness, and their head was held in place using a vacuum cushion (MT-VL-B15–002C, Civco, Iowa, USA). The vacuum cushion was held between two aluminum plates which could move to hold the head tightly. Subjects wore noise-canceling headphones which played white noise (approximately 60 dBA) during motion to prevent auditory cues about motion, and wore long sleeves and pants.
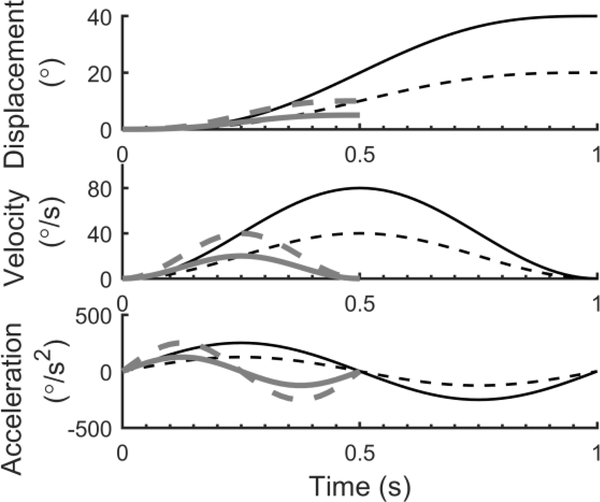
Motions trajectories were generated by custom software running on a Windows PC and then transmitted to a real-time computer (PK70, Netburner, San Diego, USA) which sent commands to the motion device. All motions were yaw rotations about an earth-vertical axis and trajectories (Figure 2) were single cycles of acceleration described by the equation a(t)= Asin(2πft)= Asin(2πt/T), where A is the angular acceleration amplitude, t is time and f is the frequency, which is defined as the inverse of the period (and duration) of the stimulation ( T =1/ f ). Given a starting velocity of zero, the corresponding velocity is v(t)= AT/(2π)[1=cos(2=t/T)] and displacement Δp(t)= AT/(2π)[t=T /(2π)sin(2πt/T)]. The peak displacement (Δptotal =AT2 /2π) and peak velocity (vmax=AT/π) vary in proportional to acceleration amplitude for a given period. In this study we used 1 Hz and 2 Hz motions, which lasted 1 s and 0.5 s, respectively. These motions were chosen because they have no discontinuities in acceleration, velocity or displacement, and because they mimic active head motion. Furthermore, displacement is monotonic and velocity is unidirectional, making perceptual interpretation simpler than with multiple sinusoidal cycles. Despite these motions being truncations of infinite sinusoids, the majority of their energy is near the intended stimulus frequency (Merfeld et al., 2016). Our software has compensation for the mechanical inertia of the device to ensure that actual motions are similar to intended motions across a range of frequencies (Karmali et al., 2014).
Figure 2:
Displacement, velocity and acceleration for the 4 motion conditions used. Each was a single sinusoidal cycle of acceleration, with the frequency and amplitude adjusted to change the relationship between displacement, velocity and acceleration. 1 Hz motions (black) lasted 1 s and had a peak velocity of 80°/s (solid black line) or 40°/s (dashed black line). 2 Hz motions (grey) lasted 0.5 s and had a peak velocity of 40°/s (dashed grey line) or 20°/s (solid grey line).
VOR measurements
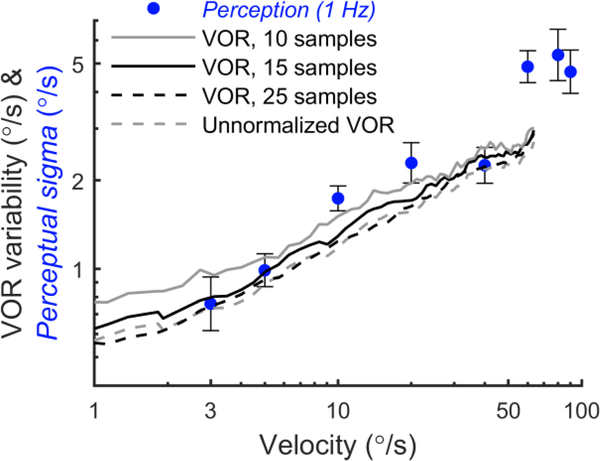
Eye movements were recorded from the right eye at 220 samples/second using an infrared head-mounted video-oculography system (EyeSeeCam, Interacoustics, Denmark). At the start of each trial, a small, dim, red LED positioned directly in front of their right eye appeared, and a short tone informed the subject that they should fixate the LED. After the subject acquired fixation, they pressed a button, which caused the LED to extinguish, leaving the subject in complete darkness. At the same time, the motion stimulus would commence. After the motion stimulus, the chair immediately returned to the starting position using an identical but opposite motion stimulus. The LED then turned on, and after a 2.5 s delay to eliminate any post-rotatory transients, the next trial began. Subjects were not moving for at least 3 s, and usually 4 to 6 s, since it took time to fixate the target and press the button. Horizontal eye velocity was determined by differentiating eye position and filtering using a smoothing filter with a window size of 15 samples. We confirmed that the results were not sensitive to changes in this window size from 10 to 25 samples (see Discussion).
Responses to 1 Hz motions were recorded during two sessions; trials with five different peak velocities were randomly interspersed: 0°/s, +40°/s, +80°/s, −40°/s and −80°/s. 0°/s trials were included to examine VOR responses when the LED extinguished but the chair did not move. Responses to 2 Hz motions were recorded during one subsequent session; trials with five different peak velocities were randomly interspersed: 0°/s, +20°/s, +40°/s, −20°/s, −40°/s. At the beginning of each session, subjects performed practice trials until they felt comfortable with the task, with a minimum of five trials in the light and five trials in the dark. During practice in the light, they were explicitly instructed to observe that the visual fixation target was attached to the wall, and did not move with the chair. To ensure that stimuli were not predictable, subjects did an equal number of leftward (+) and rightward (−) trials. Since all perceptual motions were leftward (for reasons described below), results only presents VOR responses for leftward chair motions to allow a more direct comparison. This design resulted in trials at 1 Hz and 2 Hz with the same peak velocity of 40°/s but different accelerations and displacements.
VOR analysis
While oculomotor variability can reflect the many neural systems that generate eye movements, we wished to focus as much as possible on variability arising from the vestibular system. Thus, as in previous work on VOR thresholds (Haburcakova et al., 2012) and VOR variability (Guo and Raymond, 2010), we excluded trials that exhibited blinks, characteristic saccades and/or fast phases. A trained operator, who was blind to the direction of the stimulus chair motion, interactively reviewed the eye movements using a Matlab script. Trials were not excluded if they had unusual eye movements that could not be characterized as blinks, saccades or fast phases. Thus, we included trials in which the ocular response exhibited drift or accelerations that were not present in the chair motion. Between 259 and 462 VOR trials were included for each subject, and the percentage of VOR trials excluded ranged from 14%−45%. Since a large number of trials had fast phases in the latter part of the motion, we chose to limit analysis for all 1 Hz conditions to the first 0.4 s and for all 2 Hz conditions to the first 0.2 s.
VOR variability was calculated by taking the standard deviation of the eye velocity across trials at each time. VOR variability was calculated separately for each condition (i.e., stimulus amplitude, direction and frequency). For example, VOR variability was calculated across trials for which the stimulus peak velocity was +40°/s and frequency was 1 Hz from a single subject. Because we hypothesized that VOR variability reflects early shared noise, we normalized VOR trials to remove the effect of VOR gain on the VOR variability measure. This was done by calculating the mean VOR gain for each subject at each frequency, then dividing each trial by this mean VOR gain, before taking the standard deviation across trials. VOR gain was determined by fitting eye velocity onto chair velocity, with both eye velocity and chair velocity averaged across all trials of a particular frequency. Chair velocity was determined by differentiating chair position, which was acquired at 600 Hz from a 15-bit absolute optical encoders (Yaskawa) coupled to the motor shaft.
VOR variability was determined across subjects by averaging VOR variability at each time for each condition. Although our small sample did not allow us to determine the distribution of VOR variability across subjects, since human vestibular recognition thresholds are lognormally distributed across subjects (Benson et al., 1986, Benson et al., 1989, Bermudez Rey et al., 2016), we chose to use a geometric mean when combining both VOR and perceptual results across subjects. Furthermore, consistent with previous work (Grabherr et al., 2008, Valko et al., 2012, Karmali et al., 2014), across-subjects statistics were calculated on log-transformed measures.
Principal component analysis (PCA) was used to study the temporal structure of VOR variability. PCA was applied separately for each subject and each frequency. For 1 Hz motions, +40°/s and +80°/s trials were pooled, after subtracting the mean VOR response for the corresponding peak velocity from each trial. For 2 Hz motions, +20°/s and +40°/s trials were pooled. The Matlab function “pca” was used to compute components, and “scores” that transform data between the response space and principal component space. Trials were reconstituted using the first component only by multiplying the component with the corresponding scores (score(:,1)*components(:,1)’). Trials were also reconstituted for all remain components (score(:,2:end)*components(:,2:end)’). We determined the variability attributed to the corresponding components by calculating the standard deviation across reconstituted trials. This was then combined across subjects using the geometric mean, as described above.
Information transmission (Shannon, 1948) in the VOR was determined by calculating mutual information, an information theoretic quantity that measures how much information a variable gives about another variable. Mutual information for each sample from the eye tracker was calculated between instantaneous horizontal eye velocity and head velocity using the equation (Borst and Theunissen, 1999). was determined by calculating the two-dimensional histogram across trials for one sample. and were determined using a one-dimensional histogram. Each histogram had 100 bins, and changing the number of bins did not substantially change the calculated mutual information. Mutual information was calculated separately from each condition using trials only from that condition. In addition, it was calculated using trials from all conditions together, after matching samples with corresponding velocities. Mutual information was calculated separately for each subject, and then averaged across subjects. Channel capacity was determined as the maximum mutual information across different head velocities.
Perceptual measurements
Perceptual measurements were made in eleven blocks spread out over four sessions. We measured JNDs (Mallery et al., 2010, Nesti et al., 2015) using a two-interval, two-alternative, forced-choice procedure (Treutwein, 1995, Leek, 2001). Each block used a different reference velocity (peak velocity of 3, 5, 10, 20, 40, 60, 80, 90°/s @ 1 Hz, 3, 20, 40°/s @ 2 Hz). The order of reference velocities was pseudo-randomized and perceptual and VOR sessions were interspersed. In each trial, one interval contained the reference motion, and the other interval contained a comparison motion which was adaptively selected. The order of the intervals was random, and the intervals were separated by 3 s to prevent transient effects of velocity storage and decision-making high-pass filters (Fernandez and Goldberg, 1971, Melvill Jones and Milsum, 1971, Raphan et al., 1977, Robinson, 1977, Merfeld et al., 2016). White noise played during the two motions, and a tone played between the intervals. The subjects were instructed to indicate which of the pair was perceived as faster, and to guess if unsure. Training was provided at each reference velocity. Since stimulus motions were unidirectional, the possible motion directions were leftward for both intervals, rightward for both intervals, or opposite directions for the two intervals. We chose to use leftward motions for all intervals, since this avoided possible effects of vestibular asymmetries. It would have been interesting to test all three, but this would have added six additional hours of testing per subject. 1 and 2 Hz motions were chosen because they allowed relatively rapid testing and avoided signal attenuation by peripheral (Fernandez and Goldberg, 1971, Melvill Jones and Milsum, 1971), velocity storage (Raphan et al., 1977, Robinson, 1977) and decision-making (Merfeld et al., 2016) high-pass filtering, although this prevented us from testing peak velocities over 90°/s without exceeding the acceleration limits of our device.
Adaptive staircases were used to select stimulus amplitude, which used the parameter estimation by sequential testing (PEST) algorithm (Taylor and Creelman, 1967, Karmali et al., 2016). 2-down, 1-up staircases were used (Leek, 2001), meaning that the peak velocity of the comparison interval became closer to the reference velocity when subjects responded correctly to two consecutive motions, and became further from the reference velocity every time subjects responded incorrectly. Two interleaved staircases were used, with one staircase starting 8°/s above the reference velocity and the other starting 8°/s below the reference velocity, with two exceptions: initial velocities were 1°/s and 5°/s for the 3°/s reference and 1°/s and 9°/s for the 5°/s reference. Subjects completed 80 trials in each block.
Perceptual data analysis
Perceptual responses were analyzed by fitting a Gaussian cumulative distribution psychometric curve, which was defined by two parameters: standard deviation (s) and mean (μ) (McCullagh and Nelder, 1989, Merfeld, 2011, Valko et al., 2012). Since subjects had to compare the reference and comparison intervals, they are effectively subtracting two random variables described by Gaussian probability distributions (with standard deviation sigma). Thus, the variance (s2) of the measured cumulative distribution function would be equal to the sum of the variances (s2=sigma2+sigma2) for each of the intervals (Merfeld, 2011). To allow VOR and perception to be compared directly, we present perceptual data as sigma=s/(21/2), since this characterizes neural noise in the same way that it would impact the VOR. For stimuli of sigma+μ, subjects should be on average correct 76% of the time (Merfeld, 2011). Stimulus amplitudes and responses were fit using a bias-reduced generalized linear model with a probit link function using the brglmfit.m function (Chaudhuri and Merfeld 2013) in Matlab 2014a (The Mathworks, MA, USA).
Motion device variability analysis
Since trial-to-trial variability in motion profiles could result in behavioral variability, we characterized the fidelity of our motion device. We used a published approach that computed total error, deterministic error and stochastic noise (Nesti et al., 2014). An inertial measurement unit (3-Space Data Logger, Yost Labs, Ohio, USA) was mounted on one of the head-restraint plates of the motion device. It recorded a number of measurements at 843 samples/sec, although we only analyzed angular velocity from the gyroscope. We commanded the device to execute 40 motions for each of the reference velocities used in the perceptual study. Stochastic noise included both trial-to-trial motion variability as well as instrumentation noise. Data collection started two minutes before motion commenced to allow sensors to stabilize (Nesti et al., 2014). As described in the Results, mean and root-mean-square measures were used to characterize motion device errors and variability.
Results
Vestibulo-ocular reflex variability
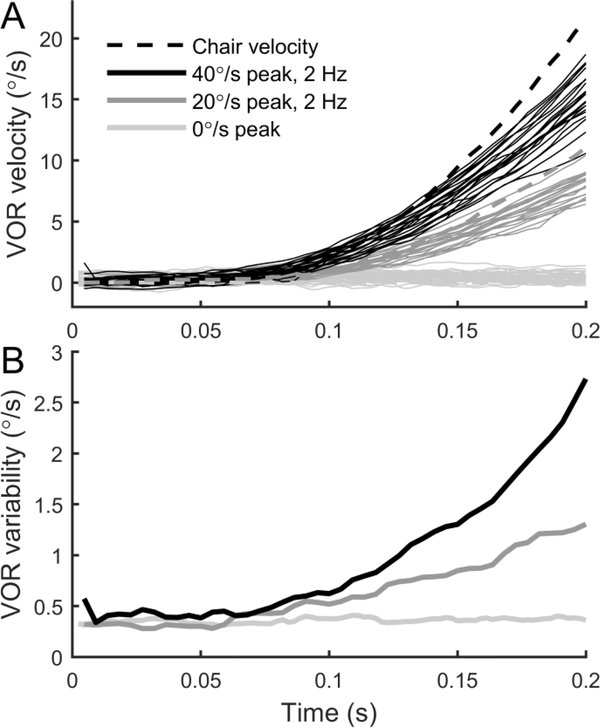
Figure 3A shows the response of the VOR to repeated stimuli in one subject. For example, the dark grey lines show the horizontal eye velocity in response to chair motion (dashed line, sign inverted) with a peak velocity of 40°/s. The trial-to-trial VOR variability became larger as the chair velocity increased. The trial-to-trial VOR variability was also greater for the motion with a peak velocity of 40°/s vs. 20°/s. Furthermore, the trial-to-trial VOR variability was smallest for the trials in which no motion occurred (0°/s), showing that elapsed time after the target extinguished was not the cause of VOR variability. These observations were quantified by determining VOR variability by calculating the standard deviation at each time, across trials with the same stimulus. Figure 3B shows the VOR variability for the subject and conditions shown in Figure 3A. In all conditions, VOR variability was initially approximately 0.4°/s, but VOR variability increased quickly for the 40°/s stimuli, and stayed relatively constant with time when no motion occurred (0°/s). These observations suggest that VOR variability is proportional to chair velocity.
Figure 3:
Horizontal VOR responses from one subject in response to repeated yaw rotation stimuli. A: Dashed lines show chair velocity for trials in which the peak velocity was either 40°/s, 20°/s or 0°/s. Grey lines show resultant VOR responses. Motions lasted 0.5 s but only the first 0.2 s were analyzed. B: VOR variability was computed by taking the standard deviation across VOR responses at each time, with VOR variability calculated separately for trials at each chair velocity. Trials were normalized by the mean VOR gain. VOR variability is higher when chair velocity is higher, and relatively constant over time when no motion occurs (0°/s).
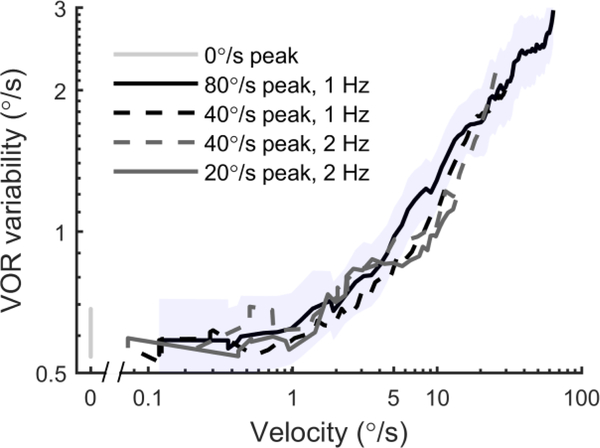
To characterize the relationship between VOR variability and head motion, we plotted the relationship between VOR variability and chair velocity (Figure 4). VOR variability was averaged across subjects for each stimulus using a geometric mean. For all stimuli, VOR variability was approximately 0.6°/s when chair velocity was below 1°/s, then increased with chair velocity. For example, for the 1 Hz motion with a peak velocity of 80°/s, VOR variability reached approximately 3°/s when chair velocity was 65°/s. For this stimulus-dependent range, the data were well fit by the equation (VOR variability)=0.51(chair velocity)0.41 and the coefficient was 0.41 log units of degrees per second VOR variability per log unit of degrees per second chair velocity. Variation across subjects is indicated by shading. The traces overlap for all four conditions, showing that velocity is the salient cue for VOR variability. We note that the relationship (Figure 2) between velocity, displacement, acceleration and time is different for each of our four conditions, and thus if VOR variability depended on displacement, acceleration or time elapsed, the curves should not overlap. For example, when comparing 1 Hz and 2 Hz motions with a peak velocity of 40°/s, at any velocity the displacement is twice as large for 1 Hz, and thus if VOR variability depended on displacement, VOR variability should be twice as large at each velocity for 1 Hz vs. 2 Hz. For the trials in which no motion occurred (light grey, 0°/s), VOR variability was similar to that present in the initial part of motion trials. In the Discussion, we describe possible physiologic reasons for the stimulus-independent range below 1°/s and the stimulus-dependent range above 1°/s.
Figure 4:
The dependency of VOR variability on chair velocity. Each line shows VOR variability averaged across 6 subjects using the geometric mean, plotted as a function of chair velocity. They show that VOR variability increased with chair velocity. Furthermore, the relationship between VOR variability and chair velocity was similar for four different conditions despite them having different displacements and accelerations. The shading shows the standard error across subjects for the 80°/s condition.
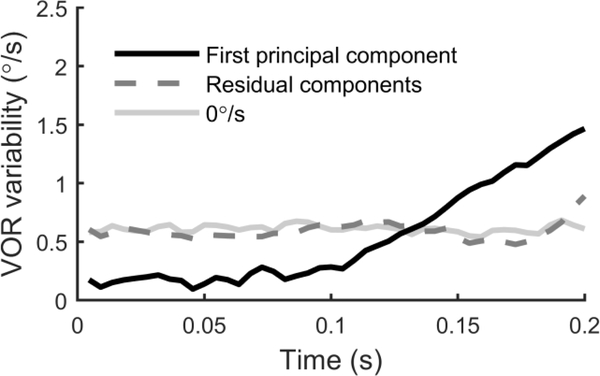
To further understand the structure of VOR variability, we used principal component analysis (PCA) to decompose VOR variability into constituent, orthogonal components. The first component accounted for 58% (mean across subjects, range 32–85%) of variability. Variability across trials reconstituted using only the first component (Figure 5, black line) closely resemble the chair velocity profile. Since the first component accounted for a majority of the variability, we also reconstituted trials using all remaining components (Figure 5, dashed line), which characterized the residual variability after removing the influence of the first component from each trial. The residual variability was very similar to the VOR variability present during no motion (0°/s) trials (Figure 5, grey line). Thus, a single principal component explained all the variation above that present without motion, further suggesting that it captured almost all variability related to motion.
Figure 5:
Decomposition of VOR variability using principal component analysis for 2 Hz motions. The black line shows the standard deviation across trials, where each trial was reconstituted from the first principal component. The dotted line shows the standard deviation across trials, where each trial was reconstituted from all principal components except for the first. For comparison, the grey line shows VOR variability for the no motion trials (0°/s).
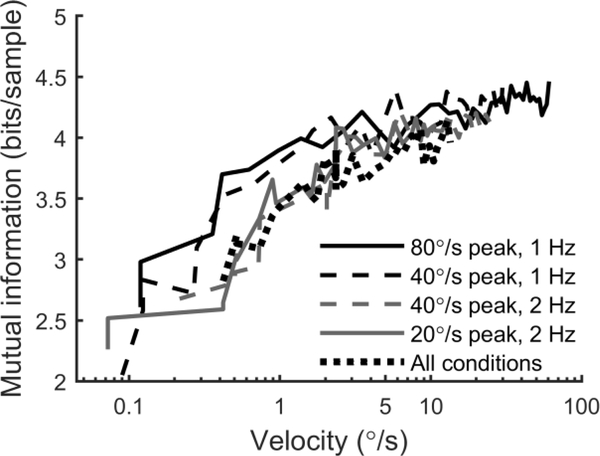
Information transmission (Shannon, 1948) in the VOR was quantified using information theoretic measures, as has previously been done for vestibular neurons (Sadeghi et al., 2007a). Figure 6 shows mutual information between chair velocity and eye velocity, which describes how much information one variable tells about the other. The curves for each of the conditions overlap when plotted as a function of instantaneous chair velocity, suggesting that information transmission is determined primarily by velocity. We also computed mutual information by pooling data from all four conditions, which also followed the same trend. Mutual information increased with chair velocity at low velocities, then reaches a plateau above roughly 5°/s of approximately 4.3 bits/sample.
Figure 6:
Mutual information between chair velocity and eye velocity as a function of instantaneous chair velocity. Curves show the geometric mean across subjects.
Comparison of perception and VOR
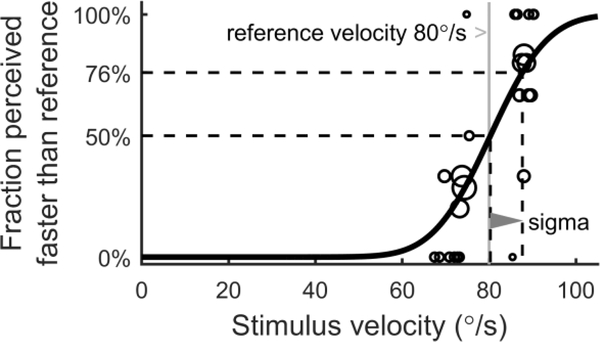
Our above results describe VOR variability that was proportional to chair velocity. We now describe the comparison of stimulus-dependent imprecision in perception and the VOR as a function of chair velocity. Figure 7 shows an example of the perceptual just-noticeable difference (JND) results for one condition for a single subject. Circles indicate the fraction of trials at each stimulus velocity in which the comparison motion was perceived faster than the reference motion with a peak velocity of 80°/s (grey line). For brevity, we use the term “stimulus velocity” to refer to the peak velocity of the comparison motion, and “reference velocity” to refer to the peak velocity of the reference motion. The black curve shows the cumulative Gaussian psychometric curve fit to the individual responses. The 50% and 76% levels (dashed lines) were respectively 80.30°/s and 87.66°/s in this example. Perceptual sigma (grey triangle), which reflects the noise standard deviation of the underlying sensory channel, is the difference between these two levels and is 7.36°/s in this example. (The Methods describe why perceptual sigma should be determined using the 76% level rather than the typical 84% level.) As in most cases, the 50% level was very close to the reference velocity.
Figure 7:
Psychometric curve fit (black line) for a single condition and subject. Circles indicate the fraction of trials at each stimulus velocity in which the comparison motion was perceived faster than the reference motion, with the size of the circles indicate the number of trials at each stimulus velocity. The difference between the 50% and 76% levels (dashed lines) is perceptual sigma (grey triangle).
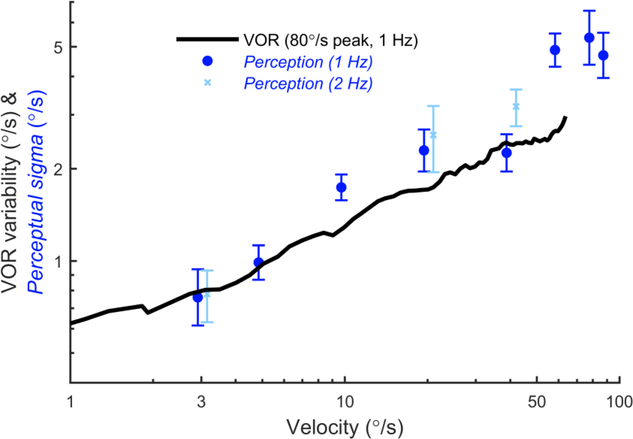
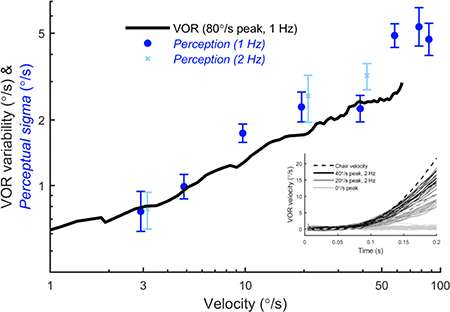
Figure 8 shows perceptual sigma at each reference velocity. For example, for 1 Hz motions with a reference velocity of 3°/s, the mean perceptual sigma across subjects was 0.76°/s, which increased to 4.7°/s at 90°/s (●). Perceptual sigma increased in proportion to chair velocity, and was very similar to values previously reported (Mallery et al., 2010, Nesti et al., 2015). Perceptual sigmas for 2 Hz motions (x) with reference velocities of 3, 20 and 40°/s followed a similar trend and were not significantly different from those for 1 Hz for any reference velocity (paired t-test, p>0.05). For comparison, the VOR variability as a function of chair velocity is also shown, which was measured in the same group of subjects. There is broad overlap between the two curves, with no statistically-significant difference between perceptual sigma and VOR variability at the corresponding velocities (paired t-test, p=0.213). This is consistent with a shared noise source that underlies perceptual and VOR imprecision. We also found that the 50% levels for the psychometric curve fits were never significantly different from the reference velocities. For the eight reference velocities, the geometric means were 3.07°/s, 5.27°/s, 10.19°/s, 19.50°/s, 40.26°/s, 60.46°/s, 79.63°/s and 90.18°/s.
Figure 8:
Perceptual sigma and VOR variability have a similar dependency on velocity. For perceptual measurements, the x-axis is the peak velocity of the reference motion, while for VOR measurements it is the instantaneous chair velocity. Each symbol indicates the mean perceptual sigma across subjects for one reference peak velocity, calculated using the geometric mean. The error bars indicate standard error. The black line shows average VOR variability from the same subjects in response to stimuli with a peak velocity of 80°/s.
Measurement of trial-to-trial motion device variability
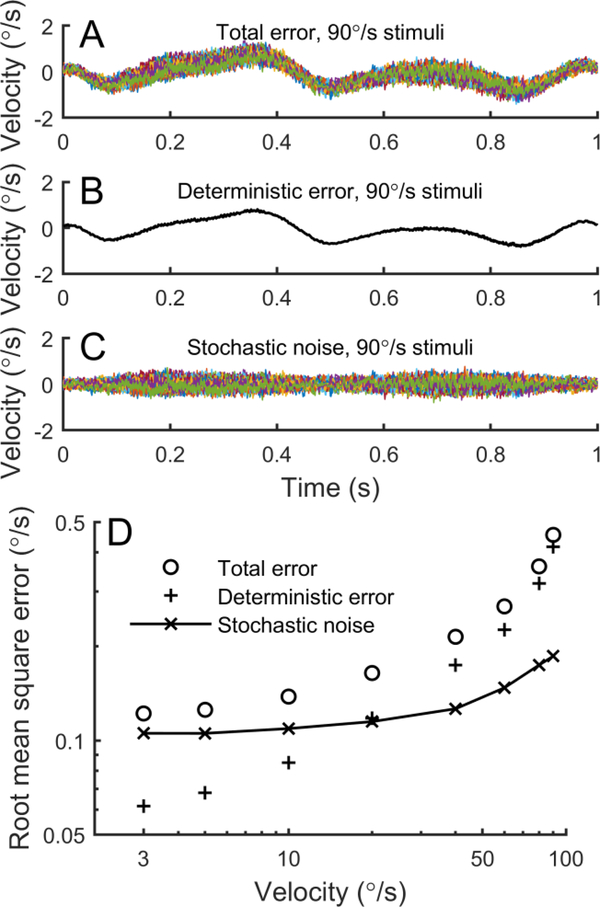
Since trial-to-trial variability in perceptual and sensorimotor responses could arise from trial-to-trial variability in motion device stimuli, we also characterized variability in our motion device, using a previously described approach (Nesti et al., 2014). Figure 9A shows the total error in 40 repetitions of a stimulus with a peak velocity of 90°/s, which is the difference between the actual motion and intended motion. Figure 9B shows the deterministic error, which is the mean across repetitions of the total error. This shows that the systematic deviation of the device from the intended motion is very low. Finally, Figure 9C shows the stochastic noise, which is the remaining trial-to-trial variability after the deterministic error is subtracted.
Figure 9:
Trial-to-trial motion device variability is small compared to behavioral variability. A: Total error for 40 trials with a peak velocity of 90°/s, showing the difference between actual and intended motion. B: Deterministic error is the average deviation between actual and intended motion. C: Stochastic noise is the total error for each trial less the deterministic error, and indicates the trial-to-trial variability in motion stimuli. D: The dependency of total error, deterministic error and stochastic noise on peak stimulus velocity.
Figure 9D shows the total error, deterministic error and stochastic noise as a function of stimulus velocity, with measurements made at the same reference velocities used to measure perception. We emphasize that stochastic noise is the primary concern in measuring trial-to-trial variability in perceptual and sensorimotor responses. We found that stochastic noise remained between 0.10°/s and 0.20°/s for all motion amplitudes, which is much smaller than perceptual sigma and VOR variability.
Discussion
We investigated stimulus-dependence of VOR variability and perceptual JNDs using yaw rotation about an Earth-vertical axis. We found that VOR variability increased from approximately 0.6°/s at a chair velocity of 1°/s to approximately 3°/s at 65°/s. Similarly, we found that perceptual sigma increased from 0.76°/s for a reference motion with a peak velocity of 3°/s to 4.7°/s at 90°/s. We also found that velocity is the salient cue for VOR variability, by comparing responses using stimuli that manipulated the relationship between velocity, acceleration and displacement. VOR variability exhibited a stimulus-independent range below roughly 1°/s. There is broad overlap between the VOR variability and perceptual sigma curves, with no statistically-significant difference at the corresponding velocities (paired t-test, p=0.213), consistent with a shared noise source that underlies perceptual and VOR imprecision.
In the following sections, we discuss our VOR variability results in the context of related studies, the evidence for a common source of noise, clinical implications, how stimulus-dependent imprecision may arise neurally, the implications for velocity storage, and possible sources of experimental error.
VOR imprecision
Our results extend existing studies and provide a more comprehensive characterization of VOR imprecision. One study investigated VOR thresholds (Haburcakova et al., 2012) in nonhuman primates and found that the eyes often erroneously move in the non-compensatory direction during small, threshold-level motions. They found that VOR thresholds were relatively constant for stimuli between 0.2 Hz and 3 Hz, and were roughly 0.6°/s. Interestingly, this corresponds to the roughly 0.6°/s VOR variability we measured when chair velocity was below 1°/s. Another approach has been to measure nystagmic thresholds (Seemungal et al., 2004, Patel et al., 2014), the acceleration at which the first nystagmic fast phase occurred in response to slow yaw velocity ramps. These studies determined a threshold in humans of 0.5°/s/s. Another study measured trial-to-trial variations in the VOR during yaw rotation in non-human primates (Guo and Raymond, 2010). That study found that VOR variability increased from approximately 0.7°/s for sinusoids with a peak velocity of 10°/s to approximately 0.9°/s at 30°/s. This is less than what we found, which may be because they determined average variability across the entire sinusoidal cycle, whereas we determine variability with respect to instantaneous velocity. Our findings extend the results of these studies by characterizing the transition from stimulus-independent to signal-dependent VOR imprecision, by measuring VOR imprecision at higher velocities, and by using human subjects.
A power law function has been shown to describe the relationship between precision and stimulus amplitude for a number of sensory stimuli. We found that a power law function provided a satisfactory description of the relationship between VOR variability and chair velocity and the exponent of 0.41 is within the range of exponents found for different sensory cues (Stevens, 1957, Teghtsoonian, 1971, Norwich and Wong, 1997).
The presence of stimulus-dependent imprecision could be clinically important because it implies that motion velocity is an additional dimension that can be characterized in addition to frequency (Grabherr et al., 2008) and other variables. Perceptual recognition thresholds collected using threshold-level stimuli are sensitive to disease (Lewis et al., 2011, Valko et al., 2012), medication (Diaz-Artiles et al., 2017), age (Bermudez Rey et al., 2016) and balance performance (Karmali et al., 2017), and JNDs were substantially elevated for a subject with bilateral hypofunction (Mallery et al., 2010), but further investigation will determine how other characteristics vary for suprathreshold stimuli corresponding to motion during daily activities.
We used principal component analysis to decompose the time-course of behavioral variability (e.g., Sanger, 2000, Osborne et al., 2005). We found that a single component accounted for almost all of the stimulus-dependent component of VOR variability. This component had a similar temporal profile to the stimulus velocity, providing further evidence that velocity is the salient variable for VOR variability. It is also consistent with previous work suggesting that sensory and motor variability has low dimensionality (Sanger, 2000, Osborne et al., 2005). Furthermore, once the contributions of the first component were removed, the remaining variability was similar to that present during no motion trials, showing that the first component captured almost all variability related to motion.
In Figure 3 it is evident that trial-to-trial VOR variability was dominated by variation that occured over the length of a trial. This contrasts with no-motion trials, for which more rapid variation are noticeably. This suggests that most motion-related variability has energy concentrated at frequencies below the motion stimulus frequency, rather than at higher frequencies. Variations persisted over hundreds of milliseconds, such that a trial that tended to be above or below the mean near the beginning would tend to remain there till the end. This is supported by the finding that a single PCA component explains motion-related variability. Similar low-frequency variability is observed in arm movements (Sanger, 2000), smooth pursuit (Osborne et al., 2005) and vestibular afferents (Sadeghi et al., 2007a). A possible interpretation of this observation is that trial-to-trial variability arises from variation in VOR gain.
Mutual information (Shannon, 1948) was low at low velocities, consistent with stimulus-independent noise swamping the available signal, then increased to a plateau of ~4.3 bits/sample above roughly 5°/s. Channel capacity was similar for all conditions despite differences in demands on the system. This result is analogous to Fitts’ law (Fitts, 1954), which states that planned motor actions are constrained by a fixed channel capacity. Note that Fitts’ law does not specifically apply to our result because we studied a sensorimotor reflex rather than planned motor behavior; we were unable to find any published studies applying Fitts’ law to reflexes. Fitts’ law explains the speed-accuracy tradeoff by postulating that the brain plans movement time based on the desired position accuracy at the end point of a motion. In contrast, we were studying the instantaneous errors that occur as a function of velocity during a motion for which the brain could not have prior knowledge of the end point. Nonetheless, our results are consistent with a fixed throughput, as proposed by Fitts (Fitts, 1954).
The plateau at 4.3 bits/s extrapolates to a maximum channel capacity of ~946 bits/s based on a sampling rate of 220 samples/s, although the actual channel capacity is likely lower because this does not account for temporal correlations in the data. This is high compared to the channel capacity observed in neuronal recordings (Borst and Theunissen, 1999), such as 12 bits/s for monkey visual motion neurons, 104 bits/s for fly visual-motion interneurons, 133 bits/s for frog auditory afferents and 294 bits/s for cricket mechanical sensory afferents. It is also high compared to individual vestibular regular and irregular afferents (Sadeghi et al., 2007a). This higher throughput may be explained by the roughly 1800 afferents (Bergstrom, 1973, Lopez et al., 2005) innervating each semicircular canals that carry overlapping information about motion, which increases the signal to noise ratio. While we showed mutual information calculated using the unfiltered eye velocity signal, mutual information calculated using the filtered signal was only slightly higher, with a plateau of ~4.5 bits/sample. This provides confidence that the computed values reflect the true capacity of the system. There were small differences in mutual information between conditions for head velocities <2°/s, but it is unclear where these arose from and if they are artifacts.
Perceptual imprecision
Increasing perceptual JNDs with stimulus magnitude have been found for a number of tasks, including perception of sound intensity (Riesz, 1928), visual contrast (Pelli, 1985), visual object size (Ganel et al., 2008, Ganel et al., 2017), vestibular lateral translation (Naseri and Grant, 2012), and vestibular yaw rotation (Mallery et al., 2010, Nesti et al., 2015). Furthermore, trial-to-trial perceptual variability increases with tilt orientation assayed using a subjective visual vertical task (De Haes, 1970, Vingerhoets et al., 2009, Clemens et al., 2011, Alberts et al., 2016). There is also some evidence of a constant range at low amplitudes. Together, these studies suggest that the brain may employ a common strategy across sensory systems.
There was no significant difference between perceptual sigma for 1 and 2 Hz motions with the same peak reference velocity, suggesting that perceptual imprecision depends on velocity, since the two motions have different accelerations and displacements. Furthermore, perceptual peak velocity sigmas were very similar to peak velocity JNDs previously reported in studies which used different stimuli, i.e., multiple sinusoidal cycles (Mallery et al., 2010, Nesti et al., 2015). Nonetheless, our subjects and those in the previous studies were requested to report which of the two intervals was faster, and it is conceivable that a different question could yield a different result. For example, if subjects were asked to report which of the two intervals had a larger displacement, or which of the two intervals accelerated more, it is possible that perceptual imprecision would vary with displacement or acceleration, respectively.
A common source of noise and common processing
The overlap between the VOR variability and perceptual sigma curves are consistent with a common noise source that underlies perceptual and VOR imprecision over a broad range of stimulus amplitudes. This may include noise arising from the sensory periphery, but also shared afferents and shared early central processing, including noise arising from hair cell and afferent ion channels and from synaptic transmission. An alternative explanation is that perceptual noises affect perception and separate motor noises affect the VOR, but the noise sources would have to have similar magnitudes across a broad range of stimuli, which is unlikely.
We were unable to find reports for any sensory system of similar stimulus-dependent motor and perceptual imprecision. In fact, studies of visual object size estimation found that JNDs were invariant with object size for visuomotor grasping behavior and increased with object size for perception (Ganel et al., 2008, Ganel et al., 2017), suggesting different central mechanisms. Thus, to our knowledge, we present the first evidence consistent with common noise and processing for stimulus-depenent perception and action.
An important clinical implications of this result is the knowledge that diagnostic testing using perceptual and VOR variability measures indeed reflects vestibular noise, and thus can be used specifically for vestibular diagnoses. Another implication is that both VOR and perceptual testing can be pursued for diagnostic testing. Given the importance of rapid testing and given that these tests currently can take up to one hour, having two parallel approaches allows more potential for optimization.
A few studies have attempted to compare VOR and perceptual imprecision for small stimuli. Non-human primate yaw VOR thresholds (Haburcakova et al., 2012), roughly 0.6°/s, are similar to human perceptual yaw thresholds (Grabherr et al., 2008), which have a plateau of approximately 0.71°/s at frequencies over roughly 2 Hz. Another study found that perceptual thresholds were higher than nystagmic thresholds (1.2°/s/s vs. 0.5°/s/s) in the same human subjects (Seemungal et al., 2004). While these results seem inconsistent, they may be explained by differences in stimulus frequency content, since there is evidence of attenuation of low-frequency content in perceptual decision making (Grabherr et al., 2008, Merfeld et al., 2016). Specifically, the Seemungal et al. study used a stimulus with significant low-frequency content, which may have elevated perceptual thresholds, while the Harurcakova/Grabherr studies were compared for 2 Hz stimuli, for which there is minimal attenuation due to decision-making filtering. Chang et al. (2014) compared perceptual JNDs to the VOR and came to a different conclusion than we did, but this is not surprising, since they compared perceptual JNDs to VOR gain and we compared them to VOR variability.
A strength of our study was that action and perception were compared in the same group of subjects. Greater support for the shared-noise hypothesis would have been provided by examining whether VOR and perceptual imprecision covaried across trials and subjects. It would be extremely interesting to measure and compare vestibular action and perception on a trial-bytrial basis as has been done for visual motion (Stone and Krauzlis, 2003, Rasche and Gegenfurtner, 2009). Despite approximately 5 hours of testing per subject, the data collected on each subject was not enough to reduce measurement variability sufficiently to allow an intersubject analysis, and an exploratory analysis was inconclusive. Future studies could collect a larger number of trials on each subject.
Physiologic origin of stimulus-dependent imprecision
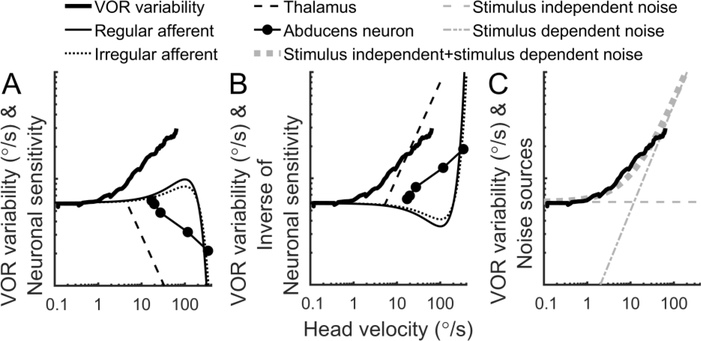
We now consider how the stimulus-dependent imprecision observed at the behavioral level may arise from the underlying neural circuitry. In Figure 10 and in the text below we describe three ways in which the stimulus-dependent behavioral imprecision may arise from: 1) non-linearities in vestibular neurons, 2) downstream corrections for these non-linearities and/or 3) neuronal noise that varies with stimulus amplitude,.
Figure 10:
Exploring the possible physiologic origins of stimulus-dependent behavioral imprecision. A: VOR variability compared to the properties of vestibular afferent and thalamic neurons, and abducens neurons. The sensitivity of each has been arbitrarily scaled for display purposes, without changing the slope of the curves. B: VOR variability compared to the inverse of the properties of the same neurons. C: VOR variability compared to stimulus-independent noise, stimulus-dependent noise and a combination of the two.
Figure 10A compares non-linearities in vestibular neurons with VOR variability. Since vestibular neurons have sensitivities that vary with stimulus amplitude, if a stimulus-independent noise is predominant, these non-linearities will vary the amplification of the noise depending on the stimulus amplitude. For example, SCC afferents have a range where they are approximately linear (Hullar and Minor, 1999, Sadeghi et al., 2007a), and a range above roughly 100°/s where they have reduced sensitivity and reach saturation. Recent work has shown that both regular and irregular responses are well described by a sigmoid curve (Sadeghi et al., 2007b, Schneider et al., 2015). Vestibular thalamic neurons also exhibit decreasing sensitivity with increasing angular velocity, beginning at velocities less than 10°/s (Marlinski and McCrea, 2008, Dale and Cullen, 2016). The velocity coefficient describing the relationship between abducens neuron firing and eye velocity also decreases as eye velocity increases (Sylvestre and Cullen, 1999). These nonlinearities (Figure 10A, thin lines) do not have a similar shape to VOR variability (Figure 10A, thick line), and thus they do not alone explain our results.
Another possibility is that downstream processing accounts for these non-linearities and also shapes noise (Figure 10B). For example, the VOR is linear with velocity up to 350°/s (Pulaski et al., 1981), and thus downstream processing would need to account for upstream nonlinearities using an inverse function with enhanced amplification at higher velocities. This would also result in increased amplification of noise at higher velocities. Figure 10B shows the inverse of each the neuronal sensitivities shown in Figure 10A. These curves equivalently show the expected imprecision if these non-linearities were applied to a stimulus-independent noise source. They suggest that compensation for afferent non-linearities would not explain VOR variability, but that compensation for non-linearities present in thalamus or abducens neurons could explain VOR variability.
Figure 10C compares neural noise sources with different properties with VOR variability. For example, stimulus-independent noise, sometimes called additive noise, has a constant amplitude regardless of stimulus amplitude (Figure 10C, grey dashed line). Conversely, stimulus-dependent noise varies with stimulus amplitude. We distinguish between stimulus-dependent behavioral imprecision, which we use to describe imprecision in the VOR and perception, and stimulus-dependent noise, which describes the underlying neural properties. A common type of stimulus-dependent noise is multiplicative noise, in which the noise scales linearly with stimulus (Figure 10C, grey dot-dash line). Stimulus-dependent noise is observed in motor control and is thought to arise from the recruitment of motor units (Jones et al., 2002). Noise can also include both stimulus-dependent and stimulus-independent components (Figure 10C, grey thick dotted line). While the amplitude of these noises were chosen to fit the data, they show that a combination of stimulus-independent and stimulus-dependent noises best fit our data, which is consistent with our result that one principal component explained most of the stimulus-dependent variability, and the remaining components explain stimulus-independent variability.
There is some evidence for stimulus-dependent noise in vestibular neurons. Specifically, macaque vestibular afferents velocity detection thresholds (Massot et al., 2011) were relatively constant across a range of frequencies, while neuronal sensitivity increased across the same frequencies (Sadeghi et al., 2007a, Massot et al., 2011). These data show that signal-to-noise ratio remains relatively constant as sensitivity increased, indicating that noise increases with response amplitude. The exact properties of this stimulus-dependent noise and that of other vestibular neurons is not yet known, so we cannot make conclusions about whether it explains our results. (In this case frequency serves as a convenient manipulation, and the frequency responses themselves do not provide evidence of increasing variability with increasing signal.)
To summarize, our results could be explained by downstream corrections for non-linearities in thalamus and/or abducens neurons, or a combination of stimulus-dependent and stimulus-independent noise.
It is perhaps unsurprising that yaw VOR variability depends on velocity, since the SCC pathways predominantly operate in the velocity domain at our stimulus frequencies. A related prediction is that variability would depend on acceleration for stimuli below 0.03 Hz, where the SCC predominantly transduces acceleration (Melvill Jones and Milsum, 1971). We also note that VOR variability is slightly larger for trials with a peak velocity of 80°/s vs. other conditions when chair velocity is roughly 10°/s (Figure 4), which may indicate a secondary contribution of cues other than velocity, but further research will be required to determine this contribution.
Implications for velocity storage
Velocity storage refers to the central mechanisms that estimate spatial orientation based on noisy, sometimes inaccurate sensory cues. Velocity storage is often framed in terms of the perseveration of decaying SCC signals during constant velocity Earth-vertical yaw rotation (Robinson 1977; Raphan et al. 1977), extending the SCC time constant of ~6 s (Fernandez and Goldberg 1971; Jones and Milsum 1971) to the VOR time constant of 15–35 s (Dimitri et al. 2001). It has been hypothesized that velocity storage dynamics are determined based on the statistical properties of sensory noise and experienced motion (Borah et al., 1988, Paulin et al., 1989, Laurens and Droulez, 2007, Laurens and Angelaki, 2011, Karmali and Merfeld, 2012, Karmali et al., 2018). Specifically, while it would be advantageous to extend the dynamics of the SCC even longer to improve the low-frequency accuracy of the VOR, this would result in the accumulation of noise that would cause drift in the VOR and motion estimates, and the brain determines a time constant that balances between the competing demands of being accurate and being precise (Laurens and Angelaki, 2011, Karmali and Merfeld, 2012).
One prediction of this hypothesis is that it is appropriate to have a lower VOR time constant when sensory noise is higher. Since we found higher vestibular imprecision at higher velocities, we predict a corresponding lower VOR time constant. In fact this is qualitatively consistent with experimental results that find shorter VOR time constants at higher stimulus velocities (Paige, 1992, Baloh et al., 2001). For example, Paige (1992) reported VOR phase for 0.025 Hz sinusoids to be 14.3°, 20.6°, 26.6° and 33.1° for 50, 100, 200 and 300°/s, respectively. Assuming a first order high-pass filter, the time constant and phase for a particular frequency are related by (time constant)=tan(90°-phase)/(2πf), where f=0.025 Hz. Thus, these phases correspond to time constants of 25, 17, 13 and 10 s, respectively. Previous modeling has provided an alternate hypothesis, that the difference between the VOR in response to steps of 60 and 240°/s is explained by the velocity storage mechanism saturating at approximately 25°/s (Paige and Sargent, 1991, Laurens et al., 2011). Future work can quantitatively compare these predictions with experimental results.
Potential experimental errors
We now discuss potential sources of error and the steps taken to quantify and mitigate errors arising from the motion device, eye tracking, analysis and velocity storage.
We characterized the deviation between the intended and actual motions produced by the eccentric rotator motion device and found that stochastic noise was very small compared to behavioral variability. Specifically, it ranged from approximately 0.1°/s to 0.2°/s. In fact, the stochastic noise at low velocities likely arises from instrumentation noise in the inertial measurement unit, and thus the trial-to-trial variability in motion stimuli is probably closer to 0.1°/s. Regardless, this is much less than the VOR variability and perceptual sigma, which ranged from 0.6°/s to 5°/s. Furthermore, there was not a close correspondence between the slopes of the stochastic noise and the behavioral results. We also found that deterministic errors, the systematic deviation of the actual motion from the intended, were small. These systematic deviations would not result in VOR variability or differences in perceptual stimuli. We replicated previous analyses that showed that potential differences in vibration between reference and comparison motions are not sufficient to provide a perceptual cue (Mallery et al., 2010) by comparing stochastic noise at neighboring velocities in Figure 9 (e.g., 3°/s vs. 5°/s, 80°/s vs. 90°/s). As in the past analysis, we found no significant difference for any comparison (t-test, p>0.9). Furthermore, this potential cue is unlikely to explain our results because: a) it would not be relevant to VOR variability; b) it would likely result in decreasing JNDs with stimulus amplitude, given that the slope between stochastic noise and velocity was steeper at higher velocities; c) we previously showed no significance difference in thresholds between tasks where non-vestibular cues did and did not provide a useful cue (Chaudhuri et al., 2013), using the same motion device used for this study.
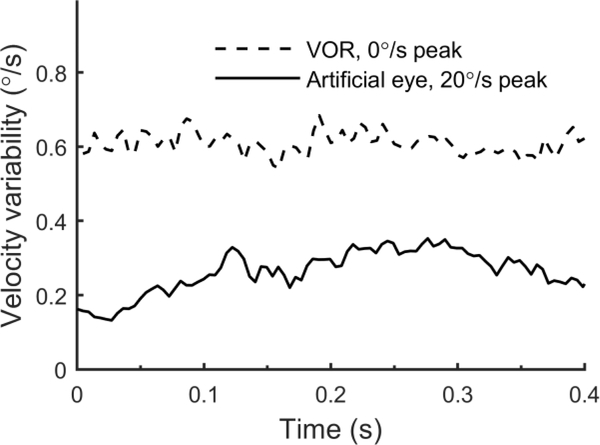
Video eye tracking was used because it has been used to study human eye movement variability (Stone and Krauzlis, 2003) and for subject comfort. Similar VOR variability characteristics have been measured using scleral magnetic search coils in non-human primates (Guo and Raymond, 2010, Karmali and Merfeld, 2010, Haburcakova et al., 2012). To evaluate potential artifact from mechanical effects on the video eye tracker, we tested a subject who wore an image of an artificial eye that covered their eye. We repeatedly rotated this subject using 1 s motions with a peak velocity of 20°/s. Artificial eye movements were tracked and analyzed using the same analyses used for actual eye movements. We determined artificial eye velocity variability, which is analogous to VOR variability. Figure 11 shows that artificial eye velocity variability during motion is much smaller than VOR variability for trials with no motion. Artificial eye velocity variability is largest around the time of peak acceleration rather than peak velocity. This is consistent with mechanical inertia causing the eye tracker goggle to lag slightly. These data were collected using a Moog motion device, which has higher vibration than the eccentric rotator used for human testing (Chaudhuri et al., 2013), and thus mechanical eye tracker artifacts may have been less during subject testing. Futhermore, we can think of no mechanism by which a velocity-dependent artifact would develop from the high-frequency jitter that results from fitting an ellipse to the pupil in video eye tracking. High-pass filtering attenuate this instrumentation error much more than it affects physiologic variability, since it is evident that variation in the VOR extends across entire trials (Figure 3), showing that physiologic variability has energy across a broader frequency range. A sensitivity analysis found that the results are relatively insensitive to the filter characteristics (Figure 12).
Figure 11:
Artifacts arising from eye tracking. The black line shows velocity variability for tracking of an artificial eye image during repeated 1 Hz, 20°/s motions. For comparison, the variability of the VOR during no-motion trials is shown (geometric mean across 6 subjects).
Figure 12:
Sensitivity analysis to show the effects of filtering and normalization on VOR variability.
Since our results are all presented after normalizing each VOR response by the average VOR gain, we also show the VOR variability for the unnormalized trials to show that it had little impact on the conclusions (Figure 12, grey dashed lines).
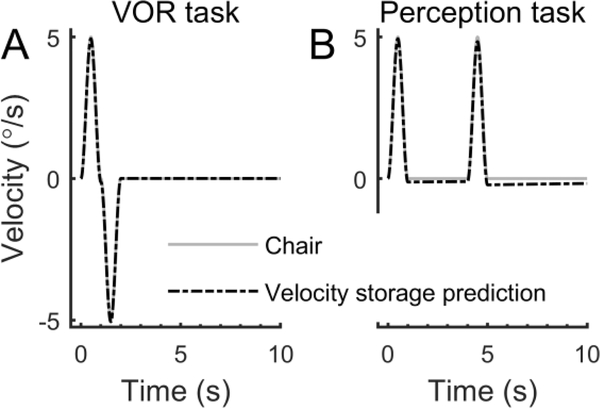
We also designed these experiments to mitigate the impact of another potential source of error: post-rotatory aftereffects resulting from velocity storage (Mallery et al., 2010, Nesti et al., 2015). We chose to wait at least 3 s between motions because there is no evidence of an aftereffect of large motions on threshold-level perception with an interval of 3 s between motions (Coniglio and Crane, 2014), even though there is an effect for shorter intervals. Futhermore, we chose brief (0.5 and 1 s) motions to minimize the post-rotatory aftereffect from velocity storage. We modeled this potential artifact by high-pass filtering the chair motion used for the VOR and perceptual tasks using a filter with a time constant of 20 s (Dimitri et al., 2001). Figure 13A shows the velocity storage prediction for the VOR task, which consisted of two back-to-back identical motions with opposite polarities. In this case the predicted aftereffect after 3 s is 0.10% of the peak velocity, so the predicted aftereffect for a peak velocity of 5°/s was 0.005°/s (vs. VOR variability of 0.98°/s at 5°/s). For the motions used for the perception task (Figure 13B), the predicted sense of the peak velocity for the second interval was 2.0% less than the first interval, so the predicted artifact for a peak velocity of 5°/s was 0.10°/s (vs. perceptual sigma of 0.99°/s at 5°/s). The predicted velocity storage artifact increases linearly with velocity, including if velocity storage is modeled using a second-order filter and with other time constants. We note that a potential velocity storage artifact would: 1) be different for the two tasks and could not explain the similarity between the VOR and perception results; 2) be different for our stimuli and those used for other perception studies (Mallery et al., 2010, Nesti et al., 2015), and could not explain the similarity in JNDs between the three studies; and 3) not have the power law relationship describing our results.
Figure 13:
Velocity storage predictions for the stimuli used for the VOR (A) and perception (B) tasks.
Summary
We characterize trial-to-trial VOR variability and perceptual JNDs using supra-threshold motion. We found that imprecision in both increases with stimulus amplitude, that velocity is the salient variable for VOR variability, and that VOR variability exhibited a stimulus-independent range below ~1°/s. We also found that there is broad overlap between the VOR variability and perceptual sigma curves, consistent with a shared noise source that underlies perceptual and VOR imprecision.
Highlights.
Trial-to-trial VOR variability increased with chair velocities between ~1°/s and 65°/s.
Trial-to-trial VOR variability exhibited a stimulus-independent range below ~ 1°/s.
VOR and perceptual imprecision were similar over a range of stimulus velocities.
Velocity was the salient cue for VOR variability for our range of motion stimuli.
Acknowledgements
We appreciate the participation of our anonymous subjects. We thank Daniel M. Merfeld for the use of his Eccentric Rotator device. We thank Richard F. Lewis for the use of his video eye tracker. We appreciate the scientific insights provided by Daniel M. Merfeld, Kathleen E. Cullen and Richard F. Lewis. We appreciate technical and data collection assistance provided by Susan King, Ashwin Ramachandran, Cyril L. Benoit and Nadeem Bandealy. This research was supported by the National Institutes of Health through NIDCD DC013635 (FK). The authors declare that they have no conflict of interests.
Footnotes
Publisher's Disclaimer: This is a PDF file of an unedited manuscript that has been accepted for publication. As a service to our customers we are providing this early version of the manuscript. The manuscript will undergo copyediting, typesetting, and review of the resulting proof before it is published in its final citable form. Please note that during the production process errors may be discovered which could affect the content, and all legal disclaimers that apply to the journal pertain.
Contributor Information
Sirine Nouri, Jenks Vestibular Physiology Laboratory, Massachusetts Eye and Ear Infirmary, Boston, MA, Department of Otolaryngology, Harvard Medical School, Boston MA, USA, Ecole Centrale Lyon, Lyon, France.
Faisal Karmali, Jenks Vestibular Physiology Laboratory, Massachusetts Eye and Ear Infirmary, Boston, MA Department of Otolaryngology, Harvard Medical School, Boston MA, USA
References
- Alberts BB, Selen LP, Bertolini G, Straumann D, Medendorp WP, Tarnutzer AA (2016) Dissociating vestibular and somatosensory contributions to spatial orientation. J Neurophysiol 116:30–40. [DOI] [PMC free article] [PubMed] [Google Scholar]
- Baloh RW, Enrietto J, Jacobson KM, Lin A (2001) Age-related changes in vestibular function: a longitudinal study. Ann N Y Acad Sci 942:210–219. [DOI] [PubMed] [Google Scholar]
- Benson AJ, Hutt EC, Brown SF (1989) Thresholds for the perception of whole body angular movement about a vertical axis. Aviat Space Environ Med 60:205–213. [PubMed] [Google Scholar]
- Benson AJ, Spencer MB, Stott JR (1986) Thresholds for the detection of the direction of wholebody, linear movement in the horizontal plane. Aviat Space Environ Med 57:1088–1096. [PubMed] [Google Scholar]
- Bergstrom B (1973) Morphology of the vestibular nerve. II. The number of myelinated vestibular nerve fibers in man at various ages. Acta Otolaryngol 76:173–179. [DOI] [PubMed] [Google Scholar]
- Bermudez Rey MC, Clark TK, Wang W, Leeder T, Bian Y, Merfeld DM (2016) Vestibular Perceptual Thresholds Increase above the Age of 40. Front Neurol 7:162. [DOI] [PMC free article] [PubMed] [Google Scholar]
- Borah J, Young LR, Curry RE (1988) Optimal estimator model for human spatial orientation. Ann N Y Acad Sci 545:51–73. [DOI] [PubMed] [Google Scholar]
- Borst A, Theunissen FE (1999) Information theory and neural coding. Nat Neurosci 2:947–957. [DOI] [PubMed] [Google Scholar]
- Butler JS, Smith ST, Campos JL, Bulthoff HH (2010) Bayesian integration of visual and vestibular signals for heading. J Vis 10:23. [DOI] [PubMed] [Google Scholar]
- Chang NY, Hiss MM, Sanders MC, Olomu OU, MacNeilage PR, Uchanski RM, Hullar TE (2014) Vestibular perception and the vestibulo-ocular reflex in young and older adults. Ear Hear 35:565–570. [DOI] [PMC free article] [PubMed] [Google Scholar]
- Chaudhuri SE, Karmali F, Merfeld DM (2013) Whole-body motion-detection tasks can yield much lower thresholds than direction-recognition tasks: implications for the role of vibration. J Neurophysiol 110:2764–2772. [DOI] [PMC free article] [PubMed] [Google Scholar]
- Clemens IA, De Vrijer M, Selen LP, Van Gisbergen JA, Medendorp WP (2011) Multisensory processing in spatial orientation: an inverse probabilistic approach. J Neurosci 31:5365–5377. [DOI] [PMC free article] [PubMed] [Google Scholar]
- Coniglio AJ, Crane BT (2014) Human yaw rotation aftereffects with brief duration rotations are inconsistent with velocity storage. J Assoc Res Otolaryngol 15:305–317. [DOI] [PMC free article] [PubMed] [Google Scholar]
- Cousins S, Kaski D, Cutfield N, Seemungal B, Golding JF, Gresty M, Glasauer S, Bronstein AM (2013) Vestibular perception following acute unilateral vestibular lesions. PLoS One 8:e61862. [DOI] [PMC free article] [PubMed] [Google Scholar]
- Dale A, Cullen KE (2016) Sensory coding in the vestibular thalamus discriminates passive from active self-motion Program No. 181.10. 2016 Neuroscience Meeting Planner. San Diego, CA: Society for Neuroscience; Online. [Google Scholar]
- De Haes HAU (1970) Stability of apparent vertical and ocular countertorsion as a function of lateral tilt. Perception & Psychophysics 8:137–142. [Google Scholar]
- Deco G, Rolls ET (2006) Decision-making and Weber’s law: a neurophysiological model. Eur J Neurosci 24:901–916. [DOI] [PubMed] [Google Scholar]
- Diaz-Artiles A, Priesol AJ, Clark TK, Sherwood DP, Oman CM, Young LR, Karmali F (2017) The Impact of Oral Promethazine on Human Whole-Body Motion Perceptual Thresholds. J Assoc Res Otolaryngol 18:581–590. [DOI] [PMC free article] [PubMed] [Google Scholar]
- Dimitri PS, Wall C III, Oas JG, Rauch SD (2001) Application of multivariate statistics to vestibular testing: discriminating between Meniere’s disease and migraine associated dizziness. J Vestib Res 11:53–65. [PubMed] [Google Scholar]
- Ernst MO, Banks MS (2002) Humans integrate visual and haptic information in a statistically optimal fashion. Nature 415:429–433. [DOI] [PubMed] [Google Scholar]
- Faisal AA, Selen LP, Wolpert DM (2008) Noise in the nervous system. Nat Rev Neurosci 9:292–303. [DOI] [PMC free article] [PubMed] [Google Scholar]
- Fernandez C, Goldberg JM (1971) Physiology of peripheral neurons innervating semicircular canals of the squirrel monkey. II. Response to sinusoidal stimulation and dynamics of peripheral vestibular system. J Neurophysiol 34:661–675. [DOI] [PubMed] [Google Scholar]
- Fitts PM (1954) The information capacity of the human motor system in controlling the amplitude of movement. J Exp Psychol 47:381–391. [PubMed] [Google Scholar]
- Ganel T, Chajut E, Algom D (2008) Visual coding for action violates fundamental psychophysical principles. Curr Biol 18:R599–601. [DOI] [PubMed] [Google Scholar]
- Ganel T, Namdar G, Mirsky A (2017) Bimanual grasping does not adhere to Weber’s law. Scientific reports 7:6467. [DOI] [PMC free article] [PubMed] [Google Scholar]
- Gill J, Allum JH, Carpenter MG, Held-Ziolkowska M, Adkin AL, Honegger F, Pierchala K (2001) Trunk sway measures of postural stability during clinical balance tests: effects of age. J Gerontol A Biol Sci Med Sci 56:M438–447. [DOI] [PubMed] [Google Scholar]
- Grabherr L, Nicoucar K, Mast FW, Merfeld DM (2008) Vestibular thresholds for yaw rotation about an earth-vertical axis as a function of frequency. Exp Brain Res 186:677–681. [DOI] [PubMed] [Google Scholar]
- Green DM, Swets JA (1966) Signal Detection Theory and Psychophysics. New York: Wiley. [Google Scholar]
- Gu Y, Angelaki DE, DeAngelis GC (2008) Neural correlates of multisensory cue integration in macaque MSTd. Nat Neurosci 11:1201–1210. [DOI] [PMC free article] [PubMed] [Google Scholar]
- Gu Y, DeAngelis GC, Angelaki DE (2007) A functional link between area MSTd and heading perception based on vestibular signals. Nat Neurosci 10:1038–1047. [DOI] [PMC free article] [PubMed] [Google Scholar]
- Guo CC, Raymond JL (2010) Motor learning reduces eye movement variability through reweighting of sensory inputs. J Neurosci 30:16241–16248. [DOI] [PMC free article] [PubMed] [Google Scholar]
- Haburcakova C, Lewis RF, Merfeld DM (2012) Frequency dependence of vestibuloocular reflex thresholds. J Neurophysiol 107:973–983. [DOI] [PMC free article] [PubMed] [Google Scholar]
- Hullar TE, Minor LB (1999) High-frequency dynamics of regularly discharging canal afferents provide a linear signal for angular vestibuloocular reflexes. J Neurophysiol 82:2000–2005. [DOI] [PubMed] [Google Scholar]
- Jones KE, Hamilton AF, Wolpert DM (2002) Sources of signal-dependent noise during isometric force production. J Neurophysiol 88:1533–1544. [DOI] [PubMed] [Google Scholar]
- Karmali F, Bermudez Rey MC, Clark TK, Wang W, Merfeld DM (2017) Multivariate Analyses of Balance Test Performance, Vestibular Thresholds, and Age. Front Neurol 8:578. [DOI] [PMC free article] [PubMed] [Google Scholar]
- Karmali F, Chaudhuri SE, Yi Y, Merfeld DM (2016) Determining thresholds using adaptive procedures and psychometric fits: evaluating efficiency using theory, simulations, and human experiments. Exp Brain Res 234:773–789. [DOI] [PMC free article] [PubMed] [Google Scholar]
- Karmali F, Lim K, Merfeld DM (2014) Visual and vestibular perceptual thresholds each demonstrate better precision at specific frequencies and also exhibit optimal integration. J Neurophysiol 111:2393–2403. [DOI] [PMC free article] [PubMed] [Google Scholar]
- Karmali F, Merfeld DM (2010) Sensorimotor noise in the vestibulo-ocular reflex exhibits lowdimensional structure Program No. 677.10. 2010 Neuroscience Meeting Planner. San Diego, CA: Society for Neuroscience; Online. [Google Scholar]
- Karmali F, Merfeld DM (2012) A distributed, dynamic, parallel computational model: the role of noise in velocity storage. J Neurophysiol 108:390–405. [DOI] [PMC free article] [PubMed] [Google Scholar]
- Karmali F, Whitman GT, Lewis RF (2018) Bayesian optimal adaptation explains age-related human sensorimotor changes. J Neurophysiol 119:509–520. [DOI] [PMC free article] [PubMed] [Google Scholar]
- Landy MS, Maloney LT, Johnston EB, Young M (1995) Measurement and modeling of depth cue combination: in defense of weak fusion. Vision Res 35:389–412. [DOI] [PubMed] [Google Scholar]
- Laurens J, Angelaki DE (2011) The functional significance of velocity storage and its dependence on gravity. Exp Brain Res 210:407–422. [DOI] [PMC free article] [PubMed] [Google Scholar]
- Laurens J, Droulez J (2007) Bayesian processing of vestibular information. Biol Cybern 96:389–404. [DOI] [PubMed] [Google Scholar]
- Laurens J, Valko Y, Straumann D (2011) Experimental parameter estimation of a visuovestibular interaction model in humans. J Vestib Res 21:251–266. [DOI] [PubMed] [Google Scholar]
- Leek MR (2001) Adaptive procedures in psychophysical research. Percept Psychophys 63:1279–1292. [DOI] [PubMed] [Google Scholar]
- Lewis RF, Priesol AJ, Nicoucar K, Lim K, Merfeld DM (2011) Abnormal motion perception in vestibular migraine. Laryngoscope 121:1124–1125. [DOI] [PMC free article] [PubMed] [Google Scholar]
- Lim K, Karmali F, Nicoucar K, Merfeld DM (2017) Perceptual precision of passive body tilt is consistent with statistically optimal cue integration. J Neurophysiol 117:2037–2052. [DOI] [PMC free article] [PubMed] [Google Scholar]
- Lopez I, Ishiyama G, Tang Y, Frank M, Baloh RW, Ishiyama A (2005) Estimation of the number of nerve fibers in the human vestibular endorgans using unbiased stereology and immunohistochemistry. J Neurosci Methods 145:37–46. [DOI] [PubMed] [Google Scholar]
- MacNeilage PR, Ganesan N, Angelaki DE (2008) Computational approaches to spatial orientation: from transfer functions to dynamic Bayesian inference. J Neurophysiol 100:2981–2996. [DOI] [PMC free article] [PubMed] [Google Scholar]
- Mallery RM, Olomu OU, Uchanski RM, Militchin VA, Hullar TE (2010) Human discrimination of rotational velocities. Exp Brain Res 204:11–20. [DOI] [PMC free article] [PubMed] [Google Scholar]
- Marlinski V, McCrea RA (2008) Activity of ventroposterior thalamus neurons during rotation and translation in the horizontal plane in the alert squirrel monkey. J Neurophysiol 99:2533–2545. [DOI] [PubMed] [Google Scholar]
- Massot C, Chacron MJ, Cullen KE (2011) Information Transmission and Detection Thresholds in the Vestibular Nuclei: Single Neurons versus Population Encoding. J Neurophysiol 105:1798–1814. [DOI] [PMC free article] [PubMed] [Google Scholar]
- McCullagh P, Nelder JA (1989) Generalized linear models: Chapman and Hall London. [Google Scholar]
- Medina JF, Lisberger SG (2007) Variation, signal, and noise in cerebellar sensory-motor processing for smooth-pursuit eye movements. J Neurosci 27:6832–6842. [DOI] [PMC free article] [PubMed] [Google Scholar]
- Melvill Jones G, Milsum JH (1971) Frequency-response analysis of central vestibular unit activity resulting from rotational stimulation of the semicircular canals. J Physiol 219:191–215. [DOI] [PMC free article] [PubMed] [Google Scholar]
- Merfeld DM (2011) Signal detection theory and vestibular thresholds: I. Basic theory and practical considerations. Exp Brain Res 210:389–405. [DOI] [PMC free article] [PubMed] [Google Scholar]
- Merfeld DM, Clark TK, Lu YM, Karmali F (2016) Dynamics of individual perceptual decisions. J Neurophysiol 115:39–59. [DOI] [PMC free article] [PubMed] [Google Scholar]
- Naseri AR, Grant PR (2012) Human discrimination of translational accelerations. Exp Brain Res 218:455–464. [DOI] [PubMed] [Google Scholar]
- Nesti A, Beykirch KA, MacNeilage PR, Barnett-Cowan M, Bülthoff HH (2014) The importance of stimulus noise analysis for self-motion studies. PloS one 9:e94570. [DOI] [PMC free article] [PubMed] [Google Scholar]
- Nesti A, Beykirch KA, Pretto P, Bülthoff HH (2015) Human discrimination of head-centred visual–inertial yaw rotations. Exp brain res 233:3553–3564. [DOI] [PMC free article] [PubMed] [Google Scholar]
- Norwich KH, Wong W (1997) Unification of psychophysical phenomena: The complete form of Fechner’s law. Perception & Psychophysics 59:929–940. [DOI] [PubMed] [Google Scholar]
- Osborne LC, Lisberger SG, Bialek W (2005) A sensory source for motor variation. Nature 437:412–416. [DOI] [PMC free article] [PubMed] [Google Scholar]
- Paige GD (1992) Senescence of human visual-vestibular interactions. 1. Vestibulo-ocular reflex and adaptive plasticity with aging. J Vestib Res 2:133–151. [PubMed] [Google Scholar]
- Paige GD, Sargent EW (1991) Visually-induced adaptive plasticity in the human vestibuloocular reflex. Exp Brain Res 84:25–34. [DOI] [PubMed] [Google Scholar]
- Patel M, Nigmatullina Y, Seemungal BM, Golding JF, Bronstein AM (2014) Effects of prochlorperazine on normal vestibular ocular and perceptual responses: a randomised, double-blind, crossover, placebo-controlled study. Audiol Neurootol 19:91–96. [DOI] [PubMed] [Google Scholar]
- Paulin MG, Nelson ME, Bower JM (1989) Dynamics of compensatory eye movement control: an optimal estimation analysis of the vestibulo-ocular reflex. Int J Neural Syst 1:23–29. [Google Scholar]
- Pelli DG (1985) Uncertainty explains many aspects of visual contrast detection and discrimination. JOSA A 2:1508–1532. [DOI] [PubMed] [Google Scholar]
- Pulaski PD, Zee DS, Robinson DA (1981) The behavior of the vestibulo-ocular reflex at high velocities of head rotation. Brain Res 222:159–165. [DOI] [PubMed] [Google Scholar]
- Raphan T, Matsuo V, Cohen B (1977) A velocity storage mechanism responsible for optokinetic nystagmus (OKN), optokinetic after-nystagmus (OKAN) and vestibular nystagmus In: Control of gaze by brain stem neurons, developments in neuroscience, vol 1 (Baker R and Berthoz A, eds), pp 37–47 Amsterdam: Elsevier/North-Holland Biomedical Press. [Google Scholar]
- Rasche C, Gegenfurtner KR (2009) Precision of speed discrimination and smooth pursuit eye movements. Vision Res 49:514–523. [DOI] [PubMed] [Google Scholar]
- Riesz R (1928) Differential intensity sensitivity of the ear for pure tones. Physical Review 31:867. [Google Scholar]
- Robinson DA (1977) Vestibular and optokinetic symbiosis: an example of explaining by modeling In: Control of gaze by brain stem neurons, developments in neuroscience, vol 1 (Baker R and Berthoz A, eds), pp 49–58 Amsterdam: Elsevier/North-Holland Biomedical Press. [Google Scholar]
- Roditi RE, Crane BT (2012) Directional asymmetries and age effects in human self-motion perception. J Assoc Res Otolaryngol 13:381–401. [DOI] [PMC free article] [PubMed] [Google Scholar]
- Sadeghi SG, Chacron MJ, Taylor MC, Cullen KE (2007a) Neural variability, detection thresholds, and information transmission in the vestibular system. J Neurosci 27:771–781. [DOI] [PMC free article] [PubMed] [Google Scholar]
- Sadeghi SG, Minor LB, Cullen KE (2007b) Response of vestibular-nerve afferents to active and passive rotations under normal conditions and after unilateral labyrinthectomy. J Neurophysiol 97:1503–1514. [DOI] [PubMed] [Google Scholar]
- Sanger TD (2000) Human arm movements described by a low-dimensional superposition of principal components. J Neurosci 20:1066–1072. [DOI] [PMC free article] [PubMed] [Google Scholar]
- Schneider AD, Jamali M, Carriot J, Chacron MJ, Cullen KE (2015) The increased sensitivity of irregular peripheral canal and otolith vestibular afferents optimizes their encoding of natural stimuli. J Neurosci 35:5522–5536. [DOI] [PMC free article] [PubMed] [Google Scholar]
- Schoppik D, Nagel KI, Lisberger SG (2008) Cortical mechanisms of smooth eye movements revealed by dynamic covariations of neural and behavioral responses. Neuron 58:248–260. [DOI] [PMC free article] [PubMed] [Google Scholar]
- Seemungal BM, Gunaratne IA, Fleming IO, Gresty MA, Bronstein AM (2004) Perceptual and nystagmic thresholds of vestibular function in yaw. J Vestib Res 14:461–466. [PubMed] [Google Scholar]
- Selva P, Oman CM (2012) Relationships between Observer and Kalman filter models for human dynamic spatial orientation. J Ves Res 22:69–80. [DOI] [PubMed] [Google Scholar]
- Shannon C (1948) A mathematical theory of communication. Bell Syst Tech J 27:379–423 and 623–656. [Google Scholar]
- Stevens SS (1957) On the psychophysical law. Psychol Rev 64:153–181. [DOI] [PubMed] [Google Scholar]
- Stone LS, Krauzlis RJ (2003) Shared motion signals for human perceptual decisions and oculomotor actions. J Vis 3:725–736. [DOI] [PubMed] [Google Scholar]
- Sylvestre PA, Cullen KE (1999) Quantitative analysis of abducens neuron discharge dynamics during saccadic and slow eye movements. J Neurophysiol 82:2612–2632. [DOI] [PubMed] [Google Scholar]
- Taylor MM, Creelman CD (1967) PEST: Efficient estimates on probability functions. J Acoust Soc Am 41:782–787. [Google Scholar]
- Teghtsoonian R (1971) On the exponents in Stevens’ law and the constant in Ekman’s law. Psychol Rev 78:71–80. [DOI] [PubMed] [Google Scholar]
- Treutwein B (1995) Adaptive psychophysical procedures. Vision Res 35:2503–2522. [PubMed] [Google Scholar]
- Valko Y, Lewis RF, Priesol AJ, Merfeld DM (2012) Vestibular labyrinth contributions to human whole-body motion discrimination. J Neurosci 32:13537–13542. [DOI] [PMC free article] [PubMed] [Google Scholar]
- Vingerhoets RA, De Vrijer M, Van Gisbergen JA, Medendorp WP (2009) Fusion of visual and vestibular tilt cues in the perception of visual vertical. J Neurophysiol 101:1321–1333. [DOI] [PubMed] [Google Scholar]


