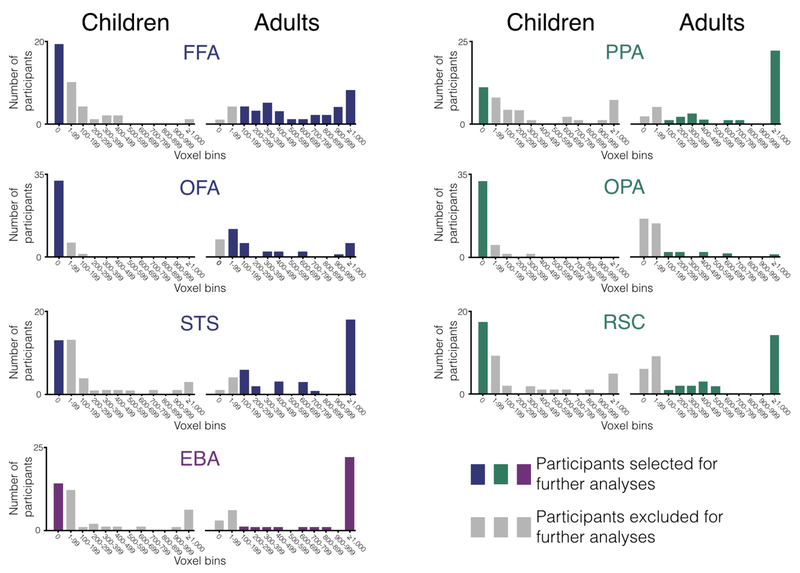
Figure 5.
Summary distribution of the size of the category-selective regions in every participant. On the x-axis of every plot is a series of voxel bins in which we group the number of voxels into discrete bins of 100 voxels. On the y-axis is the number of participants whose category-selective region land within a given bin. Across all plots, the colored bars mark the participants selected for further analyses (i.e., children with no category-selective voxels and adults with at least 100 category-selective voxels), while the grey bars mark participants excluded for further analyses (i.e., children with any category-selective voxels and adults with fewer than 100 category selective voxels).

