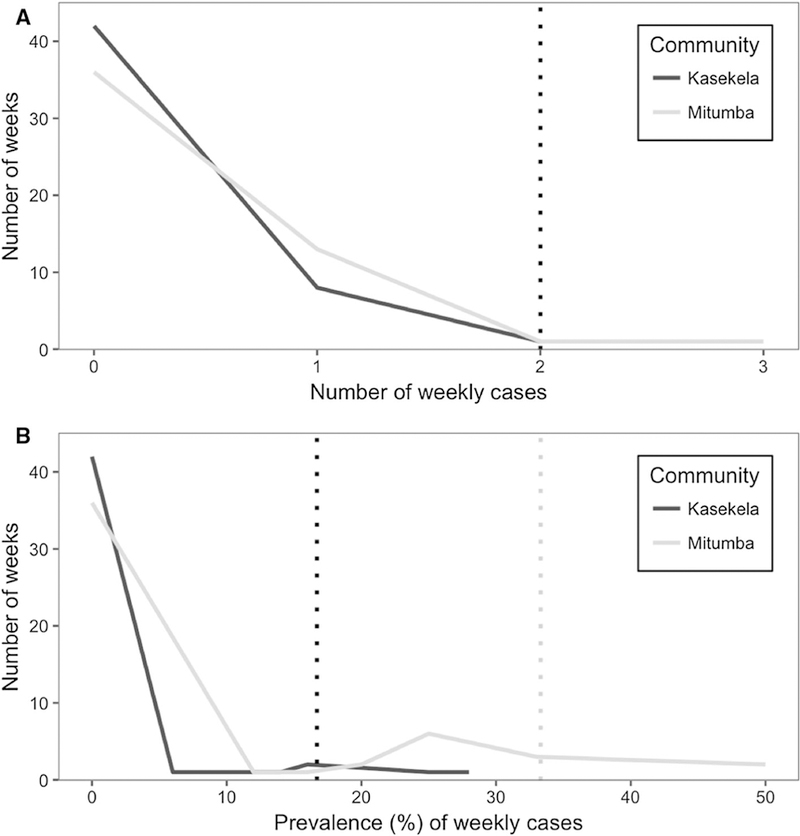
Fig. 5.

Frequency distribution of the baseline cumulative number and prevalence of weekly respiratory cases from the Daily Health Record in Year 1 of the study. Thresholds for outbreak detection in each community were set at the 95th percentile of the data, represented by the vertical dashed lines. Panel A represents the distribution of the weekly number of respiratory cases, where both communities had the same threshold (single vertical line). Panel B represents the distribution of the weekly prevalence of cases, where each community’s threshold is represented by individual vertical lines.
