

SUMMARY
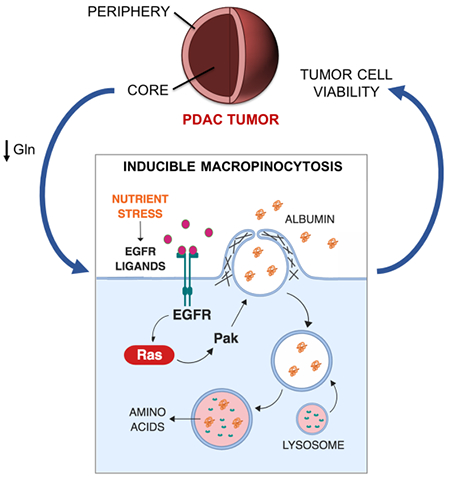
Macropinocytosis has emerged as an important nutrient scavenging pathway that supports tumor cell fitness. By internalizing extracellular protein and targeting it for lysosomal degradation, this endocytic pathway functions as an amino acid supply route, permitting tumor cell growth and survival despite the nutrient-poor conditions of the tumor microenvironment. Here, we provide evidence that a subset of pancreatic ductal adenocarcinoma (PDAC) tumors are wired to integrate contextual metabolic inputs to regulate macropinocytosis, dialing-up or -down this uptake pathway depending on nutrient availability. We find that regional depletion of amino acids coincides with increased levels of macropinocytosis and that the scarcity of glutamine uniquely drives this process. Mechanistically, this stimulation of macropinocytosis depends on the nutrient stress-induced potentiation of EGFR signaling that, through the activation of Pak1, controls the extent of macropinocytosis in these cells. These results provide a mechanistic understanding of how nutritional cues can control protein scavenging in PDAC tumors.
Graphical Abstract
eTOC Blurb
Macropinocytosis has emerged as an important protein scavenging pathway that supports tumor cell fitness in a variety of oncopathological settings. Lee et al. provide a mechanistic understanding of how nutritional status can modulate this endocytic pathway in PDAC tumors, showing that glutamine deprivation-induced potentiation of EGFR/Pak signaling regulates inducible macropinocytosis.
INTRODUCTION
A prevalent metabolic feature of PDAC cells is the acquisition of nutrients via macropinocytosis, an actin-dependent endocytic mechanism of fluid-phase uptake (Commisso et al., 2013; Davidson et al., 2017; Kamphorst et al., 2015; Palm et al., 2015; Recouvreux and Commisso, 2017). Macropinocytosis in these cancer cells drives the internalization of extracellular serum albumin, which is then degraded in a lysosome-dependent fashion, releasing protein-derived amino acids that contribute to the intracellular amino acid pools, as well as to the biosynthesis of central carbon metabolites (Commisso et al., 2013). These protein-derived amino acids produced by the macropinocytosis pathway have the capacity to support cancer cell survival and proliferation under conditions where amino acids are limiting (Commisso et al., 2013; Kamphorst et al., 2015). Importantly, the pharmacological inhibition of macropinocytosis in vivo leads to the suppression of tumor growth (Commisso et al., 2013).
Assessments in human PDAC tumors reveal that tumor cells engage in macropinocytosis and that these tumors display deficiencies in amino acid levels relative to adjacent non-neoplastic tissue (Kamphorst et al., 2015). Direct measurement of protein catabolism in murine PDAC cells has demonstrated that amino acid deprivation can induce production of protein-derived amino acids (Nofal et al., 2017); however, it is unclear whether this occurs as a result of increased macropinocytic induction or an enhanced capacity for lysosome-dependent protein degradation. Notably, the extent to which PDAC tumors display regional intratumoral amino acid deficiencies is unclear and how nutrient shortages might modulate macropinocytosis in tumors is unknown.
In this study, we demonstrate that PDAC tumors derived from human PDAC cells display regional amino acid depletion, with macropinocytic induction being most pronounced in tumor regions devoid of amino acids in a subset of tumors. We specifically attribute this macropinocytic enhancement to the deprivation of glutamine and define subsets of PDAC cells that display either glutamine depletion-dependent inducible macropinocytosis or glutamine-independent constitutive macropinocytic uptake. Mechanistically, we identify the potentiation of EGFR signaling as the driver of glutamine depletion-induced macropinocytosis and that EGFR ligands act to regulate macropinocytosis in a subset of PDAC cells through the activation of Pak1. These data provide important insights into the regulation of macropinocytosis in PDAC tumors.
RESULTS
Enhanced Macropinocytosis Coincides with Regional Amino Acid Deficiency in PDAC Tumors.
We and others have previously demonstrated that macropinocytosis is a prevalent feature of PDAC tumors and that amino acid production by this uptake pathway supports cancer cell growth and survival when nutrients are limiting (Commisso et al., 2013; Davidson et al., 2017; Kamphorst et al., 2015; Palm et al., 2015; Yoshida et al., 2015). In human PDAC tumors, many nutrients, including non-essential amino acids (NEAAs), are depleted relative to adjacent non-neoplastic pancreatic tissue (Kamphorst et al., 2015), but it remains unclear whether the extent of macropinocytosis in these tumors can be modulated by local intratumoral nutritional status. To determine whether regional amino acid deficiencies might be regulating intratumoral levels of macropinocytosis, we measured the concentrations of various polar metabolites in PDAC tissues originating from non-peripheral or peripheral regions of xenograft tumors. In tumors derived from either AsPC-1 or HPAF-II human PDAC cells, we found that the levels of many amino acids were appreciably lower in the non-peripheral regions relative to the periphery (Figures 1A and 1B). NEAAs, including asparagine, aspartate, glutamate, glutamine and serine, were the most significantly depleted amino acids in the non-peripheral regions (Figures 1C, 1D, S1A and S1B). To elucidate whether these regional amino acid deficiencies coincided with different levels of macropinocytosis, we assessed macropinocytic uptake in distinct intratumoral regions by microscopically demarcating the tumor periphery from the non-peripheral regions closer to the tumor core (Figure S1C). Interestingly, we found significantly higher levels of macropinocytosis in the non-peripheral areas of the tumor relative to the tumor periphery, as measured via the internalization of TMR-dextran, an established marker of macropinosomes (Figures 1E–1H and S1C). Together, these data indicate that the regional depletion of amino acids within PDAC tumors coincides with enhanced macropinocytic capacity.
Figure 1. Regional deficiency of amino acids coincides with enhanced macropinocytic capacity in PDAC tumors.
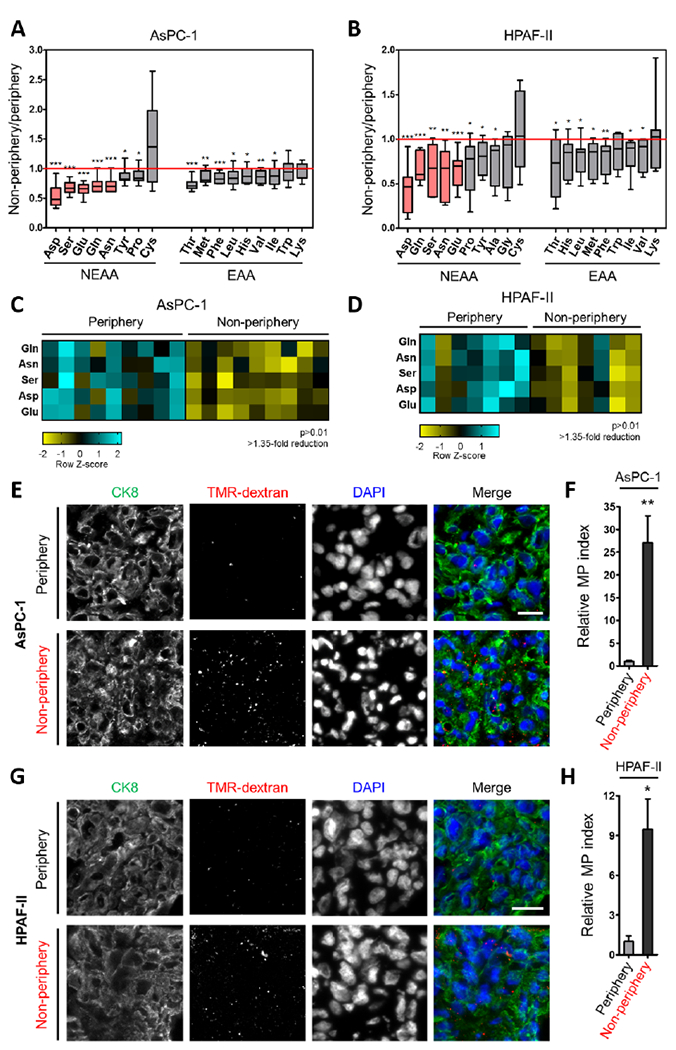
(A, B) Intratumoral amino acid levels in the non-peripheral regions relative to the periphery of xenograft tumors derived from AsPC-1 (n=9 tumors) or HPAF-II (n=7 tumors) cells. Data are expressed as box-and-whiskers plots. Horizontal lines represent median; boxes range from the 25th to 75th percentiles; vertical lines extend down to the 10th percentile and up to the 90th percentiles. NEAA, non-essential amino acids. EAA, essential amino acids.
(C, D) Heatmap profiles for intratumoral amino acids with >1.35-fold reduction and p>0.01.
(E, G) Representative images from sections of xenograft tumor tissue with macropinosomes labeled with TMR-dextran (red) and tumor cells immunostained with anti-CK8 (green). Nuclei are labeled with DAPI (blue). Scale bar, 20 μm.
(F, H) Quantification of macropinocytosis in xenograft tumor tissue. Error bars represent s.e.m. of n=5 tumors.
*p<0.05, **p<0.01, ***p<0.001 by unpaired two-tailed Student’s t-test. See also Figure S1.
Glutamine Depletion Specifically Stimulates Macropinocytosis in a Subset of PDAC Cells.
PDAC cancer cells are exquisitely sensitive to glutamine depletion, as they utilize glutamine as a major carbon and nitrogen source for their growth and glutamine is the most depleted amino acid in human PDAC tumors (Biancur et al., 2017; Cluntun et al., 2017; Hensley et al., 2013; Hosios et al., 2016; Hui et al., 2017; Kamphorst et al., 2015; Son et al., 2013); therefore, we tested the idea that glutamine deprivation could be mediating the observed enhancing effects on macropinocytosis. To determine whether starvation of glutamine has the ability to induce macropinocytosis, we treated human PDAC cells in vitro with media containing or devoid of glutamine. We found that cells starved of glutamine displayed increased levels of macropinocytosis relative to nutrient-replete control conditions (Figure 2A). Importantly, the observed stimulatory effects on uptake by glutamine starvation were independent of NEAAs, as the presence or absence of NEAAs failed to modulate macropinocytosis (Figure 2A). Dose-response assays indicated that macropinocytic induction was significantly stimulated by a range of sub-physiological glutamine concentrations (Figure S2A).
Figure 2. Glutamine deprivation stimulates macropinocytosis in a subset of PDAC cells.
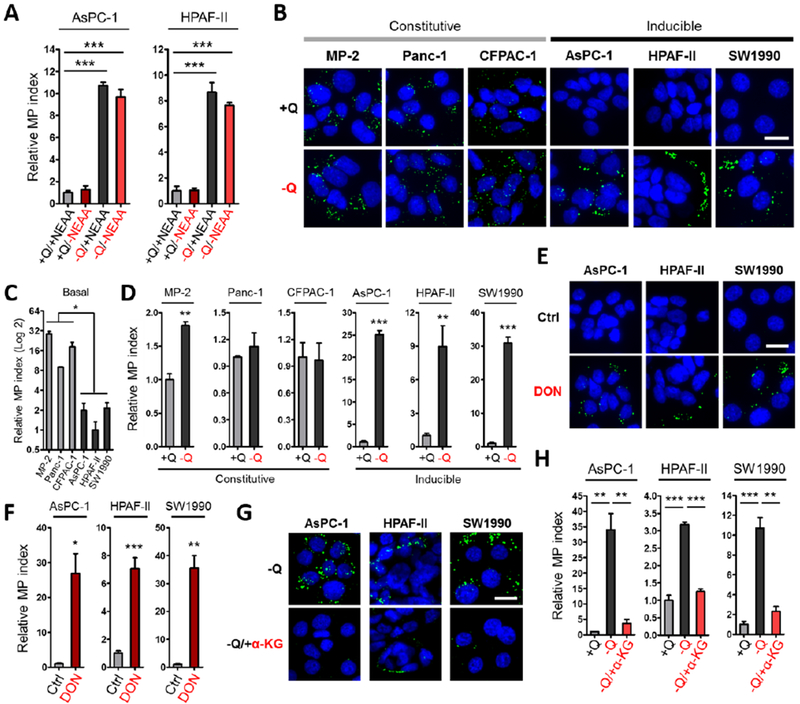
(A) Quantification of macropinocytosis in the indicated cells treated without or with deprivation of glutamine (+Q and −Q) or non-essential amino acids (+NEAA or −NEAA). Data are presented relative to the values obtained for the nutrient-replete condition (+Q/+NEAA).
(B) Representative images of macropinocytic uptake (FITC-dextran, green) in the indicated cell lines under glutamine-containing (+Q) or glutamine-free (−Q) conditions.
(C) Quantification of basal macropinocytosis under glutamine-containing conditions in the indicated cell lines. Data are presented relative to the values obtained for HPAF-II cells.
(D) Quantification of macropinocytosis under the conditions described in (B). Data are presented relative to the values obtained for the +Q condition.
(E) Representative images of macropinocytosis in the indicated cells treated without or with 6-diazo-5-oxo-L-norleucine (DON) in glutamine-containing media.
(F) Quantification of macropinocytosis under the conditions described in (E). Data are presented relative to the values obtained for the vehicle-only control condition.
(G) Representative images of macropinocytosis in the indicated cells treated without or with a cell-permeable form of α-ketoglutarate (α-KG) in glutamine-free media.
(H) Quantification of macropinocytosis in the indicated cells in glutamine-containing media and the conditions described in (G). Data are presented relative to the values obtained for the +Q condition.
All graphs are representative of at least 3 independent experiments. All error bars represent s.e.m. for n=3 replicates with at least 300 cells scored per condition. *p<0.05, **p<0.01, ***p<0.001 by unpaired two-tailed Student’s t-test. Ctrl, control; Q, glutamine. Scale bar, 20 μm. See also Figure S2.
To further explore the idea that the induction of macropinocytosis in response to nutrient scarcity might be specific to glutamine, we deprived PDAC cells of other nutrients and assessed the extent of uptake. In tumor cells, cystine through its conversion to cysteine, is critical to glutathione generation and recently, it was reported that glutamine dependence could be influenced by cystine levels via the cystine/glutamate antiporter (Muir et al., 2017). We found that depletion of cystine did not stimulate macropinocytosis, nor did cystine starvation modulate the ability of glutamine to control uptake (Figure S2B). Also, although leucine regulates cancer cell proliferation through its ability to activate mTORC1 and glutamine is used to import leucine via the SLC7A5 antiporter (Hara et al., 1998; Nicklin et al., 2009; Sancak et al., 2008), leucine starvation did not recapitulate the effects of glutamine deprivation on macropinocytosis (Figure S2C). Lastly, in addition to glutamine, glucose is a critical nutrient for cancer cells, but glucose starvation failed to appreciably induce macropinocytosis in PDAC cells (Figure S2D), further supporting the notion that the induction of macropinocytosis in response to nutrient deprivation is glutamine-specific.
To evaluate whether the stimulation of macropinocytosis by glutamine depletion is a general phenomenon occurring in PDAC cancer cells, we analyzed macropinocytic uptake in a panel of cell lines. We found that in cell lines that exhibited high levels of basal macropinocytosis, starvation of glutamine had little to no effect on macropinocytic activity, indicating that uptake in these cells is largely glutamine-independent and constitutive (Figures 2B–2D). In contrast, in cell lines that displayed low levels of basal macropinocytosis, glutamine deprivation strongly enhanced uptake, showing that macropinocytosis in these PDAC cells is inducible (Figures 2B–2D and S2E). To understand whether the observed effects on macropinocytosis were linked to glutamine metabolism, we treated PDAC cells with 6-diazo-5-oxo-L-norleucine (DON), a glutamine analogue that acts as a glutamine antagonist, broadly inhibiting glutamine-utilizing enzymes. In the presence of glutamine, DON treatment selectively caused a dramatic enhancement of macropinocytosis only in the inducible cells (Figures 2E, 2F, S2F and S2G). Consistent with the notion that constitutive macropinocytosis is independent of glutamine, we did not observe regional differences in macropinocytic uptake in xenograft tumors derived from MIA PaCa-2 cells, despite the fact that the tumors displayed depletion of glutamine and other NEAAs in non-peripheral regions (Figures S2H and S2I).
In cancer cells, glutamine contributes carbon to fuel the tricarboxylic acid (TCA) cycle via its conversion to glutamate, which is further converted to α-ketoglutarate (α-KG). To ascertain whether metabolites downstream of glutamine catabolism could reverse the macropinocytic response to glutamine starvation, we cultured inducible PDAC cells in glutamine-free media supplemented with cell-permeable forms of either glutamate or α-KG. Either exogenous glutamate or α-KG had the ability to rescue the elevated levels of macropinocytic uptake in response to limiting glutamine (Figures 2G, 2H, S2J and S2K). Moreover, administration of epigallocatechin gallate (EGCG), an inhibitor of glutamate dehydrogenase, under nutrient-replete conditions enhanced macropinocytosis (Figures S2L and S2M). Collectively, these data indicate that glutamine depletion regulates the degree of macropinocytosis in a subset of PDAC cells, and that this enhancement can be suppressed by glutaminolytic metabolites.
Glutamine Starvation Enhances Macropinocytosis through Potentiation of EGFR Signaling.
To gain a broad perspective on the impact of glutamine deprivation on the PDAC transcriptome and to pinpoint the mechanism driving macropinocytosis in response to nutrient stress, we performed RNA-Seq analyses in two inducible PDAC cell lines that were deprived of glutamine for 12 hours. There were 1,003 and 1,251 genes up- and down-regulated, respectively, in AsPC1 cells and 404 and 398 genes up- and down-regulated, respectively, in HPAF-II cells (Figure 3A, Tables S1 and S2). Gene set enrichment analysis (GSEA) revealed that EGF-induced genes were significantly upregulated in response to glutamine starvation (Figure 3B and Table S3). In accordance with this finding, several of the seven EGFR ligands were upregulated across multiple inducible PDAC cell lines upon glutamine withdrawal and induction of these ligands in response to glutamine deprivation was suppressed by the addition of exogenous glutamate or α-KG (Figures 3C, 3D and S3A–S3C). Because EGFR signaling plays an important role in stimulating macropinocytosis in other biological contexts (Brunk et al., 1976; West et al., 1989), we further explored the possibility that EGFR activation was driving macropinocytosis upon glutamine depletion. Indeed, we determined that EGFR was substantially activated in response to glutamine starvation, as measured by the extent of EGFR phosphorylation and the activation of downstream effector pathways, such as Erk and Akt, which were suppressed by EGFR inhibition (Figures 3E and S3D–S3F). Attenuation of EGFR signaling by either pharmacological inhibition or knockdown of EGFR resulted in the abrogation of glutamine depletion-induced macropinocytosis (Figures 3F–3J, S3G and S3H). Furthermore, EGFR ligands had the capacity to stimulate macropinocytosis in nutrient-replete media, with HB-EGF having the most profound effect on uptake and displaying significantly elevated expression levels in non-peripheral tumor regions relative to the periphery (Figures S3I and S3J). Similar to the findings we previously reported in PDAC cells with constitutive macropinocytosis (Commisso et al., 2013), inducible macropinocytosis drives the uptake and degradation of extracellular serum albumin, conferring a viability advantage to the cells when glutamine is limiting (Figures 3K and S3K). Importantly, EGFR knockdown in this context suppressed the viability advantage provided by serum albumin supplementation (Figure 3K). Altogether, these data indicate that in PDAC cells with inducible macropinocytosis, EGFR activation in response to glutamine depletion drives increased uptake to support PDAC cell survival when there is a paucity of nutrients.
Figure 3. Glutamine deprivation drives macropinocytosis through activation of EGFR signaling.
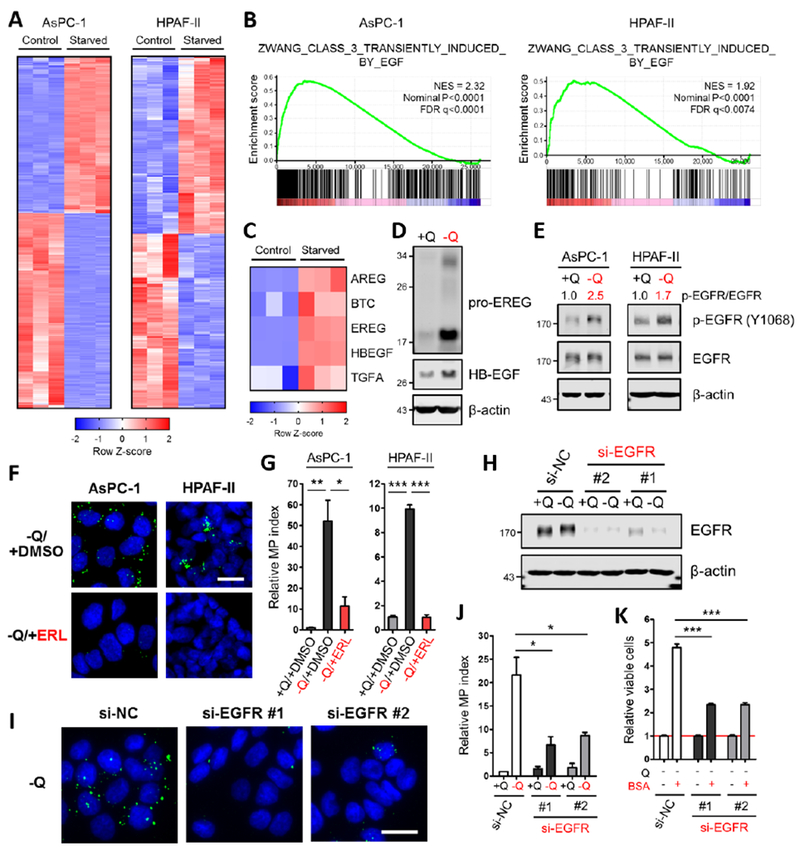
(A) Heatmap profiles of differential gene expression between control and glutamine-starved AsPC-1 or HPAF-II cells (in triplicate) from RNA-Seq data sets.
(B) Gene set enrichment analysis plots of glutamine-starved AsPC-1 or HPAF-II cells for EGF-induced genes. NES, normalized enrichment score; FDR, false discovery rate.
(C) Heatmap of differential expression of the indicated EGFR ligands between control and glutamine-starved AsPC-1 cells (in triplicate) from RNA-Seq data sets.
(D) Immunoblots assessing protein expression of EGFR ligands under glutamine-containing or glutamine-free conditions in AsPC-1 cells. β-actin was used as a loading control.
(E) Immunoblots assessing protein expression of EGFR and phospho-EGFR (p-EGFR) under glutamine-containing or glutamine-free conditions in AsPC-1 and HPAF-II cells. β-actin was used as a loading control. The p-EGFR/EGFR ratios are shown.
(F) Representative images of macropinocytotic uptake (green) in the indicated cells treated with vehicle (DMSO) or erlotinib (ERL) in glutamine-free media. Scale bar, 20 μm.
(G) Quantification of macropinocytosis in the indicated cells in glutamine-containing media and under the conditions described in (F). Data are presented relative to the values obtained for the +Q/+DMSO condition. Data are representative of at least 3 independent experiments. Error bars represent s.e.m. for n=3 replicates with at least 800 cells scored per condition.
(H) Immunoblots of EGFR expression in AsPC-1 cells transfected with a negative control siRNA (si-NC) or two independent siRNAs targeting EGFR (si-EGFR) under glutamine-containing or glutamine-free conditions. β-actin was used as a loading control.
(I) Representative images of macropinocytosis in AsPC-1 cells transfected with the indicated siRNA under glutamine-free conditions. Scale bar, 20 μm.
(J) Quantification of macropinocytosis in the indicated cells under the conditions described in (H). Data are presented relative to the values obtained for the +Q condition of si-NC cells. Error bars represent s.e.m. for n=3 independent experiments with at least 1,000 cells scored per condition.
(K) Viability as assessed by MTT assay of the indicated cells cultured in glutamine-free media without or with supplementation with 3% BSA after 5 days. Data are presented relative to the values obtained for each −Q condition (indicated by the red line). Data are representative of at least 3 independent experiments with error bars representing s.e.m. for n=3 replicates.
*p<0.05, **p<0.01, ***p<0.001 by unpaired two-tailed Student’s t-test. Q, glutamine. See also Figures S3 and Table S1–S3.
EGFR Signaling Driven by Glutamine Deprivation Stimulates Macropinocytosis Through Pak1.
EGFR signaling has the ability to boost macropinocytic capacity by modulating membrane ruffling and cytoskeletal dynamics through p21-activated kinase (Pak1) (Amstutz et al., 2008; Redelman-Sidi et al., 2013; Walsh and Bar-Sagi, 2001); therefore, we next investigated whether metabolic stress caused by glutamine deprivation has the capacity to activate Pak1. In PDAC cells with inducible macropinocytosis, we observed a marked increase in phosphorylated Pak1 in response to glutamine starvation, which was attenuated by EGFR inhibition (Figures 4A, 4B, S4A and S4B). In accordance with our finding that glutaminolytic metabolites rescue inducible macropinocytosis, supplementation of the media with cell-permeable glutamate or a-KG suppressed glutamine depletion-induced Pak1 activation (Figures S4C–S4F). To elucidate whether the observed increase in Pak1 activation has the ability to regulate nutrient stress-induced macropinocytosis, we starved PDAC cells of glutamine, treated with FRAX597, an inhibitor of Pak1, and assessed macropinocytic uptake. FRAX597 strongly attenuated inducible uptake when glutamine was limiting (Figures 4C, 4D and S4G–S4I). Although glutamine starvation induced the activation of other EGFR effector pathways, such as Akt and Erk (Figures S3E and S3F), inhibitors for these pathways failed to abrogate macropinocytosis (Figures S4J–S4N). PI3K signaling plays a well-documented role in macropinosome formation (Araki et al., 1996; Swanson, 2008; Yoshida et al., 2018) and in line with previous reports, PI3K inhibition blocked inducible macropinocytosis (Figures S4J–S4N).
Figure 4. EGFR signaling in response to glutamine depletion drives macropinocytosis via Pak1.
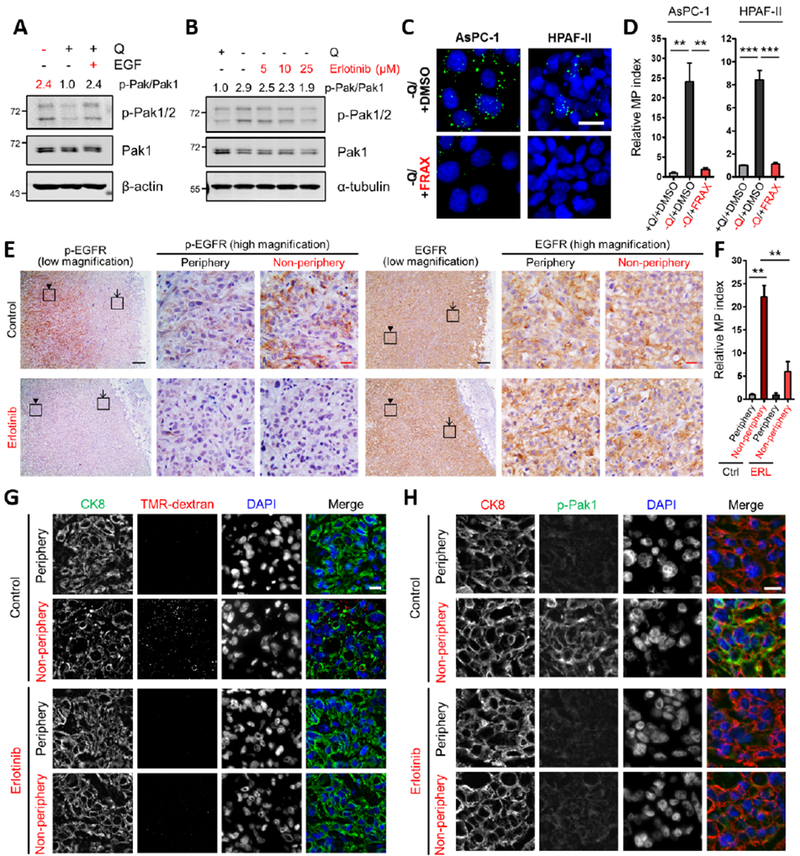
(A, B) Immunoblots assessing phosphorylation of Pak1/2 [p-Pak1 (S199/204)/p-Pak2 (S192/197)] in AsPC-1 cells under the indicated conditions. EGF treatment (A) was done at 100 ng/mL for 5 min. Erlotinib treatment (B) was done at the indicated concentrations for 2 hours. β-actin or α-tubulin was used as a loading control. The p-Pak/Pak1 ratios are shown.
(C) Representative images of macropinocytosis (green) in the indicated cells treated with vehicle (DMSO) or FRAX597 (FRAX) in glutamine-free media. Scale bar, 20 μm.
(D) Quantification of macropinocytosis in the indicated cells treated with DMSO in glutamine-containing media and under the conditions described in (C). Data are presented relative to the values obtained for the +Q/+DMSO condition and representative of at least 3 independent experiments. Error bars represent s.e.m. of n=3 replicates with at least 650 cells scored per condition.
(E) Immunohistochemical staining of p-EGFR and total EGFR protein expression in AsPC-1 xenograft tumors treated with vehicle control or erlotinib. The inset boxes in the low-magnification images indicate the areas shown in the high-magnification images. The arrows indicate the tumor peripheral regions, and the arrowheads indicate the tumor non-peripheral regions. Black scale bar, 200 μm; red scale bar, 20 μm.
(F) Quantification of macropinocytosis in AsPC-1 xenograft tumors treated with vehicle control (Ctrl) or erlotinib (ERL). Error bars represent s.e.m. of n=3 tumors.
(G) Representative images from sections of AsPC-1 xenograft tumors treated with vehicle control or erlotinib with macropinosomes labeled with TMR-dextran (red) and tumor cells immunostained with anti-CK8 (green). Nuclei are labeled with DAPI (blue). Scale bar, 20 μm.
(H) Immunofluorescence staining in AsPC-1 xenograft tumors treated with vehicle control or erlotinib. Tumor sections were stained with anti-CK8 (red), anti-p-Pak1 (green) and DAPI (blue). Scale bar, 20 μm.
**p<0.01, ***p<0.001 by unpaired two-tailed Student’s t-test. Q, glutamine. See also Figure S4.
To examine the role of EGFR in inducible macropinocytosis in vivo, we treated tumor-bearing mice with erlotinib and assessed uptake. Consistent with a role for amino acid depletion in EGFR activation, control tumors derived from AsPC-1 cells displayed increased levels of activated p-EGFR in the non-peripheral regions of the tumor relative to the periphery, while total EGFR levels were similar across the tumor (Figure 4E). As expected, EGFR activation was ablated by erlotinib treatment, as indicated by the reduction in p-EGFR staining (Figure 4E). Importantly, examination of macropinocytosis in these tumors revealed that erlotinib treatment significantly attenuated the uptake that is normally observed in the non-peripheral tumor regions (Figures 4F and 4G). Consistent with a role for Pak1 in the regulation of inducible macropinocytosis, we observed elevated levels of activated p-Pak1 selectively in the tumor non-periphery (Figures 4H, S4O and S4P). This heightening of p-Pak1 staining was diminished in erlotinib-treated tumors (Figures 4H and S4O). Total Pak1 expression was not appreciably altered by erlotinib treatment and did not vary in different regions of the tumors (Figure S4Q). Altogether, these data demonstrate that activation of EGFR and Pak1 coincide with regional amino acid deficiencies within PDAC tumors and that EGFR inhibition suppresses both Pak1 activation and inducible macropinocytosis in vivo.
EGFR/Pak1 Signaling Regulates Inducible, But Not Constitutive Macropinocytosis.
Constitutive macropinocytosis occurs independent of glutamine availability; therefore, we evaluated whether such uptake also transpires independent of EGFR or Pak1 signaling. Interestingly, EGFR inhibition did not block constitutive macropinocytosis (Figures 5A and 5B). Additionally, consistent with a selective role for EGFR in inducible uptake, EGF stimulation had the capacity to induce macropinocytosis under nutrient-replete conditions in inducible PDAC cells, but not in constitutive cells (Figures 5C and 5D). Similarly, Pak1 inhibition with FRAX597 did not attenuate constitutive macropinocytosis (Figures 5E and 5F). Our previous findings reported that constitutive macropinocytosis is dependent on KRAS expression (Commisso et al., 2013). To investigate whether inducible macropinocytosis similarly involves KRAS, we performed knockdown experiments and evaluated uptake upon glutamine depletion. KRAS knockdown led to the suppression of inducible macropinocytosis and a reduction in Pak1 activation (Figures S5A–S5D). These data suggest that while both constitutive and inducible macropinocytosis require KRAS, PDAC cells with constitutive uptake might be independent of EGFR/Pak activity due to an inability to initiate or potentiate a growth factor-mediated signal.
Figure 5. EGFR signaling dynamics in PDAC cells with inducible or constitutive macropinocytosis.
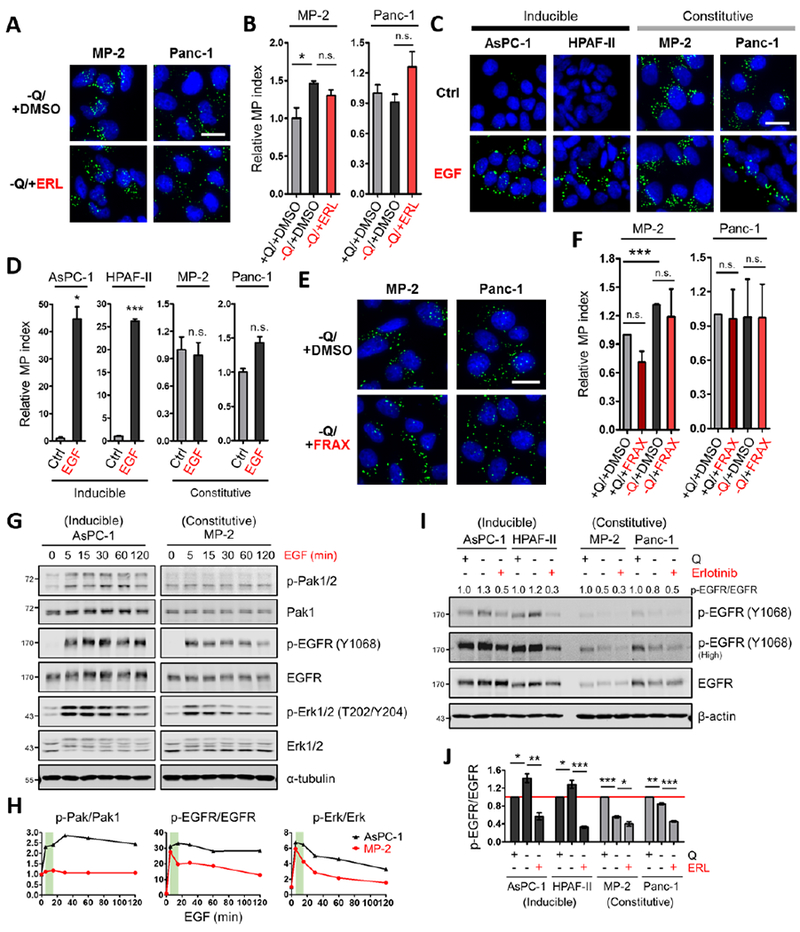
(A) Representative images of macropinocytotic uptake (green) in the indicated cells treated with vehicle (DMSO) or erlotinib (ERL) in glutamine-free media. Scale bar, 20 μm.
(B) Quantification of macropinocytosis in the indicated cells treated with DMSO in glutamine-containing media and under the conditions described in (A). Data are presented relative to the values obtained for the +Q/+DMSO condition. Data are representative of at least 3 independent experiments. Error bars represent s.e.m. for n=3 replicates with at least 300 cells scored per condition.
(C) Representative images of macropinocytotic uptake in the indicated cells treated without or with EGF (100 ng/mL, 5 min) in glutamine-containing media. Ctrl, control. Scale bar, 20 μm.
(D) Quantification of macropinocytosis under the conditions described in (C). Data are presented relative to the values obtained for the control condition.
(E) Representative images of macropinocytosis in the indicated cells treated with vehicle (DMSO) or FRAX597 (FRAX) in glutamine-free media.
(F) Quantification of macropinocytosis in the indicated cells treated with DMSO or FRAX597 in glutamine-containing media and under the conditions described in (E). Data are presented relative to the values obtained for the +Q/+DMSO condition. Error bars represent s.e.m. with at least 400 cells scored per condition.
(G) Immunoblots assessing phosphorylation of Pak1/2 [p-Pak1 (S199/204)/p-Pak2 (S192/197)], EGFR and Erk1/2 in the indicated cells treated with EGF (25 ng/mL) for the indicated time in glutamine-containing media. α-tubulin was used as a loading control. Results shown are representative of at least 3 independent experiments.
(H) Quantification of phosphoprotein/total protein ratios from the immunoblots in (G). Data are presented relative to the values obtained for each 0 time point (set as 1). The green areas highlight the changes of p-Pak1/2, p-EGFR and p-Erk1/2 from 5 to 15 min post EGF treatment.
(I) Representative immunoblots of EGFR phosphorylation in the indicated cells treated with vehicle (DMSO) or erlotinib (25 μM, 2 hours) in glutamine-containing or glutamine-free media. β-actin was used as a loading control. The p-EGFR/EGFR ratios are shown.
(J) Quantification of p-EGFR/EGFR ratios from immunoblots as described in (I). Data are presented relative to the values obtained for each +Q/-ERL condition (indicated by the red line). Error bars represent s.e.m. of n=3 independent experiments. ERL, erlotinib.
*p<0.05, **p<0.01, ***p<0.001 by unpaired two-tailed Student’s t-test. Q, glutamine; n.s., not significant. See also Figure S5.
To investigate the dynamics of EGFR signaling in the inducible versus constitutive setting, we treated PDAC cells with EGF and assessed pathway readouts at different time points. EGF stimulation had the capacity to increase the p-EGFR/EGFR ratio in all PDAC cells evaluated; however, EGFR activation in the cells with inducible macropinocytosis was sustained, while in the constitutive cells, EGFR activation dissipated rapidly (Figures 5G, 5H, S5E and S5F). Notably, the dynamics of activation of the EGFR effector Erk were consistent with these observations (Figures 5G, 5H, S5E and S5F). Interestingly, EGF-stimulated Pak activation was highest in inducible PDAC cells and these inducible cells had substantially higher levels of total Pak1 (Figures 5G, 5H and S5E–S5G). To investigate signaling in the context of glutamine depletion and to assess responsiveness to EGFR inhibition, we starved inducible and constitutive PDAC cells of glutamine and treated with erlotinib. In response to glutamine deprivation, EGFR activation was only detected in the inducible cell lines (Figures 5I and 5J). Erlotinib treatment suppressed glutamine-regulated EGFR activation in the inducible PDAC cells to below baseline, but in the constitutive cells p-EGFR levels were suppressed to a lesser extent (Figures 5I and 5J). It should be noted that increases in Erk and Pak activation upon glutamine depletion in the constitutive PDAC cells were not dependent on EGFR (Figures S5H and S5I). Altogether, these data indicate that EGFR/Pak signaling is selectively involved in orchestrating glutamine depletion-induced macropinocytosis, and that EGFR signaling dynamics vary between inducible and constitutive PDAC cells.
DISCUSSION
Our work demonstrates that the extent of macropinocytosis within PDAC tumors can be controlled by nutrient availability. Indeed, there is a recent appreciation for the range of metabolic heterogeneity that occurs within a tumor, both from the perspective of nutrient abundance and how tumor cells rewire to adapt to these regional nutrient variances (Hensley et al., 2016; Vander Heiden and DeBerardinis, 2017). Overall, our data reveal that when confronted with glutamine deficiency, a subset of PDAC cells have the ability to initiate macropinocytosis through the potentiation of EGFR/Pak signaling in order to compensate for the nutrient-poor conditions of the tumor microenvironment.
Our findings point to a critical role for glutamine in the modulation of macropinocytosis. The observed boost in macropinocytic capacity in response to glutamine deprivation was rescued by cell-permeable variants of both glutamate and α-KG. Mechanistically, we showed that supplementation with these glutaminolytic metabolites suppresses the transcriptional upregulation of the EGFR ligands upon glutamine withdrawal. We also demonstrated that inhibition of glutamate dehydrogenase, which is responsible for α-KG production, stimulates macropinocytosis. Altogether, these data suggest that the role of glutamine in replenishing TCA cycle intermediates, called anaplerosis, might be driving the observed macropinocytic induction. How the starved cells sense the diminishment of glutamine and how downstream glutaminolytic metabolites regulate EGFR ligand transcription remain an important area for further exploration. The mechanistic underpinnings that link nutrient availability and the EGFR pathway are unclear, but there are some examples of amino acid sensing pathways regulating EGFR ligands at the level of transcription. Gcn2 is a serine/threonine-protein kinase that detects amino acid scarcity by binding to uncharged tRNAs and controls cellular adaptations to nutrient deprivation through the phosphorylation of eIF2α. Activation of eIF2α leads to the preferential translation of ATF4, a master regulator of stress responses. Via overexpression studies, AREG was identified as an ATF4-responsive gene in human hepatoma cells (Maruyama et al., 2016). Interestingly, although AREG expression was also induced by ER stress, induction in this context was not dependent on ATF4 (Maruyama et al., 2016). mTORC1 is the hub of a complex signaling network that broadly regulates cell growth and metabolism through environmental cues stemming from growth factors and nutrients. The TSC1-TSC2 complex is a critical negative regulator of mTORC1 activity and there is evidence suggesting that TSC2 localizes to the nucleus and functions as a transcription factor (Pradhan et al., 2014). In TSC2 overexpressing cells, EREG was found to be the most downregulated gene and TSC2 was found to bind to the EREG promoter to negatively regulate expression. How the transcriptional activities of TSC2 relate to its function in suppressing mTORC1 activity remains to be elucidated. Further interrogation into the upstream amino acid sensing pathways that orchestrate the EGFR response leading to inducible macropinocytosis in PDAC is an important avenue for future research.
We demonstrate that a subset of PDAC cell lines exhibit nutrient-independent constitutive macropinocytosis, while another subset upregulates macropinocytosis in response to glutamine deprivation, defining a new, inducible form of this uptake pathway. We show that like its constitutive counterpart, inducible macropinocytosis is KRAS-dependent and functions to catabolize extracellular protein, supporting PDAC cell viability under conditions of nutrient limitation. Our work defines the ability to potentiate EGFR signaling as a differentiating factor between constitutive and inducible cell lines, but what genetic or phenotypic characteristics drive the dissimilarity between the macropinocytosis subclasses is uncertain. Collisson et al. defined three subtypes of PDAC based on transcriptional profiling and characterized their responses to erlotinib treatment (Collisson et al., 2011). The three subtypes that were defined are classical, quasimesenchymal and exocrine-like. For the various subtypes, KRAS-dependency was scrutinized, together with sensitivity to erlotinib. Several of the PDAC cell lines utilized in our study were also used in Collisson et al. (HPAF-II, CFPAC-1, SW1990, Panc-1 and MIA PaCa-2) and based on their analyses, there is no correlation between our “constitutive” and “inducible” macropinocytosis classifications and any of these PDAC subtypes nor with KRAS-dependency or erlotinib sensitivity. Whether our macropinocytosis classes overlap with other, more recently described PDAC subtypes remains to be determined (Daemen et al., 2015; Moffitt et al., 2015). Additionally, all the PDAC cell lines we interrogated in our study are known to harbor oncogenic KRAS mutations, but no clear correlation exists between the mode of macropinocytosis and KRAS mutational status. Further research is required to assess the mechanisms underlying why some PDAC cells are responsive to glutamine to propel their macropinocytosis whereas others are not.
In PDAC cancer cells with inducible macropinocytosis, we delineate how EGFR signaling acts through Pak to instigate macropinocytic induction in response to glutamine starvation. Relative to cells with constitutive macropinocytosis, we find that inducible cells display much higher levels of total Pak1 and that Pak activation in response to EGF stimulation was highest in inducible cells. These findings raise the possibility that total Pak protein expression levels or the extent of Pak activation could represent a molecular marker associated with macropinocytic phenotypes. Moreover, the low Pak expression levels detected in the constitutive cell lines might serve as a predictive indicator that EGFR inhibition would fail to suppress macropinocytosis. These observations could have implications to patient selection strategies in the clinical treatment of PDAC. EGFR signaling has been previously shown to play an important role in the development of PDAC (Ardito et al., 2012; Navas et al., 2012), and although EGFR inhibitors have only been of marginal clinical benefit, improving patient selection strategies and/or targeting sensitization or resistance mechanisms in PDAC may still hold some promise (Chiramel et al., 2017; Hao et al., 2016; Ioannou et al., 2016; Jang et al., 2017; Mathew et al., 2015). Interestingly, Pak inhibitors have been shown to synergize with chemotherapy in mouse models of PDAC and our findings suggest that an added benefit to Pak-targeting therapies, at least in a subset of tumors, could be the inhibition of macropinocytosis (Jagadeeshan et al., 2016; Radu et al., 2014; Yeo et al., 2016). Overall, our data underscore the idea that it would be beneficial to consider tumor heterogeneity as we develop approaches to therapeutically target macropinocytosis in cancer, and since macropinocytosis has been implicated in a plethora of oncological malignancies (Commisso, 2019; Kim et al., 2018; Seguin et al., 2017), examining the molecular nuances of this nutrient uptake mechanism has the potential to impact PDAC and many other cancers.
STAR METHODS
Contact for reagent and resource sharing
Further information and requests for resources and reagents may be directed to and will be fulfilled by the Lead Contact, Cosimo Commisso (ccommisso@sbpdiscovery.org).
Experimental model and subject details
Cells
All cell lines were obtained from American Type Culture Collection (ATCC), maintained in 100 units/mL penicillin/streptomycin under 5% CO2 at 37°C and routinely tested for mycoplasma contamination using ABM’s PCR Mycoplasma Detection Kit. Cells were cultured in the following media: AsPC-1 (female) and HPAF-II (male) in RPMI (Corning) supplemented with 10% fetal bovine serum (FBS) and 1 mM sodium pyruvate; SW1990 (male), MIA PaCa-2 (MP-2; male) and Panc-1 (male) in DMEM (Corning) with 10% FBS; CFPAC-1 (male) in IMDM (Sigma) with 10% FBS. All cell lines in this study have been authenticated via short tandem repeat fingerprinting.
Mice
Female nude mice (Foxn1nu/Foxn1nu) between 6 and 8 weeks of age were purchased from Taconic or Jackson Lab. Female nude mice were used in the xenograft experiments due to their lower aggressiveness relative to that of male nude mice. All animals were housed in sterile caging and maintained under pathogen-free conditions. All animal handling and experimental procedures conformed to institutional guidelines and were approved by the SBP Medical Discovery Institute Institutional Animal Care and Use Committee.
Method details
Nutrient Deprivation
All nutrient deprivation experiments were performed in the absence of serum for 24 hours, unless otherwise indicated. Cells were plated in complete culture media, which was exchanged with nutrient-deprived media (described below) 1–3 days after cell seeding. Nutrient-deprived media was not changed throughout the course of the experiments, unless otherwise indicated. For non-essential amino acid deprivation experiments, MEM medium without glutamine (Sigma) was used, and 1X MEM non-essential amino acids (Sigma) and/or 4 mM glutamine (Corning) were added for the corresponding controls. For cystine deprivation experiments, DMEM medium without methionine, cystine and glutamine (Sigma) was used, and 0.030 g/L methionine (Sigma), 0.063 g/L cystine (Sigma) and/or 4 mM glutamine were added for the corresponding controls. For glutamine deprivation experiments, glutamine-free RPMI (Corning), glutamine-free DMEM (Corning) or glutamine-free IMDM (Sigma) was used. For leucine deprivation experiments, leucine-free RPMI (Crystalgen) or leucine-free DMEM (Crystalgen) was used. For glucose deprivation experiments, glucose-free RPMI (Crystalgen) or glucose-free DMEM (Corning) was used. In Figures S3D, S4A and S4B, SW1990 cells were starved of glutamine in the presence of dialyzed FBS for 24 hours (S4A and S4B) or 48 hours (S3D).
Chemical Treatments
Treatment with 6-diazo-5-oxo-L-norleucine (DON) (2 mM), dimethyl α-ketoglutarate (DM-α-KG) (7 mM), dimethyl DL-glutamate (DM-Glu) (15 mM), epigallocatechin gallate (EGCG) (5 μM or 10 μM) was done for 24 hours under glutamine-replete or glutamine-free conditions. Treatment with erlotinib (25 μM, unless otherwise indicated) or FRAX597 (1 μM) was done for 2 hours by directly adding to the media. Treatment with EGF, HB-EGF, EREG or AREG was done by adding directly to the media.
In vitro Macropinocytosis Assay
Cells were plated onto glass coverslips for 2–3 days and then subjected to serum starvation with or without nutrient deprivation for 24 hours. Macropinosomes were assayed as previously described and as outlined below (Commisso et al., 2014; Galenkamp et al., 2019). 70-kDa FITC-dextran or TMR-dextran (Thermo Fisher Scientific) were added directly to the culture media at a final concentration of 1 mg/mL with no medium replacement. After incubation for 30 minutes at 37°C, cells were rinsed five times on ice with ice-cold PBS and then fixed in 3.7% formaldehyde. Following DAPI staining for nuclei, coverslips were mounted onto glass slides using Dako mounting medium (Agilent Tech). Images were captured at 40X magnification using the EVOS FL Cell Imaging System (Thermo Fisher Scientific) and analyzed using ImageJ software (NIH). The ‘Smooth’ feature in ImageJ was employed after background subtraction and before threshold adjustments. The number of labeled macropinosomes was determined using the ‘Analyze Particles’ feature in ImageJ, and the macropinocytic (MP) index was computed by the total particle area per cell.
Immunoblotting
Cells were lysed in RIPA buffer (10mM Tris-HCl [pH 8.0], 150mM NaCl, 1% sodium deoxycholate, 0.1% SDS, 1% Triton X-100) with protease and phosphatase inhibitors (Roche). Protein concentrations were measured using the DC Protein Assay Kit (Bio-Rad). SDS–PAGE and protein transfer were performed using Mini Gel Tank and Mini Blot Module (Life Technologies). Immunoblotting was detected using near-infrared fluorescence (LI-COR) and the Odyssey CLx imager (LI-COR). Quantitative analysis of immunoblots was performed using Image Studio Lite software (LI-COR). The following primary antibodies were used: EREG (1:1000) [Cell Signaling Technologies (CST), 12048], HB-EGF (1:10000) (Abcam, ab185555), p-EGFR (Y1068) (1:1000) (CST, 3777), EGFR (1:1000) (CST, 4267), p-PAK1 (S199/204)/p-PAK2 (S192/197) (1:500) (CST, 2605), PAK1 (1:300) (Santa Cruz, sc-882), p-Erk1/2 (T202/Y204) (1:2000) (CST, 4370), Erk1/2 (1:1000) (CST, 4695), p-Akt (S473) (1:1500) (CST, 4060), pan-Akt (1:1000) (CST, 4691), α-tubulin (1:10000) (Sigma, T6074), and β-actin (1:20000) (Sigma, A1978). To analyze phosphorylation of proteins, membranes were probed with phospho-specific antibodies first, stripped with NewBlot IR Stripping Buffer (LI-COR) and then reprobed with pan antibodies.
RNA-Seq and qRT–PCR
Total RNA was isolated from cells using the PureLink RNA Mini Kit (Thermo Fisher Scientific). RNA-Seq was performed by the Sanford Burnham Prebys Genomics Core. Poly(A) RNA was isolated using the NEBNext Poly(A) mRNA Magnetic Isolation Module (NEB) and barcoded libraries were made using the NEBNext Ultra II Directional RNA Library Prep Kit for Illumina (NEB). Libraries were pooled and single-end sequenced (1x75 bp) on the Illumina NextSeq 500 using the High-Output V2 Kit (Illumina). Read data was processed in BaseSpace, and reads were aligned to Homo sapiens genome (hg19) using STAR aligner with default settings. Differential transcript expression was determined using the Cufflinks Cuffdiff package. For quantitative real-time PCR (qRT–PCR), cDNA was synthesized from total RNA using the High-Capacity cDNA Reverse Transcription Kit (Thermo Fisher Scientific). cDNA samples were then subjected to real-time PCR quantification in triplicate with SYBR Premix Ex Taq II master mix (Takara) on the LightCycler 96 Instrument (Roche). The primer sequences (human) used for qRT–PCR are listed in the Key Resources Table.
KEY RESOURCES TABLE
| REAGENT or RESOURCE | SOURCE | IDENTIFIER |
|---|---|---|
| Antibodies | ||
| Rat monoclonal anti-cytokeratin 8 (CK8) | Developmental Studies Hybridoma Bank | TROMA-I |
| Rabbit monoclonal anti-EREG | Cell Signaling Technology | Cat#12048S |
| Rabbit monoclonal anti-HBEGF | Abcam | Cat#ab185555 |
| Mouse monoclonal anti-β-actin | Sigma-Aldrich | Cat#A1978 |
| Rabbit monoclonal anti-phospho-EGFR (Tyr1068) | Cell Signaling Technology | Cat#3777S |
| Rabbit monoclonal anti-EGFR | Cell Signaling Technology | Cat#4267S |
| Rabbit monoclonal anti-phospho-Akt (Ser473) | Cell Signaling Technology | Cat#4060S |
| Rabbit monoclonal anti-Akt (pan) | Cell Signaling Technology | Cat#4691S |
| Rabbit monoclonal anti-phospho-Erk1/2 (Thr202/Tyr204) | Cell Signaling Technology | Cat#4370S |
| Rabbit monoclonal anti-Erk1/2 | Cell Signaling Technology | Cat#4695S |
| Rabbit polyclonal anti-phospho-PAK1 (Ser199/204)/ PAK2 (Ser192/197) | Cell Signaling Technology | Cat#2605S |
| Rabbit polyclonal anti-αPAK (PAK1) | Santa Cruz Biotechnology | Cat#sc-882 |
| Mouse monoclonal anti-α-tubulin | Sigma-Aldrich | Cat#T6074 |
| Rabbit polyclonal anti-phospho-PAK1 (Ser144)/ PAK2 (Ser141) | Cell Signaling Technology | Cat#2606S |
| Mouse monoclonal anti-K-Ras | Santa Cruz Biotechnology | Cat#sc-30 |
| Goat anti-rat IgG (H+L), Alexa Fluor 488 | Thermo Fisher Scientific | Cat#A-11006 |
| Goat anti-rat IgG (H+L), Alexa Fluor 555 | Thermo Fisher Scientific | Cat#A-21434 |
| Goat anti-rabbit IgG (H+L), Alexa Fluor 488 | Thermo Fisher Scientific | Cat#A-11008 |
| IRDye 800CW goat anti-rabbit IgG | LI-COR | Cat#926-32211 |
| IRDye 680RD goat anti-mouse IgG | LI-COR | Cat#926-68070 |
| Chemicals, Peptides, and Recombinant Proteins | ||
| TMR-dextran, 10-kDa | Thermo Fisher Scientific | Cat#D1817 |
| DAPI | Millipore | Cat#5.08741.0001 |
| FITC-dextran, 70-kDa | Thermo Fisher Scientific | Cat#D1822 |
| TMR-dextran, 70-kDa | Thermo Fisher Scientific | Cat#D1819 |
| 6-diazo-5-oxo-L-norleucine (DON) | Sigma-Aldrich | Cat#D2141 |
| Dimethyl α-ketoglutarate (DM-α-KG) | Sigma-Aldrich | Cat#349631 |
| Dimethyl DL-glutamate (DM-Glu) | Cayman Chemical | Cat#18602 |
| Epigallocatechin gallate (EGCG) | Cayman Chemical | Cat#70935 |
| Erlotinib | AK Scientific | Cat#NC0616959 |
| Erlotinib | Sigma-Aldrich | Cat#SML2156 |
| Erlotinib | LC Laboratories | Cat#E-4007 |
| Bovine serum albumin (BSA), fatty acid-free, nuclease- and protease-free | Millipore | Cat#126609 |
| Thiazolyl Blue Tetrazolium Blue (MTT) | Sigma-Aldrich | Cat#M5655 |
| Human HB-EGF | Sigma-Aldrich | Cat#SRP3052 |
| Human epiregulin (EREG) | R&D Systems | Cat#1195-EP-025/CF |
| Human amphiregulin (AREG) | R&D Systems | Cat#262-AR-100/CF |
| DQ red BSA | Thermo Fisher Scientific | Cat#D12051 |
| Human EGF | Sigma-Aldrich | Cat#E9644 |
| FRAX597 | Selleck Chemical | Cat#S7271 |
| MK-2206 | Enzo Life Sciences | Cat#ENZ-CHM164-0005 |
| SCH772984 | Chemietek | Cat#CT-SCH772 |
| LY294002 | Cell Signaling Technology | Cat#9901S |
| Critical Commercial Assays | ||
| Tissue-Tek O.C.T. Compound, Sakura Finetek | VWR | Cat#25608-930 |
| Dako Fluorescence Mounting Medium | Agilent Tech | Cat#S302380-2 |
| PureLink RNA Mini Kit | Thermo Fisher Scientific | Cat#12183025 |
| High Capacity cDNA Reverse Transcription Kit | Thermo Fisher Scientific | Cat#4368814 |
| SYBR Premix Ex Taq II (Tli RNaseH Plus) | TaKaRa | Cat#RR820L |
| DC Protein Assay Kit | Bio-Rad | Cat#5000112 |
| NewBlot IR Stripping Buffer, 5X | LI-COR | Cat#928-40028 |
| Lipofectamine RNAiMAX Transfection Reagent | Thermo Fisher Scientific | Cat#13778100 |
| VECTASTAIN Elite ABC HRP Kit | Vector Laboratories | Cat#PK-6100 |
| DAB HRP Substrate Kit | Vector Laboratories | Cat#PK-4100 |
| Experimental Models: Cell Lines | ||
| AsPC-1 | ATCC | ATCC CRL-1682 |
| HPAF-II | ATCC | ATCC CRL-1997 |
| SW1990 | ATCC | ATCC CRL-2172 |
| MIA PaCa-2 (MP-2) | ATCC | ATCC CRL-1420 |
| Panc-1 | ATCC | ATCC CRL-1469 |
| CFPAC-1 | ATCC | ATCC CRL-1918 |
| Experimental Models: Organisms/Strains | ||
| Mouse: NCr nude, sp/sp, CrTac:NCr-Foxn1nu | Taconic | Cat#NCRNU-F |
| Mouse: Foxn1nu/Foxn1nu | Jackson Lab | Cat#002019 |
| Oligonucleotides | ||
| AREG Forward: 5′-CGGGAGCCGACTATGACTAC-3′ Reverse: 5′-TCACTTTCCGTCTTGTTTTGG-3′ |
This paper | N/A |
| BTC Forward: 5′-AGAGCGGGGTTGATGGAC-3′ Reverse: 5′-ATCTGCCACCACACAGTGAA-3′ |
This paper | N/A |
| EGF Forward: 5′-GTACTCTCGCAGGAAATGGG-3′ Reverse: 5′-TCCACCACCAATTGCTCATA-3′ |
This paper | N/A |
| EPGN Forward: 5′-ACTACAGGAAATGGCTTTGGG-3′ Reverse: 5′-GGCTATGGGTCCTTCTATGTTG-3′ |
This paper | N/A |
| EREG Forward: 5′-AGGAGGATGGAGATGCTCTG-3′ Reverse: 5′-CACAGTTGTACTGAGGACTGCC-3′ |
This paper | N/A |
| HBEGF Forward: 5′-GGACCCATGTCTTCGGAAAT-3′ Reverse: 5′-CCCATGACACCTCTCTCCAT-3′ |
This paper | N/A |
| TGFA Forward: 5′-CCTGTTCGCTCTGGGTATTG-3′ Reverse: 5′-ACTGAGTGTGGGAATCTGGG-3′ |
This paper | N/A |
| 18S rRNA Forward: 5′-GTAACCCGTTGAACCCCATT-3′ Reverse: 5′-CCATCCAATCGGTAGTAGCG-3′ |
This paper | N/A |
| Silencer Select Negative Control No. 1 siRNA | Thermo Fisher Scientific | Cat#4390843 |
| Silencer Select EGFR siRNA #1 | Thermo Fisher Scientific | ID#s563 |
| Silencer Select EGFR siRNA #2 | Thermo Fisher Scientific | ID#s565 |
| Silencer Select KRAS siRNA #1 | Thermo Fisher Scientific | ID#s7939 |
| Silencer Select KRAS siRNA #2 | Thermo Fisher Scientific | ID#s7940 |
| Software and Algorithms | ||
| ImageJ software | NIH | https://imagej.nih.gov/ij/ |
| GraphPad Prism 8 software | GraphPad | https://www.graphpad.com/ |
| Image Studio Lite software | LI-COR | https://www.licor.com/bio/ |
siRNA Transfection
Lipofectamine RNAiMAX Transfection Reagent (Thermo Fisher Scientific) was used with a final siRNA concentration of 25 nM according to the manufacturer’s protocol. 24 hours after the second transfection, the transfected cells were trypsinized and plated for experiments. The negative control siRNA and siRNAs targeting EGFR and KRAS are listed in the Key Resources Table.
Cell Viability Assays
Cells were seeded in complete culture media at a density of 10,000–15,000 cells per well in a 96-well plate. 24–48 hours after seeding, cells were rinsed once with PBS and incubated in glutamine-free RPMI without or with supplemented with 3% fatty acid-free, nuclease- and protease-free BSA (Millipore) in the presence of 10% dialyzed FBS. The media was refreshed every other day. Relative viable cell counts were determined by the MTT assay.
Tumor Xenograft Studies
One or two million cells resuspended in 50% Matrigel (Corning) were injected subcutaneously into the flanks of female nude mice (Taconic or Jackson Lab), aged 6–8 weeks. Tumors were isolated when attained a volume of 500–800 mm3 and portions of the tumor tissue were used for subsequent analyses. For detection and quantitative analysis of macropinocytosis in tumors, the ex vivo labeling method was employed in freshly isolated tumor tissue. The procedures of ex vivo labeling of macropinosomes in tumor specimens were performed as previously described and as outlined below (Kamphorst et al., 2015; Lee et al., 2019). Freshly cut cross-section slices of tumors were subjected to multiple-site injection and subsequent immersion with 2 mg of 10-kDa TMR-dextran (Thermo Fisher Scientific) in a volume of 400 μL, ensuring equal exposure of the fluorescently-labeled dextran molecules across the different regions of the tumor. After incubation for 15 minutes at room temperature, the tumor sections were rinsed three times in PBS and rapidly frozen in Tissue-Tek O.C.T. Compound. To detect and quantify macropinosomes in tumors, the frozen tumor samples were processed and macropinocytosis was quantified as previously described and as outlined below (Commisso et al., 2014; Lee et al., 2019). Frozen tumor sections were subjected to immunofluorescence staining with anti-CK8 without permeabilization. Frozen sections of tumor tissue on glass slides were rinsed in PBS prior to fixation to minimize trapped dextran within the tissue and reduce nonspecific background caused by the fluorescent dextran. CK8-positive tumor cells that abutted the xenograft sheath cells (CK8-negative) surrounding the tumor were defined as peripheral for microscopic analysis as shown in Figure S1C. Images were captured at 40X magnification using the EVOS FL Cell Imaging System (Thermo Fisher Scientific) for the ‘peripheral’ and ‘non-peripheral’ regions and analyzed using ImageJ software (NIH). The total area of macropinosomes was determined as aforementioned and the macropinocytic (MP) index was calculated by dividing the total area of macropinosomes with the total area of tumor which is determined by CK8 expression. For metabolite extraction, pieces of tumor tissues from peripheral or non-peripheral regions were freshly cut and snap-frozen in liquid nitrogen. For erlotinib treatment, once xenograft tumors grew to a volume of 500–800 mm3, the mice were randomly divided into two groups. One group received erlotinib treatment (daily, 50 mg/kg) by oral gavage for 5 days, and the other group received treatment with vehicle control (PBS with 0.5% methylcellulose and 0.1% Tween 80) (Ardito et al., 2012). On the last day of treatment, the tumors were collected for subsequent experiments as described above.
Metabolite Extraction and GC–MS
Tumor samples (15–30 mg) were transferred to 2-mL round-bottom tubes (Qiagen) with the addition of 5-mm stainless steel beads (Qiagen) and ice-cold 50% methanol/ 20 μM L-norvaline in a volume of 450 μL. Tubes were shaken at the maximum speed for 2 minutes using the Tissuelyser (Qiagen), vortexed, and placed on dry ice for 30 minutes. After thawing on ice, samples were centrifuged at 15,000 xg for 10 minutes at 4°C. The supernatant was then transferred to a new tube, mixed (vortexed) with chloroform (220 μL), and centrifuged at 15,000 xg for 15 minutes at 4°C. The top layer was dried using a Speedvac, derivatized and analyzed using gas chromatography–mass spectrometry (GC–MS) to quantify small polar metabolites as previously described (Ratnikov et al., 2015).
Immunofluorescence
Frozen sections of xenograft tumors on glass slides or cells seeded on glass coverslips were fixed in 4% paraformaldehyde for 15 minutes and then permeabilized with 0.2% Triton X-100 for 10–15 minutes at room temperature. Non-specific signals were blocked using 2% BSA and 5% goat serum in PBS. The following primary antibodies were used: p-PAK1 (Ser144)/p-PAK2 (Ser141) (1:100) (CST, 2606), PAK1 (1:50) (Santa Cruz, sc-882), and CK8 (1:1000) (DSHB, TROMA-I). After overnight incubation with primary antibodies at 4°C, the tumor samples or the cells were washed and incubated with fluorescence-conjugated secondary antibodies (Thermo Fisher Scientific) and DAPI (Millipore). The slides or the coverslips were then washed and mounted with Dako mounting medium. Images were captured using the EVOS FL Cell Imaging System (Thermo Fisher Scientific). To visualize macropinosomes labeled by TMR-dextran in tumor tissues, frozen tumor specimens were immunostained with anti-CK8 without permeabilization.
Immunohistochemistry
Xenograft tumors were fixed in 10% formalin and embedded in paraffin in accordance with standard procedures. Sections of paraffin-embedded xenograft tumors on glass slides were deparaffinized and rehydrated, and heat-induced antigen retrieval was done in Tris-EDTA buffer (10 mM Tris base, 1 mM EDTA, 0.05% Tween 20, pH 9.0) using a microwave. Tissue/cells were then permeabilized with 0.2% Tween 20 in PBS for 10 minutes and blocked with 1.5% BSA and 10% goat serum in TBS for 1 hour at room temperature. Primary antibody incubation was performed at 4°C overnight in 1.5% BSA/TBS-T (0.1% Tween 20). The following primary antibodies were used: p-EGFR (Y1068) (1:100) (CST, 3777) and EGFR (1:100) (CST, 4267). Afterwards, sections were washed with TBS-T three times, and the endogenous peroxidase activity was quenched by incubation with 3% hydrogen peroxide in TBS for 10 minutes. After washed, sections were incubated with biotinylated goat anti-rabbit secondary antibody (Vector Labs, BA-1000) for 2 hours in 1.5% BSA/TBS-T at room temperature. Then detection was done using the VECTASTAIN Elite ABC HRP Kit (Vector Labs) and the DAB HRP Substrate Kit (Vector Labs). For nuclear counterstaining, sections were stained with hematoxylin. Following dehydration, the slides were mounted with coverslips and Permount mounting medium (Fisher Scientific). Images were captured using a brightfield microscope installed with INFINITY camera (Lumenera).
Quantification and statistical analysis
All graphs were made using GraphPad Prism software (GraphPad). At least three independent experiments were performed in all cases, unless otherwise indicated. Results are shown as means; error bars represent standard error of the mean (s.e.m.) except for qRT–PCR experiments where data are presented as mean ± standard deviation (s.d.). All statistical significance was determined by the unpaired two-tailed Student’s t-test, and p values less than 0.05 were considered statistically significant (*p<0.05, **p<0.01, ***p<0.001).
Supplementary Material
Table S1. List of Genes that are Regulated by Glutamine Starvation in AsPC-1 Cells, Related to Figure 3.
Table S2. List of Genes that are Regulated by Glutamine Starvation in HPAF-II Cells, Related to Figure 3.
Highlights.
Enhanced macropinocytosis coincides with amino acid deficiency in PDAC tumors
Glutamine depletion specifically induces macropinocytosis in a subset of PDAC cells
Glutamine starvation enhances macropinocytosis via activation of EGFR/Pak signaling
EGFR/Pak signaling regulates inducible, but not constitutive macropinocytosis
ACKNOWLEDGEMENTS
We are grateful to members of the Commisso laboratory for their helpful comments and discussions. This work was supported by NIH grant R01CA207189 to C.C. We thank Dr. David Scott and the Sanford Burnham Prebys Cancer Metabolism Core for performing the tumor metabolite experiments. We thank Dr. Brian James and the Sanford Burnham Prebys Genomics Core for performing the RNA-Seq experiments. Sanford Burnham Prebys core services are supported by NCI Cancer Center Support Grant P30CA030199. The graphical abstract for this article was in part created using BioRender.
Footnotes
Publisher's Disclaimer: This is a PDF file of an unedited manuscript that has been accepted for publication. As a service to our customers we are providing this early version of the manuscript. The manuscript will undergo copyediting, typesetting, and review of the resulting proof before it is published in its final citable form. Please note that during the production process errors may be discovered which could affect the content, and all legal disclaimers that apply to the journal pertain.
DECLARATION OF INTERESTS
C.C. is an inventor on a published patent application entitled “Cancer diagnostics, therapeutics, and drug discovery associated with macropinocytosis,” Pub. No.: US 2018/0335420 A1.
REFERENCES
- Amstutz B, Gastaldelli M, Kalin S, Imelli N, Boucke K, Wandeler E, Mercer J, Hemmi S, and Greber UF (2008). Subversion of CtBP1-controlled macropinocytosis by human adenovirus serotype 3. Embo J 27, 956–969. [DOI] [PMC free article] [PubMed] [Google Scholar]
- Araki N, Johnson MT, and Swanson JA (1996). A role for phosphoinositide 3-kinase in the completion of macropinocytosis and phagocytosis by macrophages. J Cell Biol 135, 1249–1260. [DOI] [PMC free article] [PubMed] [Google Scholar]
- Ardito CM, Gruner BM, Takeuchi KK, Lubeseder-Martellato C, Teichmann N, Mazur PK, Delgiorno KE, Carpenter ES, Halbrook CJ, Hall JC, et al. (2012). EGF receptor is required for KRAS-induced pancreatic tumorigenesis. Cancer Cell 22, 304–317. [DOI] [PMC free article] [PubMed] [Google Scholar]
- Biancur DE, Paulo JA, Malachowska B, Quiles Del Rey M, Sousa CM, Wang X, Sohn ASW, Chu GC, Gygi SP, Harper JW, et al. (2017). Compensatory metabolic networks in pancreatic cancers upon perturbation of glutamine metabolism. Nat Commun 8, 15965. [DOI] [PMC free article] [PubMed] [Google Scholar]
- Brunk U, Schellens J, and Westermark B (1976). Influence of epidermal growth factor (EGF) on ruffling activity, pinocytosis and proliferation of cultivated human glia cells. Exp Cell Res 103, 295–302. [DOI] [PubMed] [Google Scholar]
- Chiramel J, Backen AC, Pihlak R, Lamarca A, Frizziero M, Tariq NU, Hubner RA, Valle JW, Amir E, and McNamara MG (2017). Targeting the Epidermal Growth Factor Receptor in Addition to Chemotherapy in Patients with Advanced Pancreatic Cancer: A Systematic Review and Meta-Analysis. Int J Mol Sci 18. [DOI] [PMC free article] [PubMed] [Google Scholar]
- Cluntun AA, Lukey MJ, Cerione RA, and Locasale JW (2017). Glutamine Metabolism in Cancer: Understanding the Heterogeneity. Trends Cancer 3, 169–180. [DOI] [PMC free article] [PubMed] [Google Scholar]
- Collisson EA, Sadanandam A, Olson P, Gibb WJ, Truitt M, Gu S, Cooc J, Weinkle J, Kim GE, Jakkula L, et al. (2011). Subtypes of pancreatic ductal adenocarcinoma and their differing responses to therapy. Nat Med 17, 500–503. [DOI] [PMC free article] [PubMed] [Google Scholar]
- Commisso C (2019). The pervasiveness of macropinocytosis in oncological malignancies. Philosophical Transactions of the Royal Society B: Biological Sciences 374. [DOI] [PMC free article] [PubMed] [Google Scholar]
- Commisso C, Davidson SM, Soydaner-Azeloglu RG, Parker SJ, Kamphorst JJ, Hackett S, Grabocka E, Nofal M, Drebin JA, Thompson CB, et al. (2013). Macropinocytosis of protein is an amino acid supply route in Ras-transformed cells. Nature 497, 633–637. [DOI] [PMC free article] [PubMed] [Google Scholar]
- Commisso C, Flinn RJ, and Bar-Sagi D (2014). Determining the macropinocytic index of cells through a quantitative image-based assay. Nat Protoc 9, 182–192. [DOI] [PMC free article] [PubMed] [Google Scholar]
- Daemen A, Peterson D, Sahu N, McCord R, Du X, Liu B, Kowanetz K, Hong R, Moffat J, Gao M, et al. (2015). Metabolite profiling stratifies pancreatic ductal adenocarcinomas into subtypes with distinct sensitivities to metabolic inhibitors. Proc Natl Acad Sci U S A 112, E4410–4417. [DOI] [PMC free article] [PubMed] [Google Scholar]
- Davidson SM, Jonas O, Keibler MA, Hou HW, Luengo A, Mayers JR, Wyckoff J, Del Rosario AM, Whitman M, Chin CR, et al. (2017). Direct evidence for cancer-cell-autonomous extracellular protein catabolism in pancreatic tumors. Nat Med 23, 235–241. [DOI] [PMC free article] [PubMed] [Google Scholar]
- Galenkamp KMO, Alas B, and Commisso C (2019). Quantitation of Macropinocytosis in Cancer Cells. Methods Mol Biol 1928. [DOI] [PubMed] [Google Scholar]
- Hao J, Yang X, Ding XL, Guo LM, Zhu CH, Ji W, Zhou T, and Wu XZ (2016). Paeoniflorin Potentiates the Inhibitory Effects of Erlotinib in Pancreatic Cancer Cell Lines by Reducing ErbB3 Phosphorylation. Sci Rep 6, 32809. [DOI] [PMC free article] [PubMed] [Google Scholar]
- Hara K, Yonezawa K, Weng QP, Kozlowski MT, Belham C, and Avruch J (1998). Amino acid sufficiency and mTOR regulate p70 S6 kinase and eIF-4E BP1 through a common effector mechanism. J Biol Chem 273, 14484–14494. [DOI] [PubMed] [Google Scholar]
- Hensley CT, Faubert B, Yuan Q, Lev-Cohain N, Jin E, Kim J, Jiang L, Ko B, Skelton R, Loudat L, et al. (2016). Metabolic Heterogeneity in Human Lung Tumors. Cell 164, 681–694. [DOI] [PMC free article] [PubMed] [Google Scholar]
- Hensley CT, Wasti AT, and DeBerardinis RJ (2013). Glutamine and cancer: cell biology, physiology, and clinical opportunities. J Clin Invest 123, 3678–3684. [DOI] [PMC free article] [PubMed] [Google Scholar]
- Hosios AM, Hecht VC, Danai LV, Johnson MO, Rathmell JC, Steinhauser ML, Manalis SR, and Vander Heiden MG (2016). Amino Acids Rather than Glucose Account for the Majority of Cell Mass in Proliferating Mammalian Cells. Dev Cell 36, 540–549. [DOI] [PMC free article] [PubMed] [Google Scholar]
- Hui S, Ghergurovich JM, Morscher RJ, Jang C, Teng X, Lu W, Esparza LA, Reya T, Le Z, Yanxiang Guo J, et al. (2017). Glucose feeds the TCA cycle via circulating lactate. Nature 551, 115–118. [DOI] [PMC free article] [PubMed] [Google Scholar]
- Ioannou N, Seddon AM, Dalgleish A, Mackintosh D, Solca F, and Modjtahedi H (2016). Acquired resistance of pancreatic cancer cells to treatment with gemcitabine and HER-inhibitors is accompanied by increased sensitivity to STAT3 inhibition. Int J Oncol 48, 908–918. [DOI] [PMC free article] [PubMed] [Google Scholar]
- Jagadeeshan S, Subramanian A, Tentu S, Beesetti S, Singhal M, Raghavan S, Surabhi RP, Mavuluri J, Bhoopalan H, Biswal J, et al. (2016). P21-activated kinase 1 (Pak1) signaling influences therapeutic outcome in pancreatic cancer. Ann Oncol 27, 1546–1556. [DOI] [PubMed] [Google Scholar]
- Jang WJ, Choi B, Song SH, Lee N, Kim DJ, Lee S, and Jeong CH (2017). Multi-omics analysis reveals that ornithine decarboxylase contributes to erlotinib resistance in pancreatic cancer cells. Oncotarget 8, 92727–92742. [DOI] [PMC free article] [PubMed] [Google Scholar]
- Kamphorst JJ, Nofal M, Commisso C, Hackett SR, Lu W, Grabocka E, Vander Heiden MG, Miller G, Drebin JA, Bar-Sagi D, et al. (2015). Human pancreatic cancer tumors are nutrient poor and tumor cells actively scavenge extracellular protein. Cancer Res 75, 544–553. [DOI] [PMC free article] [PubMed] [Google Scholar]
- Kim SM, Nguyen TT, Ravi A, Kubiniok P, Finicle BT, Jayashankar V, Malacrida L, Hou J, Robertson J, Gao D, et al. (2018). PTEN deficiency and AMPK activation promote nutrient scavenging and anabolism in prostate cancer cells. Cancer Discov. [DOI] [PMC free article] [PubMed] [Google Scholar]
- Lee SW, Alas B, and Commisso C (2019). Detection and Quantification of Macropinosomes in Pancreatic Tumors. Methods Mol Biol 1882, 171–181. [DOI] [PubMed] [Google Scholar]
- Maruyama R, Shimizu M, Ishijima T, Nakai Y, Inoue J, and Sato R (2016). Searching for novel ATF4 target genes in human hepatoma cells by microarray analysis. Biosci Biotechnol Biochem 80, 1149–1154. [DOI] [PubMed] [Google Scholar]
- Mathew MP, Tan E, Saeui CT, Bovonratwet P, Liu L, Bhattacharya R, and Yarema KJ (2015). Metabolic glycoengineering sensitizes drug-resistant pancreatic cancer cells to tyrosine kinase inhibitors erlotinib and gefitinib. Bioorg Med Chem Lett 25, 1223–1227. [DOI] [PMC free article] [PubMed] [Google Scholar]
- Moffitt RA, Marayati R, Flate EL, Volmar KE, Loeza SG, Hoadley KA, Rashid NU, Williams LA, Eaton SC, Chung AH, et al. (2015). Virtual microdissection identifies distinct tumor- and stroma-specific subtypes of pancreatic ductal adenocarcinoma. Nat Genet 47, 1168–1178. [DOI] [PMC free article] [PubMed] [Google Scholar]
- Muir A, Danai LV, Gui DY, Waingarten CY, Lewis CA, and Vander Heiden MG (2017). Environmental cystine drives glutamine anaplerosis and sensitizes cancer cells to glutaminase inhibition. Elife 6. [DOI] [PMC free article] [PubMed] [Google Scholar]
- Navas C, Hernandez-Porras I, Schuhmacher AJ, Sibilia M, Guerra C, and Barbacid M (2012). EGF receptor signaling is essential for k-ras oncogene-driven pancreatic ductal adenocarcinoma. Cancer Cell 22, 318–330. [DOI] [PMC free article] [PubMed] [Google Scholar]
- Nicklin P, Bergman P, Zhang B, Triantafellow E, Wang H, Nyfeler B, Yang H, Hild M, Kung C, Wilson C, et al. (2009). Bidirectional transport of amino acids regulates mTOR and autophagy. Cell 136, 521–534. [DOI] [PMC free article] [PubMed] [Google Scholar]
- Nofal M, Zhang K, Han S, and Rabinowitz JD (2017). mTOR Inhibition Restores Amino Acid Balance in Cells Dependent on Catabolism of Extracellular Protein. Mol Cell 67, 936–946 e935. [DOI] [PMC free article] [PubMed] [Google Scholar]
- Palm W, Park Y, Wright K, Pavlova NN, Tuveson DA, and Thompson CB (2015). The Utilization of Extracellular Proteins as Nutrients Is Suppressed by mTORC1. Cell 162, 259–270. [DOI] [PMC free article] [PubMed] [Google Scholar]
- Pradhan SA, Rather MI, Tiwari A, Bhat VK, and Kumar A (2014). Evidence that TSC2 acts as a transcription factor and binds to and represses the promoter of Epiregulin. Nucleic Acids Res 42, 6243–6255. [DOI] [PMC free article] [PubMed] [Google Scholar]
- Radu M, Semenova G, Kosoff R, and Chernoff J (2014). PAK signalling during the development and progression of cancer. Nat Rev Cancer 14, 13–25. [DOI] [PMC free article] [PubMed] [Google Scholar]
- Ratnikov B, Aza-Blanc P, Ronai ZA, Smith JW, Osterman AL, and Scott DA (2015). Glutamate and asparagine cataplerosis underlie glutamine addiction in melanoma. Oncotarget 6, 7379–7389. [DOI] [PMC free article] [PubMed] [Google Scholar]
- Recouvreux MV, and Commisso C (2017). Macropinocytosis: A Metabolic Adaptation to Nutrient Stress in Cancer. Front Endocrinol (Lausanne) 8, 261. [DOI] [PMC free article] [PubMed] [Google Scholar]
- Redelman-Sidi G, Iyer G, Solit DB, and Glickman MS (2013). Oncogenic activation of Pak1-dependent pathway of macropinocytosis determines BCG entry into bladder cancer cells. Cancer Res 73, 1156–1167. [DOI] [PMC free article] [PubMed] [Google Scholar]
- Sancak Y, Peterson TR, Shaul YD, Lindquist RA, Thoreen CC, Bar-Peled L, and Sabatini DM (2008). The Rag GTPases bind raptor and mediate amino acid signaling to mTORC1. Science 320, 1496–1501. [DOI] [PMC free article] [PubMed] [Google Scholar]
- Seguin L, Camargo MF, Wettersten HI, Kato S, Desgrosellier JS, von Schalscha T, Elliott KC, Cosset E, Lesperance J, Weis SM, et al. (2017). Galectin-3, a Druggable Vulnerability for KRAS-Addicted Cancers. Cancer Discov 7, 1464–1479. [DOI] [PMC free article] [PubMed] [Google Scholar]
- Son J, Lyssiotis CA, Ying H, Wang X, Hua S, Ligorio M, Perera RM, Ferrone CR, Mullarky E, Shyh-Chang N, et al. (2013). Glutamine supports pancreatic cancer growth through a KRAS-regulated metabolic pathway. Nature 496, 101–105. [DOI] [PMC free article] [PubMed] [Google Scholar]
- Swanson JA (2008). Shaping cups into phagosomes and macropinosomes. Nat Rev Mol Cell Biol 9, 639–649. [DOI] [PMC free article] [PubMed] [Google Scholar]
- Vander Heiden MG, and DeBerardinis RJ (2017). Understanding the Intersections between Metabolism and Cancer Biology. Cell 168, 657–669. [DOI] [PMC free article] [PubMed] [Google Scholar]
- Walsh AB, and Bar-Sagi D (2001). Differential activation of the Rac pathway by Ha-Ras and K-Ras. J Biol Chem 276, 15609–15615. [DOI] [PubMed] [Google Scholar]
- West MA, Bretscher MS, and Watts C (1989). Distinct endocytotic pathways in epidermal growth factor-stimulated human carcinoma A431 cells. J Cell Biol 109, 2731–2739. [DOI] [PMC free article] [PubMed] [Google Scholar]
- Yeo D, He H, Patel O, Lowy AM, Baldwin GS, and Nikfarjam M (2016). FRAX597, a PAK1 inhibitor, synergistically reduces pancreatic cancer growth when combined with gemcitabine. BMC Cancer 16, 24. [DOI] [PMC free article] [PubMed] [Google Scholar]
- Yoshida S, Pacitto R, Inoki K, and Swanson J (2018). Macropinocytosis, mTORC1 and cellular growth control. Cell Mol Life Sci 75, 1227–1239. [DOI] [PMC free article] [PubMed] [Google Scholar]
- Yoshida S, Pacitto R, Yao Y, Inoki K, and Swanson JA (2015). Growth factor signaling to mTORC1 by amino acid-laden macropinosomes. J Cell Biol 211, 159–172. [DOI] [PMC free article] [PubMed] [Google Scholar]
Associated Data
This section collects any data citations, data availability statements, or supplementary materials included in this article.
Supplementary Materials
Table S1. List of Genes that are Regulated by Glutamine Starvation in AsPC-1 Cells, Related to Figure 3.
Table S2. List of Genes that are Regulated by Glutamine Starvation in HPAF-II Cells, Related to Figure 3.