Abstract
Low fetal DNA fraction (< 4%) samples obtained during noninvasive prenatal testing (NIPT) are responsible for 0.5%-3% of “no calls”. Maternal characteristics such as body mass index (BMI) and gestational age (GA) are the main factors that influence fetal fraction. Here, we improved fetal fraction by performing semiconductor sequencing of shorter fragments (107-145 bp) of cfDNA (traditional NIPT fragment is 160 bp). Multivariable linear regression modeling was used to evaluate the association between fetal fraction and maternal characteristics including BMI and GA. Among the 1495 shorter cfDNA sequencing samples, BMI and GA were negatively and positively correlated with fetal fraction, respectively. Compared with underweight pregnant women, sequencing of shorter fragments decreased the mean fetal fraction differences between BMI groups, especially in the obese women (~15%). We also showed that the average fetal fraction was 22.2% and 96.3% fetal fraction more than 10% in the obese women with the average GA of 17 weeks. Size selection slightly decreased the mean fetal fraction differences between different GA groups, and sequencing shorter cfDNA can yield a fetal fraction at an earlier GA. Collectively, our results support the strategy of sequencing shorter to improve fetal fraction in subjects with a high maternal BMI and earlier GA.
Keywords: Noninvasive prenatal testing, fetal fraction, size selection, obesity, gestational age
Introduction
Noninvasive prenatal testing (NIPT) is increasingly popular and is being utilized for aneuploidy screenings across the maternal age spectrum beginning at gestational age (GA) of 9-10 weeks and for subjects who are not significantly obese [1]. It is estimated that between 4 and 6 million pregnant women are now receiving NIPT each year worldwide, and the number is expected surpass 15 million within a decade [2,3]. Because cell-free DNA (cfDNA) is a mixture of genomic DNA fragments of maternal and fetal (placental) origin [4,5], NIPT utility is directly related to the fetal fraction [6]. Recent studies have reported that the average fetal fraction is 10% [7]. However, 0.5% to 3% of women and their clinicians will be frustrated by a cfDNA report without a result or a “no calls” due to a low fetal fraction (< 4%) [8-10]. Numerous maternal and fetal characteristics have been associated with reductions in fetal fraction including early GA, maternal obesity, and multiple pregnancies [8,11,12]. Maternal weight is inversely related to the fetal fraction [8]. Previous data suggested that a fetal fraction below 4% increased with maternal weight from < 1% at 60 kg to > 50% at 160 kg [13]. The clinical application of NIPT is therefore limited by the low fetal fraction (< 4%) of cfDNA in obese women. The rate of increase in fetal fraction is not constant across GA. From 10-12.5 weeks, 12.5-20 weeks, and > 20 weeks, the fetal fraction increases at rates of 0.44%, 0.083%, and 0.821% per week, respectively [6]. Waiting for a later GA and repeating sample collection is not a reliable approach to overcoming the low fetal fraction in subjects with higher body mass indexes (BMIs) and earlier GAs.
Early work, using quantitative polymerase chain reaction (qPCR) with different amplicon sizes targeting the leptin gene, revealed that maternal-derived DNA fragments are generally longer than fetal-derived ones [14]. A subsequent study demonstrated that circulatory fetal DNA can be enriched by size selection of fragment sizes < 0.3 kb by agarose gel electrophoresis and real-time PCR [15]. Recent studies reported that the most significant difference between fetal and maternal DNA in maternal plasma is the reduction in the 166-bp peak relative to the 143-bp peak [16,17]. A possible mechanism for this shortening of circulating fetal DNA is that fetal-specific preferred end sites were mostly located at the border or within the nucleosome core. However, the maternal-specific end sites were mostly in the linker region, which was consistent with the size profile of DNA wrapping the nucleosome core and nucleosome spacing pattern in the genome [16,17]. Based on this hypothesis, our group developed a new NIPT method that sequences shorter cfDNA fragments (107-145 bp) to improve the fetal fraction [18]. The objective of this study was to examine the impact of maternal characteristics, such as GA and BMI, on fetal fraction in shorter cfDNA fragment sequencing.
Materials and methods
Protocol for sequencing shorter cfDNA fragments for NIPT
After receiving approval by the reproductive medicine ethics committee of Suzhou municipal hospital (approval no. K901001), we retrospectively analyzed plasma samples from 1495 women pregnant with male fetuses by sequencing shorter cfDNA fragments (107-145 bp) for NIPT. All of samples had fetal karyotypes or clinical follow-up results. cfDNA was extracted from 600 μl plasma, a library was constructed by PCR, and recycled shorter fragments form PCR were produced by E-Gel® EX Gels (Invitrogen, Carlsbad, CA, USA). cfDNA and library concentrations were measured with the QubitTM dsDNA HS Kit. Then, the recycled cfDNA were sequencing by Ion Proton system. Fetal DNA concentration was evaluated by calculating the proportion of reads from chromosome Y.
Statistical analysis
The distribution of fetal fraction was assessed for an approximately normal distribution with normal Q-Q plots. We used different linear regression models to examine the associations of fetal fraction and GA and BMI. We generated a categorical variable for BMI (< 18.5 kg/m2 vs. 18.5-24.9 kg/m2, 25-30 kg/m2, ≥ 30 kg/m2) and GA (21-26 weeks vs. 18-20 weeks, 15-17 weeks, 12-14 weeks). Relative to the referent category, we computed estimates and 95% confidence intervals (CIs) for the mean differences in fetal fraction for each category of BMI and GA. We used five different models. Model 1 is a univariate linear regression of the relationship between BMI or GA and fetal fraction. Model 2 was adjusted for GA (continuous numerical variables) and multiple gestations (categorical variables) or BMI (continuous numerical variables) and multiple gestations (categorical variables). Model 3 added mean size of cfDNA (continuous numerical variables) on the basis of model 2. Model 4 added maternal age (continuous numerical variables), maternal plasma cfDNA concentration (continuous numerical variables), library concentration (continuous numerical variables), and uniquely mapped reads (continuous numerical variables) on the basis of model 2. Model 5 added the mean size of cfDNA (continuous numerical variables) on the basis of model 4. We selected these confounders based on their associations with the outcomes of interest or a change in effect estimate > 10% [19]. All analyses were performed using SPSS version 24.0 (IBM Corp, Armonk, NY, USA). All P values were 2-sided, and P < 0.05 was considered statistically significant.
Results
Sample characteristics
The characteristics of the study population are presented in Table 1. The mean maternal age, BMI, GA, mean uniquely mapped reads, size of cfDNA, and fetal DNA concentration were 31.0 (range 18 to 47 years), 22.5 (range 15.4 to 44.2 kg/m2, Figure 1A), 17.3 (range 12 to 26 week, Figure 1B), 2.4 Mb (range 1.0 to 9.0 Mb), 130 bp (range 107 to 145 bp) and 30.7% (range 5.8% to 93.6%), respectively. The number of uniquely mapped reads needed for short-sequencing NIPT is significantly lower than that of traditional NIPT. In singleton and twin pregnancies, the mean fetal fractions were 31.0% (range 5.8% to 93.6%) and 28.3% (range 8.6% to 68.1%), which was higher than a previous study on fetal fraction in twin pregnancy research [12].
Table 1.
Maternal and fetal characteristics of the study population (n = 1495)
| Characteristic | Male fetus |
|---|---|
| Sample size | 1495 |
| Maternal age (years) | 31.0 (18.0-47.0) |
| Maternal weight (kg) | 58.3 (40-109) |
| Maternal height (cm) | 160.8 (145-179) |
| Body mass index (kg/m2) | 22.5 (15.4-44.2) |
| Gestational age (week) | 17.3 (12-26) |
| Number of pregnancy | 2.5 (1-9) |
| Uniquely mapped reads (Mb) | 2.4 (1.0-9.0) |
| Median size of cell-free DNA (bp) | 130 (107-145) |
| Fetal DNA concentration (%) | 30.7 (5.8-93.6) |
| Maternal plasma cell-free DNA concentration (ng/μl) | 0.17 (0.04-0.71) |
| Library concentration (ng/μl) | 8.3 (0.05-21.7) |
| Singleton pregnancies | 1327 |
| Monochorionic twins | 7 |
| Dizygotic twins | 161 |
Figure 1.
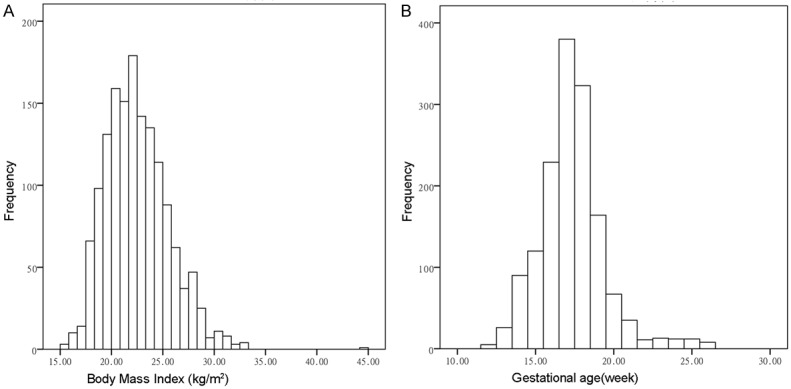
Distributions of body mass index (A) and gestational age across (B) all samples in this study.
Fetal fraction decreases with BMI in sequencing of short cfDNA NIPT
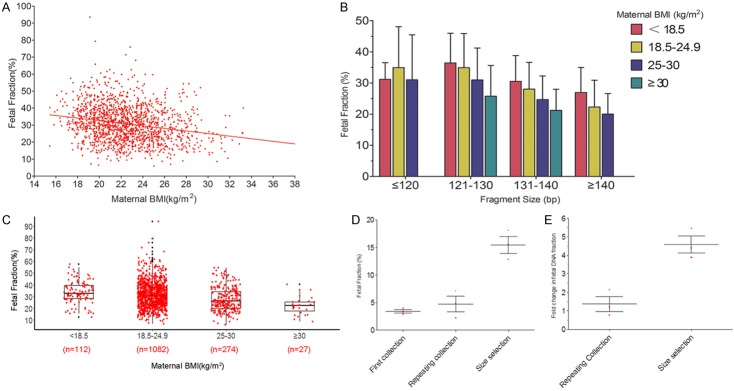
BMI was negatively correlated with fetal fraction in sequencing of short cfDNA NIPT (Figure 2A). This result confirmed that fetal fraction was decreased in the high BMI group. As shown in Figure 2B, among pregnant women with the same BMI range, fetal fraction decreased with longer cfDNA fragment size. In the same cfDNA fragment size range, fetal fraction decreased with higher maternal BMI. The mean fetal fractions for subjects with maternal BMI < 18.5 kg/m2, 18.5-24.9 kg/m2, 25-30 kg/m2, and ≥ 30 kg/m2 were 33.7% (range 12.1% to 57.5%), 31.4% (range 6.4% to 93.6%), 27.5% (range 5.8% to 54.3%), and 22.2% (range 8.6% to 40.1%) (Figure 2C). Among the obese subjects, 96.3% of fetal fractions were more than 10%.
Figure 2.
Relationship between fetal fraction and maternal BMI. A. BMI was negatively correlated with fetal fraction in sequencing of shorter cfDNA for NIPT. B. In pregnant women with the same body mass index range, fetal fraction decreased with longer cfDNA fragment size. In the same cfDNA fragment size range, fetal fraction decreased with maternal BMI. C. The mean fetal fractions for maternal BMI < 18.5, 18.5-24.9, 25-30, and ≥ 30 kg/m2 were 33.7%, 31.4%, 27.5%, and 22.2%, respectively. The fetal fraction in obese pregnant women decreased significantly; however, the fetal fraction was > 10% in 96.3% of pregnant women by sequencing of short cfDNA NIPT. D. The mean fetal fraction was 3.4% at first sampling, 4.73% at repeat sample collection (mean interval 11 days), and 15.48% when sequencing of shorter cDNA NIPT (mean size of cell free DNA: 125 bp). E. The average increased times were 1.39 and 2.35 at repeat sample collection and shorter cfDNA sequencing, respectively.
Sequencing of shorter cfDNA decreases fetal fraction differences among BMI groups
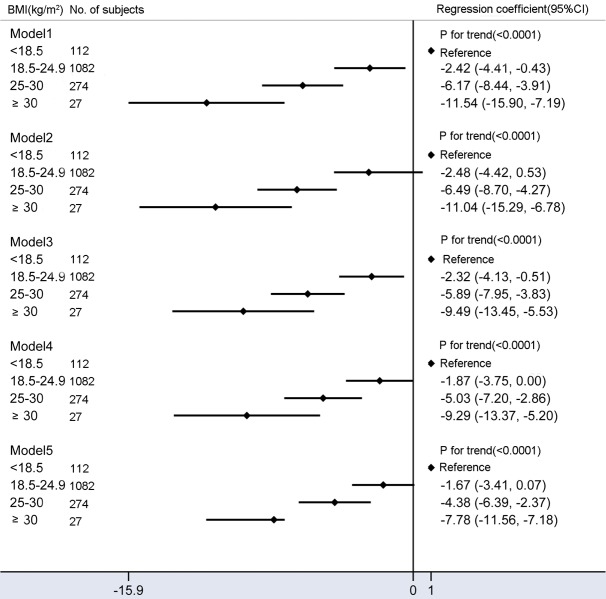
The multivariable-adjusted (model 4) mean fetal fraction differences across the categories of maternal BMI were -1.87% (95% CI: -3.75% to 0%) for a BMI of 18.5-24.9 kg/m2, -5.03% (95% CI: -7.20% to -2.86%) for 25-29.9 kg/m2, and -9.29% (95% CI: -13.37% to -5.20%) for BMI > 30 kg/m2 compared with BMI < 18.5 kg/m2 (Ptrend < 0.0001). However, mean fetal fraction differences were -1.67% (95% CI: -3.41% to 0.07%) for 18.5-24.9 kg/m2, -4.38% (95% CI: -6.39% to -2.37%) for 25-29.9 kg/m2, and -7.78% (95% CI: -11.56% to -3.99%) for BMI > 30 kg/m2 compared with BMI < 18.5 kg/m2 (Ptrend < 0.0001) after adjusting for confounding factors plus the average size of cfDNA (model 5, Figure 3), suggesting that sequencing shorter cfDNA significantly decreases mean fetal fraction differences between different BMI groups, especially in obese subjects (by ~15%).
Figure 3.
Mean differences in fetal fraction according to maternal BMI (kg/m2). Model 1: Crude model. Model 2 were adjusted for GA and multiple gestations. Model 3 added average size of cell-free DNA on the basis of model 2. Model 4 added maternal age, maternal plasma cell-free DNA concentration, library concentration, and uniquely mapped reads on the basis of model 2. Model 5 added average size of cell-free DNA on the basis of model 4. Compared to models 2 and 4, models 3 and 5 included additional adjustments for confounding factors of the average size of cell-free DNA and significantly reduced fetal fraction differences between obese and underweight pregnant women.
Sequencing of shorter cfDNA reduces the screen failure rate for obese women
We sequenced shorter cfDNA of the first sample of obese women who had failed normal NIPT due to insufficient fetal fraction. The mean fetal fraction was 3.4% at first sample, increased to 4.73% at repeat sample collection (mean time interval 11 days), and reached 15.48% during NIPT with shorter cfDNA (mean size: 125 bp, Figure 2D). In one-third of samples, fetal fraction was still below the lower limit (4%) after repeat sample collection at later GA. The average increased time was 1.39 and 2.35 weeks at repeat sample collection and sequencing of shorter cDNA (Figure 2E). Fetal fraction was significantly increased by sequencing shorter cDNA, suggesting that this, rather than waiting for a later GA, is a reasonable strategy to reduce the probability of screening failure in obese subjects.
Relationship between GA and fetal fraction in sequencing short cfDNA
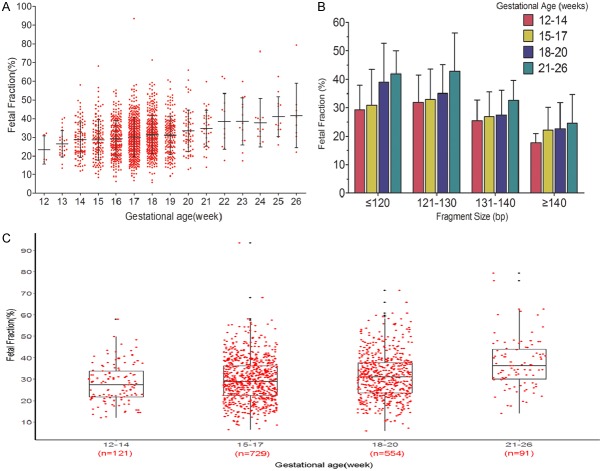
GA was positively correlated with fetal fraction (Figure 4A). The mean fetal fractions for of 12-14, 15-17, 18-20, and 21-26 weeks’ gestation were 28.0% (range 11.8% to 58.0%), 29.6% (range 6.4% to 93.6%), 31.5% (range 5.8% to 71.4%) and 37.6% (range 14.0% to 79.3%) (Figure 4C). As shown in Figure 4B, pregnant women in the same GA range had lower fetal fractions with longer cfDNA fragment size. In the same cfDNA fragment size range, fetal fraction increased with older GA.
Figure 4.
Relationship between fetal fraction and gestational age (week). A. Between 12 and 20 weeks’ gestational age, mean fetal fraction increased slightly. Stating at 20 weeks, there was a greater weekly increase for fetal percent. B. In pregnant women with the same gestational age range, fetal fraction decreased with longer cfDNA fragment size. In the same cfDNA fragment size range, fetal fraction increased with gestational age. C. The mean fetal fractions of 12-14, 15-17, 18-20, and 21-26 weeks’ gestation were 28.0%, 29.6%, 31.5%, and 37.6%. Compared with normal NIPT (typically ~10%), sequencing short cfDNA NIPT significantly increased fetal fraction at 12-14 weeks.
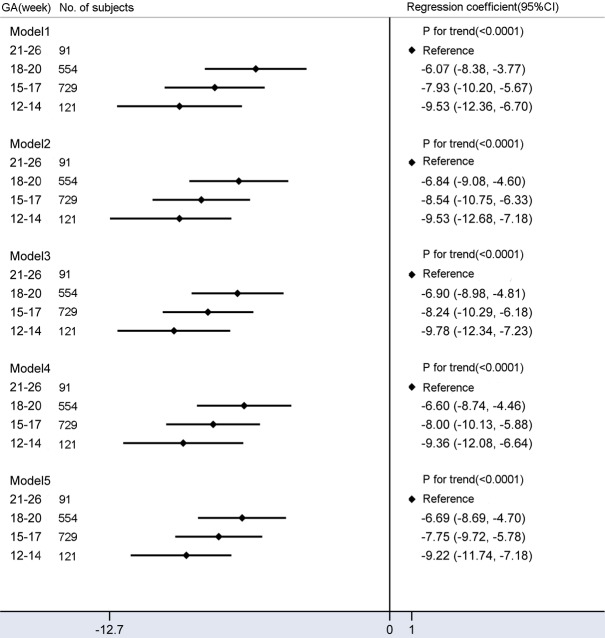
The mean fetal fraction differences were -6.07% (95% CI: -8.38% to -3.77%) for 18-20 weeks, -7.93% (95% CI: -10.20% to -5.67%) for 15-17 weeks, and -9.53% (95% CI: -12.36% to -6.70%) for 12-14 weeks compared with a GA of 21-26 weeks (Ptrend < 0.0001) (Figure 5). Additional adjustments changed these effects only slightly, suggesting that the confounding factors of this study were not related to the mean fetal fraction differences between different GA groups. Notably, sequencing shorter cfDNA can yield a higher fetal fraction at earlier GAs (mean fetal fraction: 28%).
Figure 5.
Mean differences in fetal fraction according to gestational age (week) category. Model 1 is a univariate linear regression of relationship between GA and fetal fraction. Model 2 was adjusted for BMI and multiple gestations. Model 3 added average size of cell-free DNA on the basis of model 2. Model 4 added maternal age, maternal plasma cell-free DNA concentration, library concentration, and uniquely mapped reads on the basis of model 2. Model 5 added average size of cell-free DNA on the basis of model 4. Compared with model 1, additional adjustment for confounding factors slightly reduced fetal fraction differences among different groups.
Discussion
We observed that higher BMI and earlier GA were associated with lower fetal fraction. Compared with normal NIPT (typically ~10% [7]), sequencing shorter cfDNA NIPT can yield higher fetal fractions in patients with higher BMI and earlier GA. Sequencing shorter cfDNA NIPT significantly decreases mean fetal fraction differences between different BMI groups, especially in the obese women (~15%). Sequencing shorter cfDNA is a more reliable method for improving fetal fraction than waiting for an older GA. However, the mean fetal fraction differences between different GA groups were not explained by confounding factors of this study.
The inverse association between maternal BMI and fetal fraction could be attributed to a diluting effect. It more likely that this is due to increased production of total cfDNA because decreased clearance would also likely lead to an increase in fetal cfDNA [20]. Another possible explanation for this association is that accelerated turnover of adipose cells and increased white blood cell count in obese women leads to greater release of cfDNA of maternal origin into the circulation [6,20,21]. Livergood, et al. reported increased odds of a screening failure among overweight and obese women compared to normal weight women with a significant upward trend from 2 to > 8-fold as BMI increases from overweight to class III obesity. The authors also reported that significant differences in NIPT failure rates between obese and normal weight women disappear at 21 weeks, when reproductive choices are more limited [8]. A recent report showed that among the 94 cases who were retested with a second blood sampling, 61% had either positive or negative results; our result (2/3) is comparable to this rate in obese pregnant women [22]. High-resolution plasma DNA size profiling revealed the most striking difference between fetal and maternal cfDNA fragments is the relative reduction of the 166-bp peak and elevations of smaller peaks at sizes ≤ 143 bp for fetal cfDNA, suggesting that maternal-derived DNA is longer [16,17,23-25]. Hence, sequencing shorter cfDNA fragments (107-145 bp) may be a reasonable strategy to reduce the probability of low fetal fraction in obese subjects. Indeed, we found that the average fetal fraction was 22.2%, and 96.3% of fetal fractions were > 10% in obese women with an average GA of 17 weeks. Sequencing shorter cfDNA also significantly decreased mean fetal fraction differences between obese and normal weight subjects.
The positive association between maternal GA and fetal fraction in sequencing of short cfDNA NIPT is compatible with a published traditional NIPT study [13]. However, the mean fetal fraction differences between GA groups were not explained by confounding factors of this study. cfDNA in the peripheral blood sample of a pregnant woman derives from three tissues: placenta, maternal, and fetus [26]. Apoptotic placenta cells (trophoblasts) are a major source of fetal fragments in maternal plasma [27], and the number of apoptotic cells would be proportional to the placental mass. Hence, GA-related differences may be due to placental mass rather than maternal cell apoptosis or confounding factors of this study. However, we also noticed that the mean fetal fraction of slightly early GA (12-14 weeks) was much higher than that in normal NIPT (28.0% vs. 10%).
In summary, this is the first study to explore the relationship between maternal GA or BMI and fetal fraction adjusted for a considerable number of potential confounders in sequencing of shorter cfDNA NIPT. Sequencing shorter cfDNA fragments offers a solution to low fetal fraction due to maternal with higher BMIs and earlier GAs. However, the insufficient sample sizes of size-selection NIPT for obese subjects and earlier gestational ages means that further studies are required to validate these findings.
Acknowledgements
We thank all the families for participating in this research project. This work was supported by Suzhou Key Medical Center (SZZX201505), Jiangsu Maternal and Children Health Care research project (F201603), Jiangsu Provincial Medical Innovation Team (CXTDB2017013), Suzhou Clinical Medical Expert Team (SZYJTD201708), Suzhou Science and Technology Support Program (SYS201649 and SYSD2017102), Jiangsu Maternal and Children Health Care key discipline (FXK201748 and FXK201754), NSFC grants, China (No. 81801478), Science and technology development fund of Nanjing Medical University (2017NJMU158), Key research and development plan project of Jiangsu Province (be2017650), the innovation program of Jiangsu province (Q.Z.), and NSFC grants, China (Nos. 31271399 and 81472047, Q.Z.).
Disclosure of conflict of interest
None.
References
- 1.Gregg AR, Skotko BG, Benkendorf JL, Monaghan KG, Bajaj K, Best RG, Klugman S, Watson MS. Noninvasive prenatal screening for fetal aneuploidy, 2016 update: a position statement of the American college of medical genetics and genomics. Genet Med. 2016;18:1056–1065. doi: 10.1038/gim.2016.97. [DOI] [PubMed] [Google Scholar]
- 2.Green ED, Rubin EM, Olson MV. The future of DNA sequencing. Nature. 2017;550:179–181. doi: 10.1038/550179a. [DOI] [PubMed] [Google Scholar]
- 3.Bianchi DW, Chiu RWK. Sequencing of circulating cell-free DNA during pregnancy. N Engl J Med. 2018;379:464–473. doi: 10.1056/NEJMra1705345. [DOI] [PMC free article] [PubMed] [Google Scholar]
- 4.Lo YM, Corbetta N, Chamberlain PF, Rai V, Sargent IL, Redman CW, Wainscoat JS. Presence of fetal DNA in maternal plasma and serum. Lancet. 1997;350:485–487. doi: 10.1016/S0140-6736(97)02174-0. [DOI] [PubMed] [Google Scholar]
- 5.Canick JA, Palomaki GE, Kloza EM, Lambert-Messerlian GM, Haddow JE. The impact of maternal plasma DNA fetal fraction on next generation sequencing tests for common fetal aneuploidies. Prenat Diagn. 2013;33:667–674. doi: 10.1002/pd.4126. [DOI] [PubMed] [Google Scholar]
- 6.Kinnings SL, Geis JA, Almasri E, Wang H, Guan X, McCullough RM, Bombard AT, Saldivar JS, Oeth P, Deciu C. Factors affecting levels of circulating cell-free fetal DNA in maternal plasma and their implications for noninvasive prenatal testing. Prenat Diagn. 2015;35:816–822. doi: 10.1002/pd.4625. [DOI] [PubMed] [Google Scholar]
- 7.Liu L, Li K, Fu X, Chung C, Zhang K. A forward look at noninvasive prenatal testing. Trends Mol Med. 2016;22:958–968. doi: 10.1016/j.molmed.2016.09.008. [DOI] [PubMed] [Google Scholar]
- 8.Livergood MC, LeChien KA, Trudell AS. Obesity and cell-free DNA “no calls”: is there an optimal gestational age at time of sampling? Am J Obstet Gynecol. 2017;216:413.e411–413.e419. doi: 10.1016/j.ajog.2017.01.011. [DOI] [PubMed] [Google Scholar]
- 9.Gil MM, Accurti V, Santacruz B, Plana MN, Nicolaides KH. Analysis of cell-free DNA in maternal blood in screening for aneuploidies: updated meta-analysis. Ultrasound Obstet Gynecol. 2017;50:302–314. doi: 10.1002/uog.17484. [DOI] [PubMed] [Google Scholar]
- 10.Gil MM, Quezada MS, Revello R, Akolekar R, Nicolaides KH. Analysis of cell-free DNA in maternal blood in screening for fetal aneuploidies: updated meta-analysis. Ultrasound Obstet Gynecol. 2015;45:249–266. doi: 10.1002/uog.14791. [DOI] [PubMed] [Google Scholar]
- 11.Zhang H, Gao Y, Jiang F, Fu M, Yuan Y, Guo Y, Zhu Z, Lin M, Liu Q, Tian Z, Zhang H, Chen F, Lau TK, Zhao L, Yi X, Yin Y, Wang W. Non-invasive prenatal testing for trisomies 21, 18 and 13: clinical experience from 146,958 pregnancies. Ultrasound Obstet Gynecol. 2015;45:530–538. doi: 10.1002/uog.14792. [DOI] [PubMed] [Google Scholar]
- 12.Bevilacqua E, Gil MM, Nicolaides KH, Ordonez E, Cirigliano V, Dierickx H, Willems PJ, Jani JC. Performance of screening for aneuploidies by cell-free DNA analysis of maternal blood in twin pregnancies. Ultrasound Obstet Gynecol. 2015;45:61–66. doi: 10.1002/uog.14690. [DOI] [PubMed] [Google Scholar]
- 13.Ashoor G, Syngelaki A, Poon LC, Rezende JC, Nicolaides KH. Fetal fraction in maternal plasma cell-free DNA at 11-13 weeks’ gestation: relation to maternal and fetal characteristics. Ultrasound Obstet Gynecol. 2013;41:26–32. doi: 10.1002/uog.12331. [DOI] [PubMed] [Google Scholar]
- 14.Chan KC, Zhang J, Hui AB, Wong N, Lau TK, Leung TN, Lo KW, Huang DW, Lo YM. Size distributions of maternal and fetal DNA in maternal plasma. Clin Chem. 2004;50:88–92. doi: 10.1373/clinchem.2003.024893. [DOI] [PubMed] [Google Scholar]
- 15.Li Y, Zimmermann B, Rusterholz C, Kang A, Holzgreve W, Hahn S. Size separation of circulatory DNA in maternal plasma permits ready detection of fetal DNA polymorphisms. Clin Chem. 2004;50:1002–1011. doi: 10.1373/clinchem.2003.029835. [DOI] [PubMed] [Google Scholar]
- 16.Jiang P, Lo YMD. The long and short of circulating cell-free DNA and the ins and outs of molecular diagnostics. Trends Genet. 2016;32:360–371. doi: 10.1016/j.tig.2016.03.009. [DOI] [PubMed] [Google Scholar]
- 17.Sun K, Jiang P, Wong AIC, Cheng YKY, Cheng SH, Zhang H, Chan KCA, Leung TY, Chiu RWK, Lo YMD. Size-tagged preferred ends in maternal plasma DNA shed light on the production mechanism and show utility in noninvasive prenatal testing. Proc Natl Acad Sci U S A. 2018;115:E5106–E5114. doi: 10.1073/pnas.1804134115. [DOI] [PMC free article] [PubMed] [Google Scholar]
- 18.Liang B, Li H, He Q, Li H, Kong L, Xuan L, Xia Y, Shen J, Mao Y, Li Y, Wang T, Zhao YL. Enrichment of the fetal fraction in non-invasive prenatal screening reduces maternal background interference. Sci Rep. 2018;8:17675. doi: 10.1038/s41598-018-35738-0. [DOI] [PMC free article] [PubMed] [Google Scholar]
- 19.Jaddoe VW, de Jonge LL, Hofman A, Franco OH, Steegers EA, Gaillard R. First trimester fetal growth restriction and cardiovascular risk factors in school age children: population based cohort study. BMJ. 2014;348:g14. doi: 10.1136/bmj.g14. [DOI] [PMC free article] [PubMed] [Google Scholar]
- 20.Vora NL, Johnson KL, Basu S, Catalano PM, Hauguel-De Mouzon S, Bianchi DW. A multifactorial relationship exists between total circulating cell-free DNA levels and maternal BMI. Prenat Diagn. 2012;32:912–914. doi: 10.1002/pd.3919. [DOI] [PMC free article] [PubMed] [Google Scholar]
- 21.Haghiac M, Vora NL, Basu S, Johnson KL, Presley L, Bianchi DW, Hauguel-de Mouzon S. Increased death of adipose cells, a path to release cell-free DNA into systemic circulation of obese women. Obesity (Silver Spring) 2012;20:2213–2219. doi: 10.1038/oby.2012.138. [DOI] [PMC free article] [PubMed] [Google Scholar]
- 22.Suzumori N, Sekizawa A, Takeda E, Samura O, Sasaki A, Akaishi R, Wada S, Hamanoue H, Hirahara F, Kuriki H, Sawai H, Nakamura H, Yamada T, Miura K, Masuzaki H, Yamashita T, Kamei Y, Namba A, Murotsuki J, Tanemoto T, Fukushima A, Haino K, Tairaku S, Matsubara K, Maeda K, Kaji T, Ogawa M, Osada H, Nishizawa H, Okamoto Y, Kanagawa T, Kakigano A, Endo M, Kitagawa M, Ogawa M, Izumi S, Katagiri Y, Takeshita N, Kasai Y, Naruse K, Neki R, Masuyama H, Hyodo M, Kawano Y, Ohba T, Ichizuka K, Nagamatsu T, Watanabe A, Nishikawa N, Hamajima N, Shirato N, Yotsumoto J, Nishiyama M, Koide K, Hirose T, Sago H. Classification of factors involved in nonreportable results of noninvasive prenatal testing (NIPT) and prediction of success rate of second NIPT. Prenat Diagn. 2019;39:100–106. doi: 10.1002/pd.5408. [DOI] [PubMed] [Google Scholar]
- 23.Lo YM, Chan KC, Sun H, Chen EZ, Jiang P, Lun FM, Zheng YW, Leung TY, Lau TK, Cantor CR, Chiu RW. Maternal plasma DNA sequencing reveals the genome-wide genetic and mutational profile of the fetus. Sci Transl Med. 2010;2:61ra91. doi: 10.1126/scitranslmed.3001720. [DOI] [PubMed] [Google Scholar]
- 24.Yu SC, Chan KC, Zheng YW, Jiang P, Liao GJ, Sun H, Akolekar R, Leung TY, Go AT, van Vugt JM, Minekawa R, Oudejans CB, Nicolaides KH, Chiu RW, Lo YM. Size-based molecular diagnostics using plasma DNA for noninvasive prenatal testing. Proc Natl Acad Sci U S A. 2014;111:8583–8588. doi: 10.1073/pnas.1406103111. [DOI] [PMC free article] [PubMed] [Google Scholar]
- 25.Yin AH, Peng CF, Zhao X, Caughey BA, Yang JX, Liu J, Huang WW, Liu C, Luo DH, Liu HL, Chen YY, Wu J, Hou R, Zhang M, Ai M, Zheng L, Xue RQ, Mai MQ, Guo FF, Qi YM, Wang DM, Krawczyk M, Zhang D, Wang YN, Huang QF, Karin M, Zhang K. Noninvasive detection of fetal subchromosomal abnormalities by semiconductor sequencing of maternal plasma DNA. Proc Natl Acad Sci U S A. 2015;112:14670–14675. doi: 10.1073/pnas.1518151112. [DOI] [PMC free article] [PubMed] [Google Scholar]
- 26.Bianchi DW. Cherchez la femme: maternal incidental findings can explain discordant prenatal cell-free DNA sequencing results. Genet Med. 2018;20:910–917. doi: 10.1038/gim.2017.219. [DOI] [PMC free article] [PubMed] [Google Scholar]
- 27.Lim JH, Lee BY, Kim JW, Han YJ, Chung JH, Kim MH, Kwak DW, Park SY, Choi HB, Ryu HM. Evaluation of extraction methods for methylated cell-free fetal DNA from maternal plasma. J Assist Reprod Genet. 2018;35:637–641. doi: 10.1007/s10815-018-1114-8. [DOI] [PMC free article] [PubMed] [Google Scholar]


