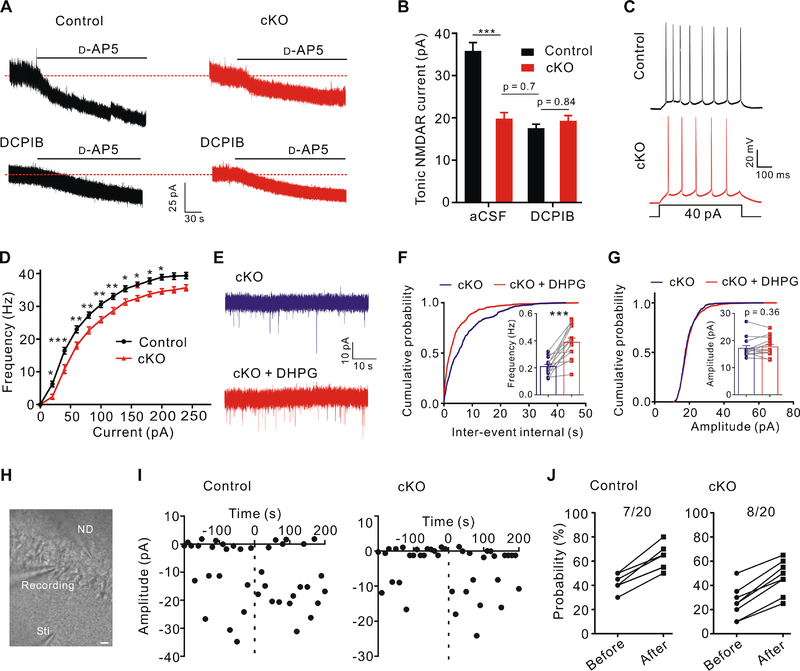
Figure 5. Modulation of ambient glutamate level and neuronal excitability by astrocytic Swell1.
(A) Tonic NMDAR current recordings from CA1 pyramidal neurons in control and Swell1 cKO mice. Dashed lines indicate the changes of baseline induced by application of the NMDAR antagonist D-AP5 (50 μM). DCPIB, 25 μM.
(B) Quantification of D-AP5-sensitive tonic NMDAR currents. aCSF: n = 14 cells from 6 mice for each genotype. DCPIB: n = 12–14 cells from 4 mice for each genotype. One-way ANOVA, Bonferroni post hoc test, *** p < 0.001.
(C) Representative traces of action potentials in CA1 pyramidal neurons evoked by depolarizing current injection.
(D) Summarized results of firing rate under increasing step currents. n = 23 cells from 6 mice for each genotype. Two-way ANOVA, Bonferroni post hoc test, * p < 0.05, ** p < 0.01, *** p < 0.001.
(E) Representative traces of mEPSCs recorded from hippocampal CA1 neurons of Swell1 cKO mice before and after brief DHPG (50 μM) treatment.
(F and G) Quantification of mEPSCs frequency (F) and amplitude (G). n = 14 cells from 6 mice for each genotype. Paired Student’s t-test for (F), ** p < 0.001; Wilcoxon matched-pairs signed rank test for (G).
(H) Representative infrared differential interference contrast (DIC) image of paired recorded CA1 pyramidal neurons and the stimulation electrode in hippocampal slices. Sti, stimulation pipette; ND, neuronal depolarization. Scale bar, 20 μm.
(I) EPSC amplitudes from a representative synapse evoked by minimal stimulation in control (left) and Swell1 cKO (right) mice. Dot line at zero time indicates the application of neuronal depolarization.
(J) The fraction of paired recording experiments with an increase (>10%) in the neurotransmitter release probability before and after neuronal depolarization in control (left) and Swell1 cKO (right) mice. n = 20 cells from 6 mice for each genotype. Due to data overlapping, the data point is less than the n number. Note the basal release probability is lower in CA1 neurons of the cKO mice, consistent with Figure 4D.
Data are reported as mean ± SEM.

