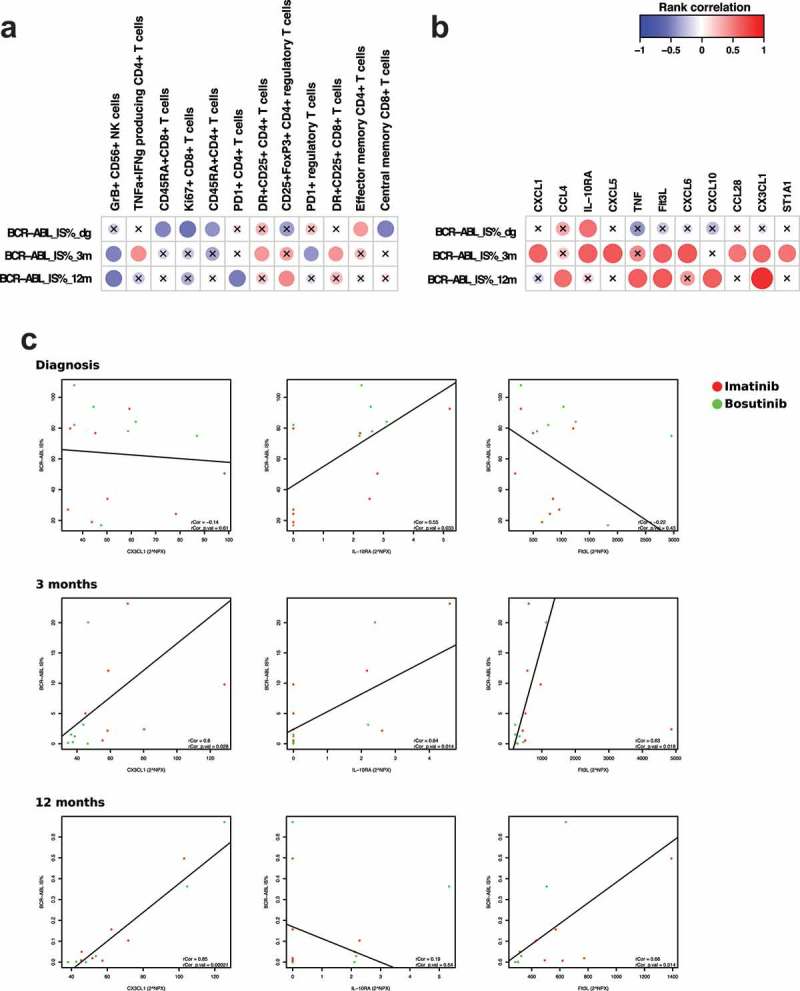
Figure 2.

BCR-ABL burden correlates with immunological parameters during treatment time. Spearman rank correlation analysis revealed several significant hits when comparing BCR-ABL IS% at diagnosis, then 3 and 12 months after treatment start with multiple phenotyping parameters (a) as well at plasma proteins (b). The scale indicates correlation coefficient values: positive correlations are observed with red color and negative with blue color. Nonsignificant results are marked with an X. Individual correlation plots with regression were analyzed for CX3CL1, IL-10RA, and Flt3L at baseline, 3 months and 12 months (c). One outlier (abnormally high BCR-ABL IS%) was removed from the analysis. Bosutinib-treated patients are presented in the figures in green and imatinib-treated patients in red. Protein levels are expressed as Normalized Protein eXpression (NPX) values, an arbitrary unit on log2-scale. Regulatory T cells were gated as CD45+ CD3+ CD4+ CD25high FoxP3+, memory subsets of T cells were defined by expression of CCR7 and CD45RA, and cytokine-producing T cells refer to TNF-alpha and interferon-gamma-producing CD4 + T cells after in vitro-stimulation.
