Figure 6.

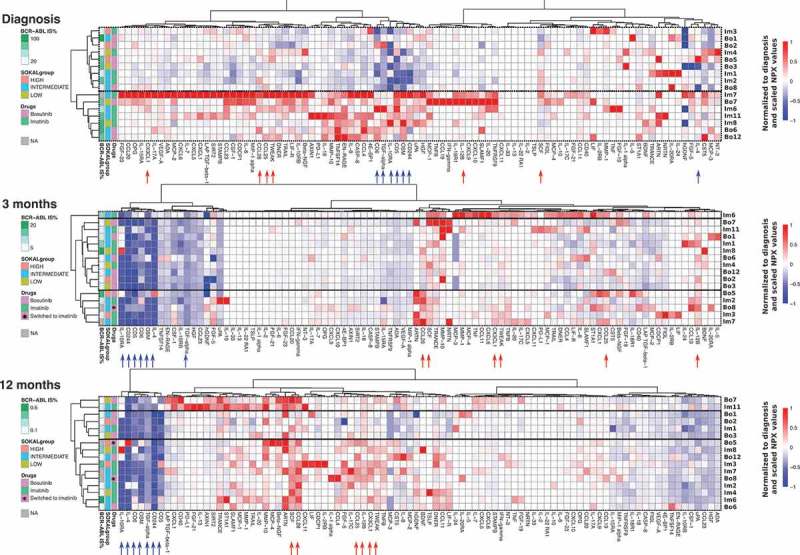
CML patients with high BCR-ABL IS% at diagnosis have distinct soluble plasma protein and receptor profile. Soluble plasma proteins were calculated as NPX values at diagnosis and after therapy start. All data were normalized to baseline median values, in order to visualize treatment-induced changes in each parameter. Heatmap analysis was performed including Euclidean distance and unsupervised hierarchical clustering methods for each timepoint independently, and annotations were added for Sokal risk at diagnosis, BCR-ABL IS% at each timepoint and study drug. At diagnosis, two clusters with different BCR-ABL IS% (median values 34.1 and 80.4) are observed with distinctive plasma protein profiles. After the therapy start, a group of soluble proteins and receptors clearly decreased after TKI start, namely CD5, CD6, CD244, OSM, IL-10RA, IL-4, and TGF-alpha (marked with blue arrows). On the contrary, CCL28, SCF, TWEAK, CX3CL1, IL-12B, and CCL25 (marked with red arrows) prominently increased after TKI start. Patients who started on bosutinib and switched to imatinib treatment during the 12-month follow up are marked with an asterisk.
