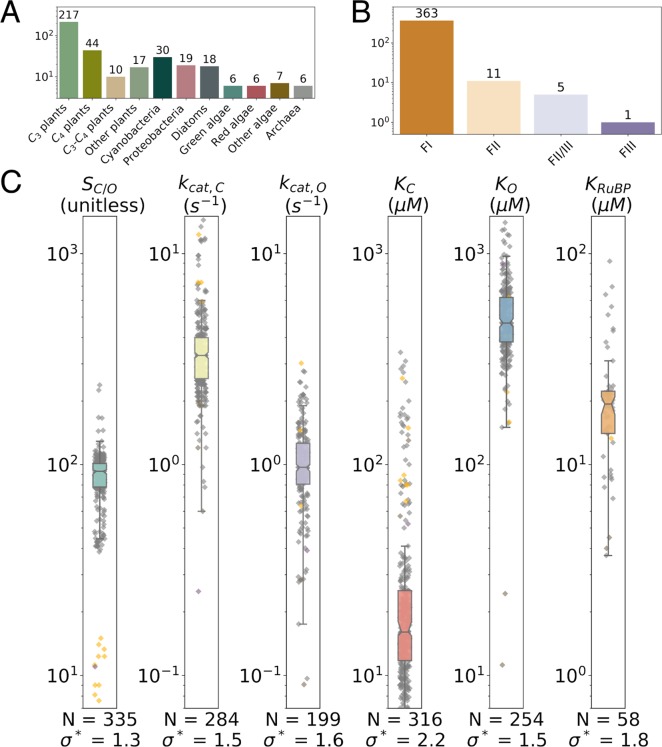
Figure 3.
Summary of the full extended data set. We collected measurements of Rubisco kinetic parameters from a variety of organisms (A) representing four classes of Rubisco isoforms (B). Form I enzymes from plants, cyanobacteria, and algae make up the bulk of the data (A and B). (C) Rubisco kinetic parameters display a narrow dynamic range. The box plot and gray points describe the distribution of Form I Rubiscos, while data for Form II Rubiscos are colored yellow. Colored boxes give the range of the central 50% of FI values, and the notch indicates the median. N is the number values, and σ* gives the geometric standard deviation of Form I data. σ* < 3 for all parameters, meaning a single standard deviation varies by <3-fold. All data are from wild-type Rubiscos measured at 25 °C and near pH 8. More detailed histograms are given in Figure S4.

