

Abstract
Proteome profiling of circulating tumor cells (CTCs) can provide crucial insight into disease progression and the role of CTCs in tumor metastasis. We describe an integrated workflow to measure global protein expression in 1–5 spiked CTCs enriched from whole blood by immunodensity gradient centrifugation. Enriched CTCs were purified and collected by laser capture microdissection, prepared using a recently developed nanodroplet-based processing platform (nanoPOTS), and finally analyzed by ultrasensitive nanoLC-MS/MS. The workflow was capable of identifying an average of 164 and 607 protein groups from samples comprising 1 and 5 LNCaP cells, respectively, that were isolated from human whole blood. A panel of prostate cancer-specific proteins were identified and quantified, which was used to differentiate between spiked CTCs and white blood cells.
Graphical Abstract
Circulating tumor cells (CTCs), which originate in primary tumors or metastases and circulate in blood vessels, may extravasate at distant tissues to form metastatic tumors.1 High CTC counts are usually correlated with aggressive and metastatic cancer.2,3 Multiplexed molecular characterization of CTC protein profiles would add considerably to the understanding of cancer progression.
Because no whole-proteome amplification method is available, multiplexed protein analysis of single CTCs is very challenging. Conventional immunofluorescence assays are limited to measuring a handful of proteins in single cells due to spectral overlap. Microfluidics-based immunofluorescence techniques have enabled simultaneous detection of up to 42 secreted proteins from single cells by combining spatial and spectral encoding approaches.4 A similar approach was applied to profile a panel of proteins from CTCs, and its ability to distinguish CTCs from leukocytes and determine their tumor of origin were demonstrated.5 Microfluidic Western blotting has provided another way for multiplexed protein measurement from single CTCs by integrating electrophoretic separations and multiple-cycle immunoassays.6 A panel of 12 protein markers from patient-derived CTCs was quantified, and two distinct CTC subpopulations from breast cancer were identified. However, these immunoassay-based approaches shared common limitations including small numbers of proteins, limited specificity and availability of antibodies, and the inability to work in an untargeted or discovery mode.
Although mass spectrometry (MS)-based proteomics has been developed to quantify thousands of proteins in a label-free fashion,7 the application of MS proteomics to study rare CTCs has been precluded by limited analytical sensitivity. Recently, proteomic sensitivity was significantly improved through the use of nanoflow chemical separations,8–10 high performance ion optics and detectors,11 and low-loss sample preparation.12,13 Nemes and co-workers developed a capillary electrophoresis–mass spectrometry (CE-MS) platform to measure protein expression in single blastomeres from frog embryo, and significant heterogeneity was observed.14 Li et al.10 developed an ultralow-flow liquid chromatography (LC)-MS system to analyze low numbers of MCF-7 cells isolated from human blood. Approximate 2500 proteins were identified by injecting an aliquot of digested lysate corresponding to 122 cells. Recently, we developed a microfluidic platform termed Nanodroplet Processing in One pot for Trace Samples (nanoPOTS),13 which enhanced overall sensitivity by significantly minimizing protein and peptide losses during sample preparation. When combined with ultrasensitive nanoLC-MS,9 the platform was able to profile ~3000 proteins from as few as 10 HeLa cells,13 and nearly 700 proteins from single HeLa cells.15 Together, these works suggest that MS-based proteomics holds great potential to provide insight into protein expression signatures from previously inaccessible small samples.
Here we report an integrated workflow to study protein expression in rare or single CTCs spiked into whole blood. The workflow combined negative enrichment,16 laser capture microdissection (LCM)-based cell purification,17 nanoPOTS sample preparation, and ultrasensitive nanoLC-MS analysis.13 We show that the coupling of negative enrichment with LCM could efficiently obtain highly purified CTCs from human whole blood, which could then be transferred to nanowells for sensitive and untargeted proteomic analysis.
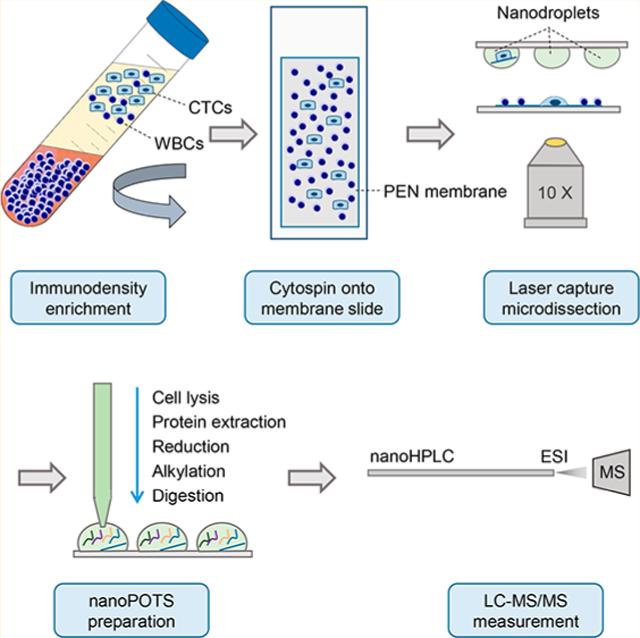
The overall workflow is shown in Figure 1. As a proof-of-concept study, we spiked 5 × 10⁵ LNCaP cells into 7 mL of human whole blood, resulting in a concentration of ~7000 cells/mL. The blood sample was processed with a RosetteSep CTC enrichment kit (no. 15137C, STEMCELL Technologies). White blood cells (WBCs) were cross-linked with red blood cells (RBCs) and separated from CTCs during density gradient centrifugation (Figure 1a). After RBC lysis and fixation, the remaining cells were deposited onto PEN membrane slides (Carl Zeiss Microscopy) with the use of a Cytospin 4 (Thermo Scientific) (Figure 1b). To differentiate LNCaP cells from remaining WBCs, the slides were stained with anti-EpCAM (green) and anti-CD45 (red) antibodies. LCM was used to identify cells based on fluorescence staining, excise the surrounding membranes, and transfer the CTC-containing membranes into nanowells (Figure 1c) by laser-pressure catapulting. Cell lysis and protein extraction, denaturation, alkylation, and tryptic digestion were performed using the nanoPOTS platform (Figure 1d).13 Finally, cell digest was purified by solid phase extraction (SPE) and analyzed by nanoLC-MS/MS (Figure 1e).
Figure 1.
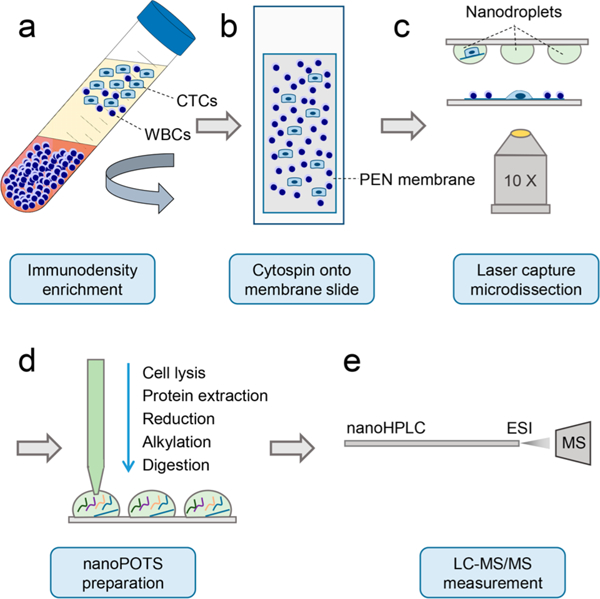
Workflow for isolation and proteomic analysis of spiked CTCs.
The negative CTC enrichment approach has been previously demonstrated to deplete WBCs by >3 orders of magnitude in an unbiased fashion, and multiple spike-in experiments have suggested that an average of 38% of CTCs can be recovered using this procedure.16 In this work, LCM further purified CTCs from remaining WBCs and collected defined numbers of cells for proteomic analysis (Figure 2).Over 90% collection efficiency was achieved in triplicate collection of 10 single LNCaP cells into nanowells (10/10, 9/ 10, and 9/10), with the two failed transfers resulting from errant trajectories during laser-pressure catapulting into nanowells.
Figure 2.
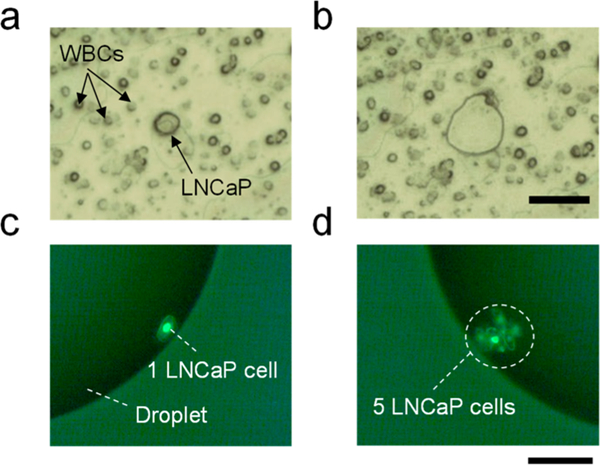
(a) Brightfield microscopic images showing a spiked CTC cell (LNCaP) surrounded by WBCs on a PEN membrane slide after negative enrichment. (b) PEN membrane slide after LCM removal of the single LNCaP cell. Scale bar is 50 μm. (c, d) Fluorescence images showing (c) one and (d) five LNCaP cells collected into nanodroplets. Scale bar is 150 μm. The cell number was determined by refocusing the microscope and identifying each cell individually.
We evaluated the sensitivity of the present workflow by analyzing triplicate samples comprising 10 WBCs, 5 LNCaP cells, and 1 LNCaP cell, all of which were isolated from whole blood. One sample containing 10 LNCaP cells was also analyzed for use as a library to transfer identifications using MaxQuant’s Match Between Runs (MBR) algorithm.9,13,18 We identified an average of 589, 1480, and 293 unique peptides, corresponding to 265, 607, and 164 protein groups for triplicate analysis of 10 WBCs, 5 LNCaP cells, and 1 LNCaP cell, respectively (Figure 3c,d). Venn diagrams showed 53%, 75%, and 38% of the proteins were common in each cell group (Figure S1). Among the protein identifications, both WBCs and LNCaP cells highly expressed a panel of housekeeping proteins including histones (HIST1H2AJ, HIST1H2BL, HIST2H3A, HIST1H4A), actin (ACTG1), tubulin (TUBB), and glyceraldehyde-3-phosphate dehydrogenase (GAPDH). However, LNCaP cells can be easily differentiated from WBCs by a panel of prostate and epithelium-specific proteins including prostate-specific antigen (KLK3) and cytokeratins (KRT8, KRT 18) (Figure 3c,d). We were able to identify 3 out of 9 protein markers (KRT8, KRT18, and HSPD1) associated with highly progressive prostate cancer.19 Despite this, additional sensitivity improvements are clearly required to increase proteome coverage and enable the detection of more prostate cancer-associated protein makers such as AMACR, PSMA, and EZH2.20
Figure 3.
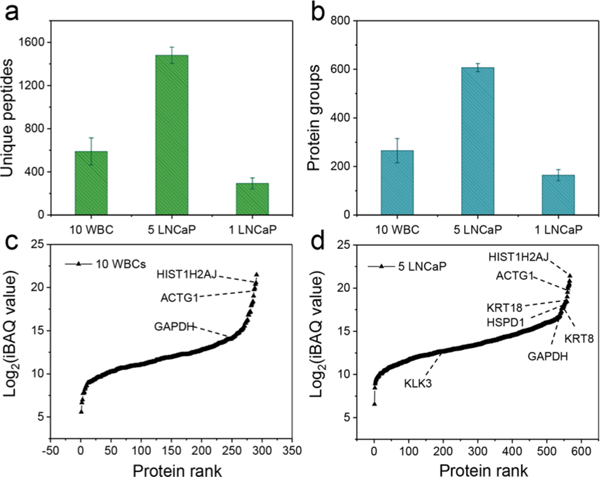
Evaluation of the sensitivity of the proteomic workflow for CTCs. (a) Number of unique peptides and (b) protein groups identified from 10 WBCs, 5 LNCaP cells, and 1 LNCaP cell. Error bars represent standard deviations. Identified proteins ranked according by abundance based on MS1 intensity (log2 iBAQ values) for 10 WBCs (c) and 5 LNCaP cells (d).
We next evaluated whether LNCaP cells could be quantitatively differentiated from WBCs cells based on label-free protein quantification. Protein abundance was estimated with iBAQ (Intensity-Based Absolute Quantification).21 We plotted a panel of proteins including two housekeeping proteins (ACTG1 and HIST1H4A) and four prostate -cancer-specific proteins (KRT18, KRT8, HSPD1, and KLK3) (Figure 4). Reproducible protein abundance measurements with RSDs in the range of 1.3% to 8.0% were obtained. For housekeeping proteins, 10 WBC samples and 5 LNCaP cell samples had similar iBAQ values without significant differences (p > 0.05). Three prostate cancer-specific proteins were detected with valid iBAQ values in both the 5 LNCaP and 1 LNCaP cell samples, while KLK3 (prostate-specific antigen) was only detected in 5 LNCaP cells. Interestingly, although only a small number of cells was analyzed, the protein abundances were still proportional to cell numbers. The average difference in log2-transformed iBAQ values between 5 LNCaP cells and 1 LNCaP cell were 3.43, 3.24, 3.60, 3.53, and 3.43 for ACTG1, HIST1H4A, KRT18, KRT8, and HSPD1, respectively. Together, these results demonstrate the present system is able to quantify protein expression using few or even single CTCs.
Figure 4.
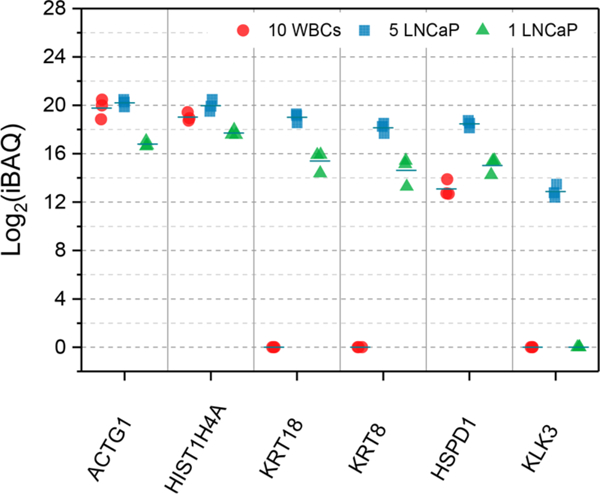
Measurement of protein abundances among 10 white blood cells (WBCs), 5 LNCaP cells, and 1 LNCaP cell. Undetected proteins are indicated with a 0 value.
In summary, we have demonstrated the feasibility of proteome profiling of spiked CTCs from whole blood by integrating negative immunodepletion, LCM and nanoPOTS-based sample preparation. We also demonstrated that label-free protein quantification can be used to differentiate CTCs from WBCs. Further refinement of the platform will include improving CTC recovery from much smaller starting concentrations using microfluidic techniques,22 commercial platforms that isolate single CTCs, or automated whole-slide scanning and isolation by LCM. In addition, proteome coverage will be increased through further optimization of nanoPOTS sample preparation and additional improvements to nanoLC23 and MS. With these advances, we anticipate MS-based proteomics can become a valuable tool for investigating tumor response to therapy and deciphering the molecular mechanism of tumor metastasis.
Supplementary Material
ACKNOWLEDGMENTS
This work was supported by NIH Grants R33 CA225248 (R.T.K.) and R21 EB020976 (R.T.K.), the Pacific Northwest Prostate Cancer Grant SPORE/NCI P50 CA097186 (G.V.T), the OHSU-Knight Cancer Institute (G.V.T), Earth & Biological Sciences Directorate Mission Seed under the Laboratory Directed Research and Development Program at PNNL (Y.Z.), and the Precision Medicine Innovation Co-Laboratory (PMedIC), a joint research collaboration of OHSU and PNNL. A portion of this research was performed using EMSL, a national scientific user facility sponsored by the Department of Energy’s Office of Biological and Environmental Research and located at PNNL.
Footnotes
ASSOCIATED CONTENT
Supporting Information
The Supporting Information is available free of charge on the ACS Publications website at DOI: 10.1021/acs.anal-chem.8b03268.
Detailed description of experimental procedures including cell culture, cell spike-in, enrichment and collection, proteomic sample preparation, LC-MS/MS setup and data analysis; Figure S1, overlap of protein group identifications from similar cell groups, and table listing proteins identified from WBCs and LNCaP cells with the corresponding log2-transformed iBAQ values (PDF)
The authors declare no competing financial interest.
REFERENCES
- (1).Plaks V; Koopman CD; Werb Z Science 2013, 341 (6151), 1186–1188. [DOI] [PMC free article] [PubMed] [Google Scholar]
- (2).Cristofanilli M; Budd GT; Ellis MJ; Stopeck A; Matera J; Miller MC; Reuben JM; Doyle GV; Allard WJ; Terstappen LWMM; Hayes DF N. Engl. J. Med. 2004, 351 (8), 781–791. [DOI] [PubMed] [Google Scholar]
- (3).Pantel K; Deneve E; Nocca D; Coffy A; Vendrell J-P; Maudelonde T; Riethdorf S; Alix-Panabieres C Clin. Chem. 2012, 58 (5), 936–940. [DOI] [PubMed] [Google Scholar]
- (4).Lu Y; Xue Q; Eisele MR; Sulistijo ES; Brower K; Han L; Amir ED; Pe’er D; Miller-Jensen K; Fan R Proc. Natl. Acad. Sci. U. S. A. 2015, 112 (7), E607–E615. [DOI] [PMC free article] [PubMed] [Google Scholar]
- (5).Yang L; Wang Z; Deng Y; Li Y; Wei W; Shi Q Anal. Chem. 2016, 88 (22), 11077–11083. [DOI] [PMC free article] [PubMed] [Google Scholar]
- (6).Sinkala E; Sollier-Christen E; Renier C; Rosàs-Canyelles E; Che J; Heirich K; Duncombe TA; Vlassakis J; Yamauchi KA; Huang H; Jeffrey SS; Herr AE Nat. Commun. 2017, 8, 14622. [DOI] [PMC free article] [PubMed] [Google Scholar]
- (7).Mann M; Kulak NA; Nagaraj N; Cox J Mol. Cell 2013, 49 (4), 583–590. [DOI] [PubMed] [Google Scholar]
- (8).Sun L; Zhu G; Zhao Y; Yan X; Mou S; Dovichi N Angew. Chem., Int. Ed. 2013, 52 (51), 13661–13664. [DOI] [PMC free article] [PubMed] [Google Scholar]
- (9).Zhu Y; Zhao R; Piehowski PD; Moore RJ; Lim S; Orphan VJ; Pasa-Tolic L; Qian WJ; Smith RD; Kelly RT Int. J. Mass Spectrom. 2018, 427, 4–10. [DOI] [PMC free article] [PubMed] [Google Scholar]
- (10).Li S; Plouffe BD; Belov AM; Ray S; Wang X; Murthy SK; Karger BL; Ivanov A R Mol. Cell. Proteomics 2015, 14 (6), 1672–1683. [DOI] [PMC free article] [PubMed] [Google Scholar]
- (11).Kelly RT; Tolmachev AV; Page JS; Tang K; Smith RD Mass Spectrom. Rev. 2010, 29 (2), 294–312. [DOI] [PMC free article] [PubMed] [Google Scholar]
- (12).Hughes CS; Foehr S; Garfield DA; Furlong EE; Steinmetz LM; Krijgsveld J Mol. Syst. Biol. 2014, 10 (10), 757–758. [DOI] [PMC free article] [PubMed] [Google Scholar]
- (13).Zhu Y; Piehowski PD; Zhao R; Chen J; Shen Y; Moore RJ; Shukla AK; Petyuk VA; Campbell-Thompson M; Mathews CE; Smith RD; Qian WJ; Kelly RT Nat. Commun. 2018, 9 (1), 882. [DOI] [PMC free article] [PubMed] [Google Scholar]
- (14).Lombard-Banek C; Moody SA; Nemes P Angew. Chem., Int. Ed. 2016, 55 (7), 2454–2458. [DOI] [PMC free article] [PubMed] [Google Scholar]
- (15).Zhu Y; Clair G; Chrisler WB; Shen Y; Zhao R; Shukla AK; Moore RJ; Misra RS; Pryhuber GS; Smith RD; Ansong C; Kelly RT Angew. Chem., Int. Ed. 2018, 57, 12370–12374. [DOI] [PMC free article] [PubMed] [Google Scholar]
- (16).Podolak J; Eilers K; Newby T; Slottke R; Tucker E; Olson SB; Lue H-W; Youngren J; Aggarwal R; Small EJ; Graff JN; Alumkal JJ; Beer TM; Thomas GV Oncotarget 2017, 8 (42), 71447–71455. [DOI] [PMC free article] [PubMed] [Google Scholar]
- (17).Zhu Y; Dou M; Piehowski PD; Liang Y; Wang F; Chu RK; Chrisler WB; Smith JN; Schwarz KC; Shen Y; Shukla AK; Moore RJ ; Smith RD; Qian W-J; Kelly RT Mol. Cell. Proteomics 2018, 17 (9), 1864–1874. [DOI] [PMC free article] [PubMed] [Google Scholar]
- (18).Tyanova S; Temu T; Cox J Nat. Protoc. 2016, 11 (12), 2301–2319. [DOI] [PubMed] [Google Scholar]
- (19).Lexander H; Palmberg C; Hellman U; Auer G; Hellstrom M; Franzén B; Jörnvall H; Egevad L Proteomics 2006, 6 (15), 4370–4380. [DOI] [PubMed] [Google Scholar]
- (20).Tanase CP; Codrici E; Popescu ID; Mihai S; Enciu AM; Necula LG; Preda A; Ismail G; Albulescu R Oncotarget 2017, 8 (11), 18497–18512. [DOI] [PMC free article] [PubMed] [Google Scholar]
- (21).Schwanhäusser B; Busse D; Li N; Dittmar G; Schuchhardt J; Wolf J; Chen W; Selbach M Nature 2011, 473 (7347), 337–342. [DOI] [PubMed] [Google Scholar]
- (22).Ozkumur E; Shah AM; Ciciliano JC; Emmink BL; Miyamoto DT; Brachtel E; Yu M; Chen P; Morgan B; Trautwein J; Kimura A; Sengupta S; Stott SL; Karabacak NM; Barber TA; Walsh JR; Smith K; Spuhler PS; Sullivan JP; Lee RJ; Ting DT; Luo X; Shaw AT; Bardia A; Sequist LV; Louis DN; Maheswaran S; Kapur R; Haber DA Sci. Transl. Med. 2013, 5 (179), 1–20. [DOI] [PMC free article] [PubMed] [Google Scholar]
- (23).Shen Y; Tolić N; Masselon C; Paša-Tolić L; Camp DG; Hixson KK; Zhao R; Anderson GA; Smith RD Anal. Chem. 2004, 76 (1), 144–154. [DOI] [PubMed] [Google Scholar]
Associated Data
This section collects any data citations, data availability statements, or supplementary materials included in this article.