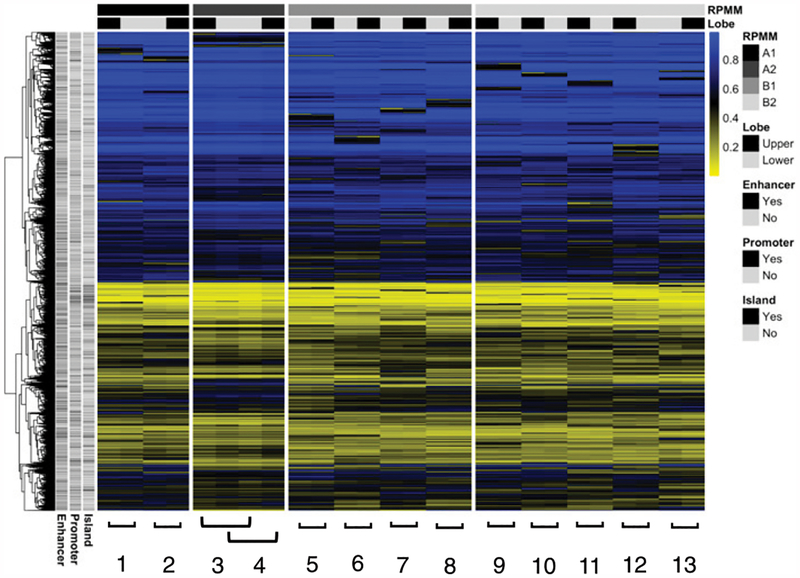
FIGURE 1. Unsupervised clustering analysis, upper lobe versus lower lobe macrophages.
RPMM of the 10,000 CpGs (rows) with greatest sample variance across subjects. Individual subjects 1–13 are shown in columns with sample status bar at top: black (upper) and gray (lower). Blue color represents increased sample methylation.

