Abstract
Background
The ablation index (AI) is reported to be useful for a durable pulmonary vein isolation (PVI). However, there have been no studies investigating the relationship between the power, contact force (CF), AI, and steam pops.
Methods
Using an in vitro model, ablation energy was delivered until a steam pop occurred and the time to the steam pop and AI when the steam pop occurred were measured. The experiment was performed with a combination of various powers (20, 30, 40, and 50 W) and contact forces (CFs) (10, 30, and 50 g) 20 times for each setting. The analysis consisted of two protocols. The first protocol was a comparison between the ablation power and several parameters under the same CF (10, 30, and 50 g). The second protocol was a comparison between the CF and several parameters under the same power (20, 30, 40, and 50 W). The correlation between the lesion formation and ablation parameters was evaluated.
Results
The AI value when steam pops occurred varied depending on the ablation settings. All AI median values were <500 under an ablation power of 50 W. On other hand, the median ablation time up to the steam pop was more than 46 seconds, but all median values of the AI were more than 550 under an ablation with 20 W.
Conclusions
The AI cannot predict steam pops. A low power and long duration ablation could obtain a high AI value. However, high‐power ablation could not obtain a high AI value because of an early occurrence of steam pops.
Keywords: ablation index, Catheter ablation, lesion size, radiofrequency, steam pop
1. INTRODUCTION
Pulmonary vein isolation (PVI) has become the cornerstone of the treatment of atrial fibrillation (AF).1 Reconnections between the PVs and left atrium result in recurrence of all types of AF following an initially successful AF ablation procedure.2, 3, 4 Hence, a durable PVI is necessary to prevent arrhythmia recurrence. However, the proportion of PVs remaining chronically isolated following radiofrequency ablation has remained low.5, 6 From this point, the ablation index (AI), a novel ablation quality marker incorporating contact force (CF), time, and power in a weighted formula, has been reported to be useful for a durable PVI.7, 8, 9, 10 A long duration of energy deliveries, high power, and high CF enable obtaining a higher AI. The use of higher power implies that lesions can be deployed with a relatively short application time,11 therefore, several operators use a higher power for the PVI. In recent days, a high power and short duration (HP‐SD) ablation has also been reported to be useful to produce an improved lesion‐to‐lesion uniformity, linear contiguity, and transmurality.12 However, a high power and high CF increase the incidence of steam pops,13, 14, 15 which are related to cardiac tamponade. Once cardiac tamponade occurs, the procedure must be interrupted or ended because of safety issues. Steam pops should be avoided for a durable PVI and safe procedure. Impedance decreases could predict the incidence of steam pops.16 However, to the best of our knowledge there have been no studies investigating the relationship between the AI, time, power, CF, and steam pops. The aim of this study was to investigate the influence of the power, CF for steam pops, and AI at the time of the steam pops and their effect on the lesion formation.
2. METHODS
2.1. In vitro ablation model
Figure 1A shows an in vitro experimental model. This model consisted of normal saline with a circulating pump and thermometer. The temperature of the normal saline was maintained at 37℃. The excised swine heart, which was commercially obtained, was fixed on a rubber plate. A SmartTouch SF ablation catheter (Biosense Webster, Diamond Bar, CA) was stabilized manually in a plastic pipe oriented perpendicular to the tissue. The catheter stability was observed by using a CARTO3 system (Figure 1B). The Visitag® setting was as follows: stability max range, 2 mm; stability minimum time, 3 seconds; minimum force, 3 g; and force overtime, 25%.
Figure 1.
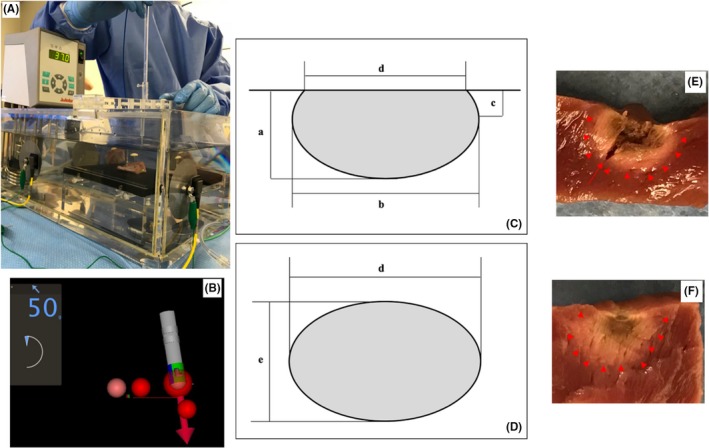
In vitro experiment model. This model consisted of normal saline with a circulating pump and thermometer. The temperature of the normal saline was maintained at 37℃. The excised swine heart was fixed on a rubber plate and an ablation catheter was stabilized in a plastic pipe (A). The catheter stability was observed using a CARTO3 system (B). The lesion volume was calculated as: volume = (1/6)×π×(a×b2+c×d2/2) (C), lesion surface area = π×d/2 × e/2. (D) The lesion border was defined as the change in the tissue color (E,F arrowhead). (E) shows the actual image of an ablation lesion with a steam pop and the red arrow shows a tissue tear
2.2. Protocol
The experiment was performed by a combination of various power (20, 30, 40, and 50 W) and various CF (10, 30, and 50 g) settings. The analysis consisted of two protocols. The first protocol was a comparison between the ablation power and several parameters under the same CF setting (10, 30, and 50g). The second protocol was a comparison between the contact force and several parameters under the same power setting (20, 30, 40, and 50 W).
Steam pops were defined as audible pops. With each protocol, the ablation energy was delivered until a steam pop occurred and the time to the steam pop and AI at the time of the steam pop were measured. The ablation at each setting was repeated 20 times and all data were recorded. The ablation power was delivered for 120 seconds when steam pops did not occur. The correlation between the lesion formation and ablation parameters was evaluated.
2.3. Lesion size measurements
The maximum depth (a), maximum diameter (b), depth at the maximum diameter (c), surface maximum diameter (d), and surface minimum diameter (e) of the lesion were measured (Figure 1C,D). The lesion border was defined as a change in the tissue color (Figure 1E,F arrowhead). Figure 1E shows the actual image of the ablation lesion with a steam pop and the red arrow shows a tissue tear. The tissue tear was not included in the lesion volume. Figure 1F shows a lesion without a steam pop and no tissue tear was observed. The lesion volume was calculated as: volume = (1/6)×π×(a×b2+c×d2/2).17 The lesion surface area was calculated as: lesion surface area = π×d/2 × e/2.
2.4. Statistical analyses
The statistical analyses were performed using JMP® Pro, version 11.2 software (SAS Institute). The continuous variables were compared using a t test for parametric data. A Bonferroni correction was performed for multiple comparisons. A correlation analysis was performed. A value of P < 0.05 indicated statistical significance.
3. RESULTS
3.1. Correlation between the lesion formation and AI
Figure 2 shows the correlation between the AI and lesion formation. The white squares show the lesions without steam pops. The AI correlated well with the lesion volume and lesion maximum depth (AI vs lesion volume, r = 0.5506, P < 0.0001; AI vs lesion depth, r = 0.5049, P < 0.0001). However, there was no correlative relationship between the AI and lesion surface area (AI vs lesion surface area, r = −0.0879, P = 0.1745).
Figure 2.
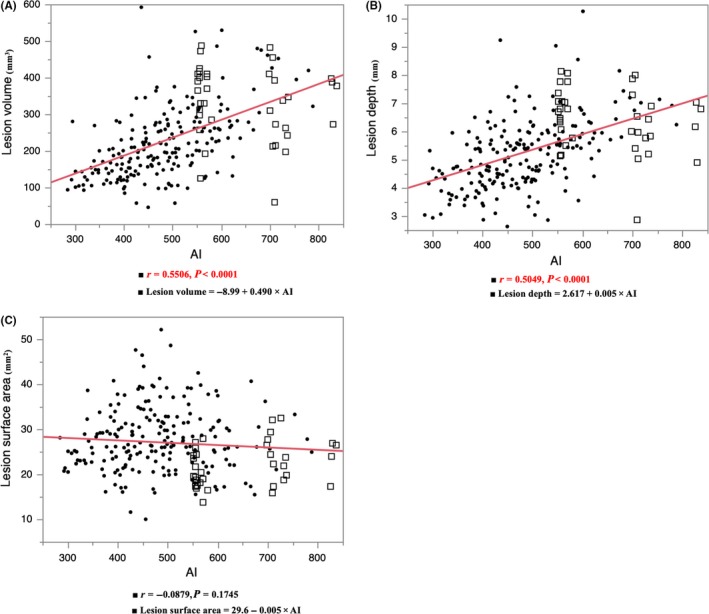
The correlation between the ablation index (AI) and lesion formation. The AI correlated with the lesion volume and lesion maximum depth. The closed circles show the points with steam pops and the white squares show no pops
3.2. Correlation between the time, AI, and power under the same contact
Figure 3 shows the correlation between the time to the steam pop, AI at the time of the steam pop, and power under the same CF. The time to the steam pop decreased in proportion to the power (time to the steam pop; 10 g, r = −0.7465, P < 0.0001; 30 g, r = −0.6867, P < 0.0001; 50 g, r = −0.6794, P < 0.0001). The AI at the time of the steam pop also decreased in proportion to the power (AI at the pop; 10 g, r = −0.4745, P = 0.0006; 30 g, r = −0.3388, P = 0.0026; 50 g, r = −0.3944, P = 0.0004).
Figure 3.
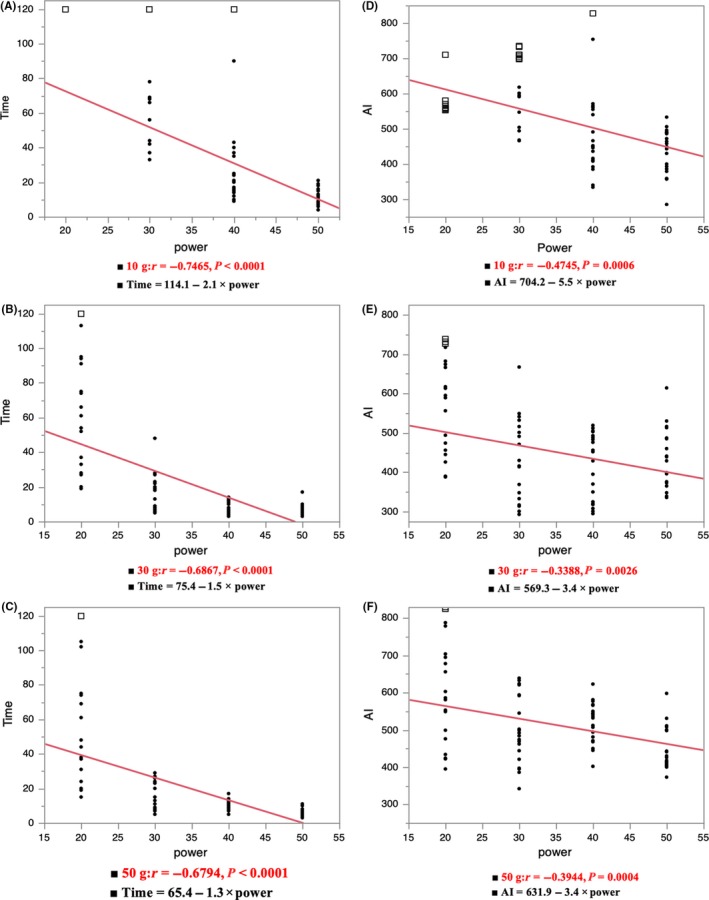
The correlation between the time to the steam pop, AI at the time of the steam pop, and power under the same contact force (CF) (A, D 10 g; B, E 30 g; C, F 50 g). The closed circles show the points with steam pops and the white squares show no pops
3.3. Correlation between the time, AI, and CF under the same power
Figure 4 shows the correlation between the time to the steam pop, AI at the time of the steam pop, and CF under the same power. The time to the steam pop under an ablation power of 30, 40, and 50 W decreased in proportion to the CF (Time to the pop; 20 W, r = −0.1521, P = 0.390; 30 W, r = −0.6710, P < 0.0001; 40 W, r = −0.4832, P < 0.0001; 50 W, r = −0.6068, P < 0.0001). However, the AI at the time of the steam pop had no correlation to the CF (AI at the pop; 20 W, r = 0.1253, P = 0.4800; 30 W, r = −0.0576, P = 0.6911; 40 W, r = 0.2196, P = 0.0946; 50 W, r = 0.1426, P = 0.2771).
Figure 4.
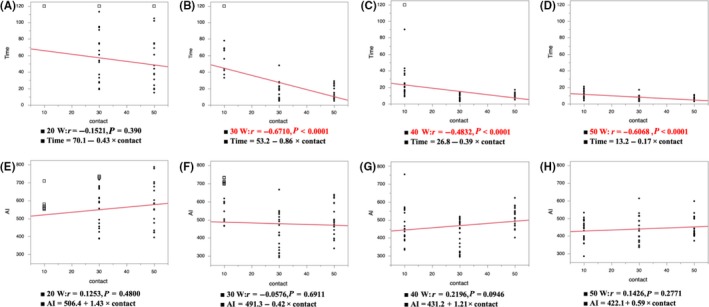
The correlation between the time to the steam pop, AI at the time of the steam pop, and CF under the same power (A, E 20 W; B, F 30 W; C, G 40 W; D, H 50 W). The closed circles show the points with steam pops and the white squares show no pops
3.4. Comparison of the lesion size with each CF and each power setting
Figure 5A‐C show the average size of the lesion formation under the same CF (Lesion volume, mm3; 10 g, 283.7 ± 123.8; 30 g, 222.3 ± 86.6; 50 g, 207.9 ± 88.5. Lesion depth, mm; 10 g, 5.9 ± 1.5; 30 g, 5.1 ± 1.1; 50 g, 5.1 ± 1.0. Lesion surface area, mm2; 10 g, 28.5 ± 7.9; 30 g, 25.1 ± 7.0: 50 g, 27.3 ± 6.1). The lesion volume for a CF of 10 g was significantly larger than that for the other CFs (30, 50 g) (10 vs 30 g P = 0.0005, 10 vs 50 g P < 0.0001, 30 vs 50 g P = 0.64). The lesion depth under a CF of 10 g was also significantly deeper than that for the other CFs (30, 50 g) (10 vs 30 g P = 0.0002, 10 vs 50 g P < 0.0001, 30 vs 50 g P = 0.91). The lesion surface area under a CF of 10 g was larger than that for 30 g (10 vs 30 g P = 0.0057, 10 vs 50 g P = 0.52, 30 vs 50 g P = 0.11).
Figure 5.
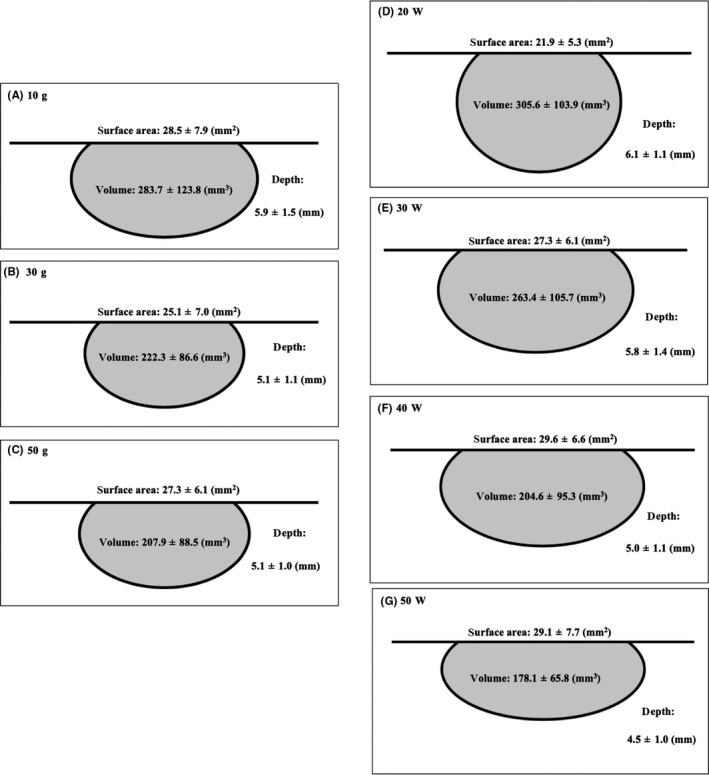
The average size of the lesion formation under the same CF (A 10 g; B 30 g; C 50 g). The average size of the lesion formation under the same power setting (D 20 W; E 30 W; F 40 W; G 50 W). The continuous variables are shown as the mean ± SD
Figure 5D‐G show the average size of the lesion formation under the same power (Lesion volume, mm3; 20 W, 305.6 ± 103.9; 30 W, 263.4 ± 105.7; 40 W, 204.6 ± 95.3; 50 W, 178.1 ± 65.8. Lesion depth, mm; 20 W, 6.1 ± 1.1; 30 W, 5.8 ± 1.4; 40 W, 5.0 ± 1.1; 50 W, 4.5 ± 1.0. Lesion surface area, mm2; 20 W, 21.9 ± 5.3; 30 W, 27.3 ± 6.1; 40 W, 29.6 ± 6.6; 50 W, 29.1 ± 7.7). The lesion volume for a power of 20/30 W was significantly larger than that for 40/50 W (20 vs 30 W P = 0.0698, 20 vs 40 W P < 0.0001, 20 vs 50 W P < 0.0001, 30 vs 40 W P = 0.0040, 30 vs 50 W P < 0.0001, 40 vs 50 W P = 0.4143). The lesion depth for a power of 20/30 W was significantly deeper than that for 40/50 W (20 vs 30 W P = 0.5003, 20 vs 40 W P < 0.0001, 20 vs 50 W P < 0.0001, 30 vs 40 W P = 0.0009, 30 vs 50 W P < 0.0001, 40 vs 50 W P = 0.1812). The lesion surface area for a power of 20 W was significantly smaller than that for 30/40/50 W (20 vs 30 W P < 0.0001, 20 vs 40 W P < 0.0001, 20 vs 50 W P < 0.0001, 30 vs 40 W P = 0.1916, 30 vs 50 W P = 0.3898, 40 vs 50 W P = 0.9760).
3.5. Correlation between the impedance drop, power, and CF during steam pops
Figure 6A‐C show the correlation between the impedance drop and power under the same CF. The impedance drop during the steam pop under the same CFs of 30 and 50 g increased in proportion to the power (Impedance drop to the steam pop; 10 g, r = 0.0629, P = 0.670; 30 g, r = 0.4451, P = 0.0002; 50 g, r = 0.4780, P < 0.0001). Figure 6D‐G show the correlation between the impedance drop and CF under the same power. The impedance drop during the steam pop under the same power of 30, 40, and 50 W increased in proportion to the CF (Impedance to the pop; 20 W, r = 0.3217, P = 0.0635; 30 W, r = 0.6584, P < 0.0001; 40 W, r = 0.7938, P < 0.0001; 50 W, r = 0.7100, P < 0.0001). The level of the impedance drop to the steam pops differed according to the ablation settings.
Figure 6.
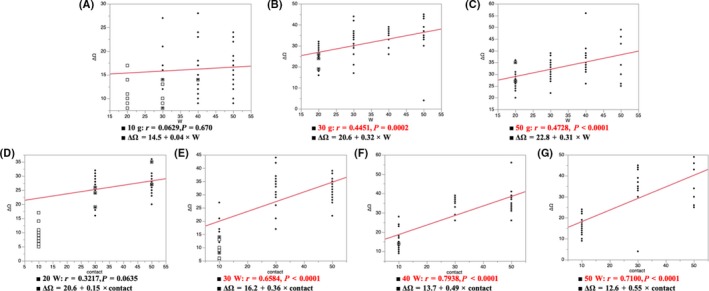
A‐C show the correlation between the impedance drop and power under the same CF. D‐G show the correlation between the impedance drop and CF under the same power. The impedance drop level to the steam pops differed according to the ablation settings
3.6. Influence of the CF, power, time, and AI on the steam pops
Figure 7A,B show a comparison between the time to the steam pop, AI at the time of the steam pop, CF, and power under all conditions. The average AI at the time of the steam pop was as follows: median (IQR): 10 g‐20 W, 557.5 (555.8/567.0); 10 g‐30 W, 658 (589.0/706.8); 10 g‐40 W, 451.0 (410.3/556.5); 10 g‐50 W, 446.0 (384.3/486.8), 30 g‐20 W, 592.0 (469.5/676.9); 30 g‐30 W, 420.5 (344.3/504.8); 30 g‐40 W, 440.5 (323.8/489.3); 30 g‐50 W, 414.0 (371.0/485.5); 50 g‐20 W, 594.5 (493.3/722.8); 50 g‐30 W, 488.0 (438.3/592.5); 50 g‐40 W, 534.0 (478.5/554.0); and 50 g‐50 W, 428.0 (409.3/502.0). The average time to the steam pop was as follows: seconds; 10 g‐20 W, 120 (NA); 10 g‐30 W, 99.0 (63.5/120.0); 10 g‐40 W, 20.5 (15.8/35.5); 10 g‐50 W, 12.5 (9.0/16.0); 30 g‐20 W, 63.5 (33.0/94.3); 30 g‐30 W, 13.0 (7.8/20.5); 30 g‐40 W, 9.0 (4.0/12.0); 30 g‐50 W, 5.5 (4.0/8.0); 50 g‐20 W, 46.0 (29.3/81.8); 50 g‐30 W, 13.0 (10.5/23.3); 50 g‐40 W, 10.5 (8.0/12.0); and 50 g‐50 W, 4.0 (4.0/7.0). The number of cases that had steam pops was as follows (Figure 7C): n/20 (%); 10 g‐20 W, 0/20 (0); 10 g‐30 W, 10/20 (50); 10 g‐40 W, 19/20 (95); 10 g‐50 W, 20/20 (100); 30 g‐20 W, 17/20 (85); 30 g‐30 W, 20/20 (100); 30 g‐40 W, 20/20 (100); 30 g‐50 W, 20/20 (100); 50 g‐20 W, 17/20 (85); 50 g‐30 W, 20/20 (100); 50 g‐40 W, 20/20 (100); and 50 g‐50 W, 20/20 (100). The median value of the AI, for which ablation energy was delivered until a steam pop occurred, was highest with the following settings for each CF: 10 g‐30 W, 30 g‐20 W, and 50 g‐20 W. All median values of the AI were less than 500 under an ablation power of 50 W. On the other hand, the median ablation time up to the steam pop was more than 46 seconds, but all the median values of the AI were more than 550 under an ablation of 20 W.
Figure 7.
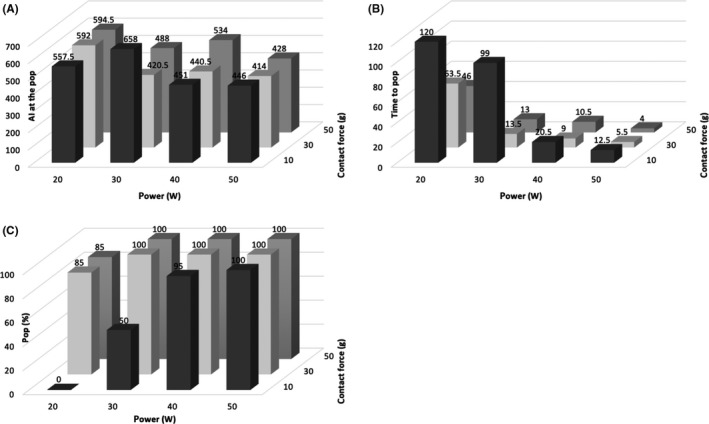
A,B show a comparison between the time to the steam pop, AI at the time of the steam pop, CF, and power under all conditions. C, shows the proportion of the cases that had steam pops. The continuous variables are shown as the median
4. DISCUSSION
4.1. Major findings
The major findings of this study were as follows. First, the value of the AI and impedance drop at the time of the steam pop varied according to the different ablation settings. Therefore, the AI and impedance drop could not predict steam pops. Second, the AI correlated well with the lesion volume and lesion depth. However, the AI did not correlate with the lesion surface area. Third, a low power and long duration ablation could obtain a high AI value. On the other hand, a high‐power ablation could not obtain a high AI value because of the early occurrence of steam pops.
4.2. Relationship between the lesion formation and AI
The AI correlated well with the lesion depth and lesion volume. A long ablation with a power of 20 W was useful to obtain a high AI value, however, the lesion surface area with a power of 20 W was smaller than that for the other powers. Ablation lesions are formed by resistive heat and conductive heat.12 Conductive heat is time dependent and creates tissue injury in deep layers. Low power heats the tissue temperature slowly and enables long duration energy deliveries. This phenomenon could be related to the high AI value with a power of 20 W. High‐power energy results in a larger zone that is heated from the catheter during the resistive phase. Therefore, ablation with 40 or 50 W could ablate a large surface area.
Deep lesions are not always necessary for AF ablation because of the thin wall of the atrial muscle. Considering the small lesion surface area created with 20 W, the power energy should be higher than 30 W to create a large lesion surface area. Ablation settings of 10 g‐40 W or 10 g‐50 W could obtain a large surface area. This setting could shorten the energy deliver time of atrial ablation. However, a long duration ablation with a power of 20 W may be useful for ablation of ventricular muscle because of the greater thickness of the ventricle muscle.
4.3. Relationship between the steam pops and impedance drop and AI
Our results suggested that a higher power setting resulted in a much shorter duration of the delivery time to the steam pop. This could result in a negative relationship between the power and lesion volume and lesion depth. However, the AI at the time of the steam pop did not correlate with the CF. The AI was calculated by the CF, time, and power in a weighted formula. The CF was considered to be less weighted than the power to calculate the AI. Therefore, the AI did not correlate with the CF.
Previous reports stated that significant impedance changes occur immediately before the occurrence of a pop.18 Our results also suggested that impedance changes occurred before the steam pops. However, the degree of the impedance drops differed according to the ablation settings. Higher power ablation is reported to result in a larger impedance drop than a conventional ablation.12 This could be related to the correlation to the impedance change.
4.4. High‐power short duration ablation
High‐power ablation has been reported to be useful for producing an improved lesion‐to‐lesion uniformity, linear contiguity, and transmurality.8 However, there have been few reports about the safety of the HP‐SD ablation. Our results suggest that a high CF (30/50 g) with a high power (40/50 W) would be related to steam pops occurring with a short duration. When the ablation energy was set at 40 or 50 W, the CF should be less than 30 g. HP‐SD could obtain a high AI value within a short duration, however the maximum value of the AI was lower than that of the low power and long duration. When a deep lesion was needed, the HP‐SD would not be preferable from a safety aspect.
4.5. Clinical implications
The AI has been reported to be useful for creating a durable PVI. However, few data are available on the detailed settings required for a safe AI‐guided ablation setting. Our results suggested that a deep lesion could be obtained under a low power and long duration setting and a wide lesion could be obtained under a high power and short duration setting. Care should be given to the ablation setting when we use a high CF and high power.
4.6. Study limitations
Our study was performed with an in vitro experimental model, and hence, the results would differ from those in the clinical setting. In the clinical setting, the catheter stability would not be constant because of the beating heart. The tissue temperature could drop because of the cooling effect of the tissue blood flow. Our study used ventricular muscle, and therefore the results may have differed from atrial muscle. A previous report on HP‐SD ablation used more than 70 W.12, 19 In this study, the maximum power was 50 W, therefore we could not investigate the correlation between the AI, lesion formation, and steam pops for the HP‐SD ablation.
5. CONCLUSIONS
The AI cannot predict steam pops. The value of the AI and impedance drop at the time of the steam pop varied according to the change in the ablation settings. A low power and long duration ablation could achieve a high AI value. On the other hand, a high‐power ablation could not achieve a high AI value because of the early occurrence of the steam pops.
CONFLICT OF INTEREST
Authors declare no conflict of interests for this article.
Mori H, Kato R, Sumitomo N, et al. Relationship between the ablation index, lesion formation, and incidence of steam pops. J Arrhythmia. 2019;35:636–644. 10.1002/joa3.12195
REFERENCES
- 1. Calkins H, Kuck KH, Cappato R, Brugada J, Camm AJ, Chen SA, et al. 2012 HRS/EHRA/ECAS expert consensus statement on catheter and surgical ablation of atrial fibrillation: recommendations for patient selection, procedural techniques, patient management and follow‐up, definitions, endpoints, and research trial design: a report of the Heart Rhythm Society (HRS) Task Force on Catheter and Surgical Ablation of Atrial Fibrillation. Heart Rhythm. 2012;9:632–96. [DOI] [PubMed] [Google Scholar]
- 2. Cappato R, Negroni S, Pecora D, Bentivegna S, Lupo PP, Carolei A, et al. Prospective assessment of late conduction recurrence across radiofrequency lesions producing electrical disconnection at the pulmonary vein ostium in patients with atrial fibrillation. Circulation. 2003;108:1599–604. [DOI] [PubMed] [Google Scholar]
- 3. Nanthakumar K, Plumb VJ, Epstein AE, Veenhuyzen GD, Link D, Kay GN. Resumption of electrical conduction in previously isolated pulmonary veins: rationale for a different strategy? Circulation. 2004;109:1226–9. [DOI] [PubMed] [Google Scholar]
- 4. Ouyang F, Tilz R, Chun J, Schmidt B, Wissner E, Zerm T, et al. Long‐term results of catheter ablation in paroxysmal atrial fibrillation: lessons from a 5‐year follow‐up. Circulation. 2010;122:2368–77. [DOI] [PubMed] [Google Scholar]
- 5. Neuzil P, Reddy VY, Kautzner J, Petru J, Wichterle D, Shah D, et al. Electrical reconnection after pulmonary vein isolation is contingent on contact force during initial treatment: results from the EFFICAS I study. Circ Arrhythm Electrophysiol. 2013;6:327–33. [DOI] [PubMed] [Google Scholar]
- 6. Kautzner J, Neuzil P, Lambert H, Peichl P, Petru J, Cihak R, et al. EFFICAS II: optimization of catheter contact force improves outcome of pulmonary vein isolation for paroxysmal atrial fibrillation. Europace. 2015;17:1229–35. [DOI] [PMC free article] [PubMed] [Google Scholar]
- 7. Das M, Loveday JJ, Wynn GJ, Gomes S, Saeed Y, Bonnett LJ, et al. Ablation index, a novel marker of ablation lesion quality: prediction of pulmonary vein reconnection at repeat electrophysiology study and regional differences in target values. Europace. 2017;19:775–83. [DOI] [PubMed] [Google Scholar]
- 8. Nakagawa H, Ikeda A, Govari A, Papaioannou T, Constantine G, Bar‐Tal M, et al. Prospective study using a new formula incorporating contact force, radiofrequency power and application time (Force‐Power‐Time Index) for quantifying lesion formation to guide long continuous atrial lesions in the beating canine heart. Circulation. 2018;128:A12104 (abstr). [Google Scholar]
- 9. Nakagawa H, Ikeda A, Govari A, Papaioannou T, Constantine G, Bar‐Tal M. Prospective study to test the ability to create RF lesions at predicted depths of 3, 5, 7 and 9 mm using a new formula incorporating contact force, radiofrequency power and application time (Force‐Power‐Time Index) in the beating canine heart. Heart Rhythm. 2013;10:S481 (abstr). [Google Scholar]
- 10. Solimene F, Schillaci V, Shopova G, Urraro F, Arestia A, Iuliano A, et al. Safety and efficacy of atrial fibrillation ablation guided by Ablation Index module. J Interv Card Electrophysiol J Interv Card Electrophysiol. 2019;54:9–15. [DOI] [PubMed] [Google Scholar]
- 11. Taghji P, El Haddad M, Phlips T, Wolf M, Knecht S, Vandekerckhove Y, et al. Evaluation of a strategy aiming to enclose the pulmonary veins with contiguous and optimized radiofrequency lesions in paroxysmal atrial fibrillation. A Pilot Study. JACC Clin Electrophysiol. 2018;4:99–108. [DOI] [PubMed] [Google Scholar]
- 12. Leshem E, Zilberman I, Tschabrunn CM, Barkagan M, Contreras‐Valdes FM, Govari A, et al. High‐power and short‐duration ablation for pulmonary vein isolation: biophysical characterization. JACC Clin Electrophysiol. 2018;4:467–79. [DOI] [PubMed] [Google Scholar]
- 13. Ikeda A, Nakagawa H, Lambert H, Shah DC, Fonck E, Yulzari A, et al. Relationship between catheter contact force and radiofrequency lesion size and incidence of steam pop in the beating canine heart: electrogram amplitude, impedance, and electrode temperature are poor predictors of electrode‐tissue contact force and lesion size. Circ Arrhythm Electrophysiol. 2014;7:1174–80. [DOI] [PubMed] [Google Scholar]
- 14. Yokoyama K, Nakagawa H, Shah DC, Lambert H, Leo G, Aeby N, et al. Novel contact force sensor incorporated in irrigated radiofrequency ablation catheter predicts lesion size and incidence of steam pop and thrombus. Circ Arrhythmia Electrophysiol. 2008;1:354–62. [DOI] [PubMed] [Google Scholar]
- 15. Quallich SG, Van Heel M, Iaizzo PA. Optimal contact forces to minimize cardiac perforations before, during, and/or after radiofrequency or cryothermal ablations. Heart Rhythm. 2015;12:291–6. [DOI] [PubMed] [Google Scholar]
- 16. Seiler J, Roberts‐Thomson KC, Raymond JM, Vest J, Delacretaz E, Stevenson WG. Steam pops during irrigated radiofrequency ablation: feasibility of impedance monitoring for prevention. Heart Rhythm. 2008;5:1411–6. [DOI] [PubMed] [Google Scholar]
- 17. Wittkampf FH, Nakagawa H, Foresti S, Aoyama H, Jackman WM. Saline‐irrigated radiofrequency ablation electrode with external cooling. J Cardiovasc Electrophysiol. 2005;16:323–8. [DOI] [PubMed] [Google Scholar]
- 18. Theis C, Rostock T, Mollnau H, Sonnenschein S, Himmrich E, KÄmpfner Det al. The Incidence of audible steam pops is increased and unpredictable with the ThermoCool® surround flow catheter during left atrial catheter ablation: a prospective observational study. J Cardiovasc Electrophysiol. 2015;26:956–62. [DOI] [PubMed] [Google Scholar]
- 19. Bourier F, Duchateau J, Vlachos K, Lam A, Martin CA, Takigawa M, et al. High‐power short‐duration versus standard radiofrequency ablation: Insights on lesion metrics. J Cardiovasc Electrophysiol. 2018;29:1570–5. [DOI] [PubMed] [Google Scholar]


