

Abstract
Recurring slope lineae (RSL) are flow‐like features on Mars characterized by a local darkening of the soil thought to be generated by the formation and flow of liquid brines. One possible mechanism responsible for forming these brines could be the deliquescence of salts present in the Martian soil. We show that the JSC Mars‐1a analogue soil undergoes a darkening process when salts dispersed in the soil deliquesce, but forming continuous liquid films and larger droplets takes much longer than previously assumed. Thus, RSL may not necessarily require concurrent flowing liquid water/brine or a salt‐recharge mechanism, and their association with gullies may be the result of previously flowing water and deposited salts during an earlier warmer and wetter period. In addition, our results show that electrical conductivity measurements correlate well with the deliquescence rates and provide better overall characterization than either Raman spectroscopy or estimates based on deliquescence relative humidity.
Keywords: deliquescence, RSL, Mars, salts, soil, electrical conductivity
Key Points
Deliquescence of salts in a Mars simulant soil sample causes a RSL‐like darkening
Forming thicker liquid films or bulk water via deliquescence is a relatively slow process
The deliquescence process can be investigated by electrical conductivity measurements
1. Introduction
Recurring slope lineae (RSL) are narrow (<5 m) and relatively dark flow‐like features on Mars that extend downslope from bedrock outcrops. The features were identified by the Mars Reconnaissance Orbiter [McEwen et al., 2011a] and occur annually during spring and summer, especially on steep, equator‐facing, southern slopes [Runyon and Ojha, 2014]. Several mechanisms have been proposed to explain the occurrence of RSL, ranging from dry granular flows [McEwen et al., 2011b] to effects caused by rapid heating of nocturnal frost [Dundas et al., 2015]. The best current hypotheses for their formation involve either the melting of frozen brines, the seasonal discharge of a local aquifer, or via deliquescence of salts dispersed in the soil [Chevrier and Rivera‐Valentin, 2012; McEwen et al., 2015; Ojha et al., 2015].
Experimental investigations into the formation of brines via deliquescence has been widely reported [Zorzano et al., 2009; Gough et al., 2011, 2014; Fischer et al., 2014; Nuding et al., 2014, 2015; Nikolakakos and Whiteway, 2015]. These investigations clearly showed that the salts present on Mars, such as magnesium and calcium perchlorates or chlorides [Kounaves et al., 2010, 2014], are highly deliquescent, and some of their solutions could be, at least temporally, stable on the surface of Mars. The relative humidity (RH) needed to start the deliquescence process of a salt, the deliquescence relative humidity (DRH), is shown in Table 1 for some Mars‐relevant salts.
Table 1.
Deliquescence Relative Humidity (DRH) Values for Salts Used in the Experiments
Most of the research has been conducted by investigating phase changes of the salts with the aid of Raman spectroscopy, whereby the Raman laser beam was focused on small salt particles or thin layers [Gough et al., 2011, 2014; Fischer et al., 2014; Nuding et al., 2014, 2015; Nikolakakos and Whiteway, 2015]. However, these studies do not take into consideration that the salts on Mars are probably intimately mixed with the soil.
To date, there have been no reported studies correlating the observed darkening of Mars analogue soils and deliquescence as a function of the types of salts and environmental parameters such as humidity or temperature. Here we demonstrate that visual observation in parallel with electrical conductivity (EC), a technique commonly used for detection of liquid water in soils [McKay et al., 2003; Davis et al., 2010], can be used to monitor the deliquescence process in mixtures of soil and salt.
2. Materials and Methods
2.1. Reagents and Sample Treatment
The soil salt mixtures consisted of JSC Mars‐1a analogue soil and either magnesium perchlorate hexahydrate Mg(ClO4)2 · 6H2O (Sigma‐Aldrich, Lot no. MKBQ3075V), calcium perchlorate tetrahydrate Ca(ClO4)2 · 4H2O (Acros Organics, Lot no. A0332298), magnesium chloride hexahydrate MgCl2 · 6H2O (Fluka, Analysis no. 350301/1696), or calcium chloride hexahydrate CaCl2 · 6H2O (Fluka, Analysis no. 349745/163796). Salts were ground in a mortar before mixing with soil. One sample contained only pure soil. The other samples consisted of 10 g of soil and 0.0123 mol of the corresponding salt hydrate (i.e., 4.075 g Mg(ClO4)2 · 6H2O, 3.825 g Ca(ClO4)2 · 4H2O, 2.5 g MgCl2 · 6H2O, and 2.695 g CaCl2 · 6H2O). The salt contents were chosen sufficiently high to ensure a visible and measurable change during deliquescence (salt concentrations in RSL are expected to be much higher than at Martian landing sites, and variable salt concentrations might affect their deliquescence). After mixing the components by shaking in a 30 mL polycarbonate container, the samples were dried for 2 days in a desiccator under vacuum over anhydrous calcium chloride.
To increase the RH in the system the desiccant in the lower part of the desiccator was replaced by water. A hot plate was used to cycle the temperature in the desiccator between 290 and 298 K to evaporate water until the relative humidity (RH) increased from 40% (which was the RH in the laboratory after opening the desiccator and removing the desiccant) to over 70%. This value increased over several days slowly to a RH of 85% without any treatment (Figure 2). After 18 days the experiment was stopped. Afterward the samples were dried again until there was no measurable conductivity and the samples regained their light brown color. The experiment was then repeated to ensure reproducibility of the results.
Figure 2.
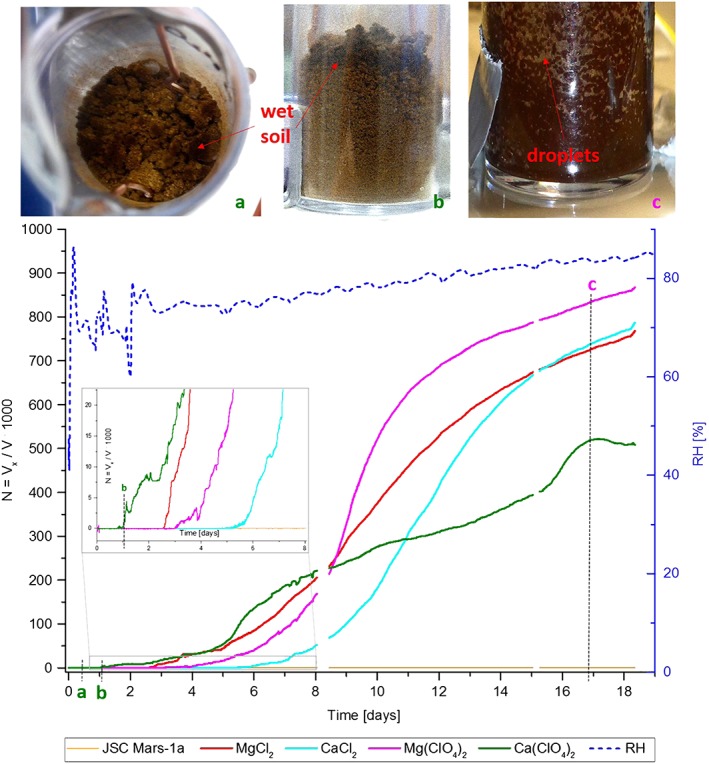
Changes in normalized voltage (N) and RH as a function of time, and photos of soil samples. (a–c) The time when sample photos were taken. Wet separated grains on surface of Ca(ClO4)2 · nH2O sample with no measurable conductivity after 2.5 h (Figure 2a). Thin wet layer of soil in the upper part of the sample causes first measurable conductivity values after 19 h (Figure 2b). Wet layers and droplets of salty water in the sample of Mg(ClO4)2 · nH2O with the highest measured conductivity after 17 days (Figure 2c). The enlarged segment of the graph displays the TV values in more detail. Short data gaps in the curves are results of temporary connection problems with the CR10 data logger.
2.2. Measurements and Data Treatment
All EC measurements were made using two parallel 1 mm diameter copper wire electrodes inserted 25 mm apart into the soil samples and connected to a CR 10 data logger (Campbell Scientific). The CR 10 is capable of applying an AC excitation voltage that prevents polarization of the electrodes. The applied excitation voltage (VX) results in a current between the electrodes proportional to the EC of the sample. This current is converted to a measured voltage V. The observed output value of the data logger, equivalent to the conductivity, is a normalized voltage N given by
The upper detection limit of this technique is reached when V is equal to VX. That happens when, due to increasing ion mobility in the sample, the resistance tends to zero, so that EC goes to infinity. In this case N tends to 1000. The N values can also be converted into conductivity values (in Siemens per meter) when the cell constant of the system is known [Stone et al., 1993]. The data logger was set to register N values every 5 min. RH and temperature were measured with a HOBO Pro v2 data logger throughout the entire experiment.
3. Results
The pure JSC Mars‐1a analogue is a light reddish brown soil (Figure 1a). Mixing it with the various salt hydrates resulted in a dark brown soil sprinkled with some remaining dry particles (Figure 1b). The darkening of the sample is due to the wetting of the soil caused by some minor initial amount of liquid water adsorbed by the hygroscopic salts. After drying, the soil/salt mixtures regained the light reddish brown color of the pure JSC Mars‐1a analogue soil but with the noticeable exception that near the surface larger clumps of soil are visible (Figure 1c). Similar clumpy or cloddy soils were observed in the soils at the Phoenix landing site and attributed to their being wetted at some point in the past [Arvidson et al., 2009].
Figure 1.
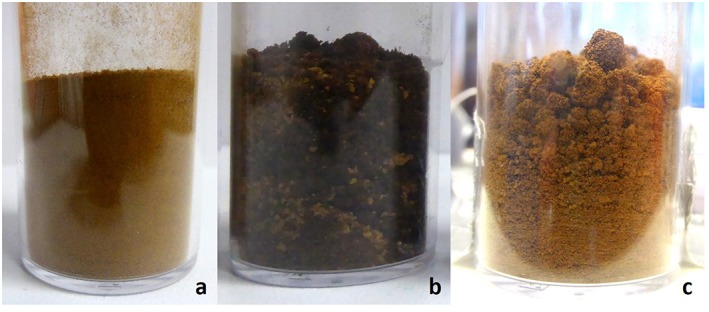
Soil sample photos. (a) Pure and dry JSC Mars‐1a analogue soil. (b) Soil mixed with wet Ca(ClO4)2 · 4H2O. (c) Dried sample of soil and Ca(ClO4)2 · nH2O.
The results of our experiments are shown in Figure 2, where the measured normalized voltage (N) and the RH in the system are plotted versus the duration of the experiment in days. Selected images of the samples taken through the glass of the desiccator at specific points of time are included to show the correlation between the increasing conductivity and the darkening of the soil due to deliquescence. As expected, at the beginning of the experiment for RH ~ 40%, the samples were dry with N = 0. The changes in appearance and conductivity that occurred after the RH was increased to 70% are described below and summarized in Table 2, where TV is the time after the start when first visible changes (wet grains on the sample surface) were observed and T EC the time when EC started to increase.
Table 2.
Time After Experimental Start at Which the Beginning of Deliquescence Could be Observed Visually (TV) and via Electrical Conductivity (T EC) in Hours (h) and Days (d)
| Salt (mixed with soil) | TV | T EC |
|---|---|---|
| Ca(ClO4)2 · nH2O | 2.5 ± 0.5 h | 19 h |
| MgCl2 · nH2O | 48 ± 2 h (2 d) | 61 h (~2.5 d) |
| Mg(ClO4)2 · nH2O | 70 ± 4 h (~3 d) | 72 h (3 d) |
| CaCl2 · nH2O | 108 ± 4 h (~4.5 d) | 124 h (~5 d) |
About 2.5 h after increasing the RH to 70%, some of the clumped grains on the surface of the calcium perchlorate sample started to become wet, as can be seen by the darkening of these particles compared to the brighter soil beneath (Figure 2a). As the wet grains are not connected to each other, the conductivity remained at zero. About 19 h after the experiment started a complete layer of wet soil had formed (Figure 2b), coinciding with an increase in conductivity, most likely due to a thin layer of salt water forming around the soil particles. The increase of conductivity in these first minutes of detection can better be seen in the enlarged segment of Figure 2.
The other samples stayed dry and nonconductive for 2 days after the start of the experiment. During this time the diameter of the dark and wet layer in the calcium perchlorate sample constantly increased in size, which was also mirrored by an increase in conductivity. After 2 days some grains on the top of the magnesium chloride sample became dark and wet, similar to the calcium perchlorate sample. After 2.5 days, an increase in the conductivity in the magnesium chloride sample was also detected. Similar to the calcium perchlorate soil mixture, a dark wet layer also formed that grew with time proportional to the conductivity. Similar results were obtained for the magnesium perchlorate and calcium chloride samples after 3 and 4.5 days, respectively.
The soil sample with calcium perchlorate started to deliquesce first at a rate similar to the other salts, but continued at a lower rate after about the eighth day. The rate of increase for the calcium perchlorate sample reached its maximum after 16 days, where it remained nearly constant until the end of the experiment (Figure 2). The other samples did not reach a maximum value, but they approached the detection limit of the technique.
When the experiment was stopped after 18 days, all samples, except the pure soil which stayed dry, were completely wet and dark brown. In the magnesium perchlorate sample, which reached the highest conductivity, small liquid droplets and films where visible on the wall of the vessel after 17 days (Figure 2c). A repetition of the experiment resulted in very similar curve progressions compared to the first run, with the exception that a slightly lower deliquescence rate for magnesium chloride was observed.
4. Discussion
The results clearly show that the salts in the JSC Mars‐1a analogue soil deliquesce when sufficiently high RH values are reached. However, without any added salts the soil stays completely dry for 18 days at RH values up to 70–85%, which shows that the wetting of the other samples is not caused by adsorption or direct condensation of water onto the soil. The deliquescence process coincides with a darkening of the soil, similar to that observed for the RSL on Mars [Massé et al., 2014]. We have shown that EC is an excellent method for monitoring soil wetting by deliquescence. Some salts (in our case calcium perchlorate) can initiate this process after only 2.5 h at RH~70%; however, other salts (here magnesium perchlorate, magnesium chloride, and calcium chloride) need several days until they have absorbed enough liquid water to provide ion mobility, even if their DRH are below the starting RH of the experiment (70%) (Table 1). We found that it takes much more time (in our experiment 17 days) until sizable liquid droplets and films form under the experimental conditions used here. Therefore, we agree with Fischer et al. [2014] who showed that bulk deliquescence (meaning the formation of greater amounts of liquids) is a slow process, but in contrast to their work, we find that some salts like calcium perchlorate can start to deliquesce much more rapidly (<3.5 h). This is seen as the time during which atmospheric conditions at the Phoenix landing site would meet the conditions necessary for deliquescence to occur [Möhlmann, 2011].
An interesting observation is that there seems to be no correlation between the TV or T EC values of a salt and its DRH value. The calcium perchlorate sample with the lowest DRH (13 %) started first to deliquesce, but it was followed chronologically by the samples with magnesium chloride (DRH 33 %), magnesium perchlorate (DRH 42 %), and calcium chloride (DRH 29 %). Thus, one cannot predict the order in which different salts start to deliquesce only by taking the DRH values into consideration. There may be several reasons for this lack of correlation. One reason may be that the hydration state present at deliquescence may be different than the hydration state as received due to the desiccation of the samples at the beginning of the experiment.
Furthermore, the velocity of the deliquescence process can neither be estimated by DRH nor TV or T EC values, as can be seen in the flatter slope of the calcium perchlorate conductivity curve (Figure 2). As calcium perchlorate has the lowest DRH and T EC values one could expect the highest rate of deliquescence and therefore the steepest curve slope, but this is not so according to our experiments.
5. Conclusion
We have shown that the darkening of the soil similar to what is seen at the RSL on Mars can be reproduced by the wetting of perchlorate and chloride containing soils caused by deliquescence of these salts. However, due to the longer time scales required to produce greater amounts of liquid water in the forms of bulk or droplets, it appears likely that the RSL would not necessarily require the concurrent presence of flowing liquid water or brine. Thus, it is possible that their association with gullies may be the result of an earlier period when Mars may have had a warmer and wetter climate that allowed for the melting of subsurface ice at exposed outcrops and/or the flow of liquid water and subsequent precipitation of salts on evaporation. This process would have been most effective on the warmer equator‐facing slopes of the craters and dunes, where RSLs are found today. The steep slopes of these formations may have also impeded new dry soil from covering the salt deposits. This hypothesis, consistent with the latest spectral evidence for hydrated salts in the RSL [Ojha et al., 2015], does not require a salt‐recharge mechanism since the liquid water films are formed in‐place by the previously deposited salts.
Acknowledgments
We thank Chris McKay and Alfonso Davila for donating the CR10 data logger and helping to improve the experimental setup. Moreover, we thank Raina V. Gough for helping to improve the manuscript. This project was funded by European Research Council Advanced Grant “Habitability of Martian Environments” (339231). All of the numerical data for this paper are provided in the figures and are also available in tabular form from the authors upon request (dirksm@astro.physik.tu-berlin.de).
Heinz, J. , Schulze‐Makuch D., and Kounaves S. P. (2016), Deliquescence‐induced wetting and RSL‐like darkening of a Mars analogue soil containing various perchlorate and chloride salts, Geophys. Res. Lett., 43, 4880–4884, doi: 10.1002/2016GL068919.
References
- Arvidson, R. E. , et al. (2009), Results from the Mars Phoenix Lander Robotic Arm experiment, J. Geophys. Res., 114, E00E02, doi: 10.1029/2009JE003408. [DOI] [Google Scholar]
- Chevrier, V. F. , and Rivera‐Valentin E. G. (2012), Formation of recurring slope lineae by liquid brines on present‐day Mars, Geophys. Res. Lett., 39, L10202, doi: 10.1029/2012GL054119. [DOI] [Google Scholar]
- Davis, W. L. , de Pater I., and McKay C. P. (2010), Rain infiltration and crust formation in the extreme arid zone of the Atacama Desert, Chile, Planet. Space Sci., 58(4), 616–622, doi: 10.1016/j.pss.2009.08.011. [DOI] [Google Scholar]
- Dundas, C. M. , McEwen A. S., and Sutton S. (2015), New constraints on the locations, timing and conditions for recurring slope lineae activity on Mars, 46th Lunar Planet. Sci., Abstract 2327.
- Fischer, E. , Martínez G. M., Elliott H. M., and Rennó N. O. (2014), Experimental evidence for the formation of liquid saline water on Mars, Geophys. Res. Lett., 41, 4456–4462, doi: 10.1002/2014GL060302. [DOI] [PMC free article] [PubMed] [Google Scholar]
- Gough, R. V. , Chevrier V. F., Baustian K. J., Wise M. E., and Tolbert M. A. (2011), Laboratory studies of perchlorate phase transitions: Support for metastable aqueous perchlorate solutions on Mars, Earth Planet. Sci. Lett., 312(3–4), 371–377, doi: 10.1016/j.epsl.2011.10.026. [DOI] [Google Scholar]
- Gough, R. V. , Chevrier V. F., and Tolbert M. A. (2014), Formation of aqueous solutions on Mars via deliquescence of chloride‐perchlorate binary mixtures, Earth Planet. Sci. Lett., 393, 73–82, doi: 10.1016/j.epsl.2014.02.002. [DOI] [Google Scholar]
- Kounaves, S. P. , et al. (2010), Wet chemistry experiments on the 2007 Phoenix Mars Scout Lander mission: Data analysis and results, J. Geophys. Res., 115, E00E10, doi: 10.1029/2009JE003424. [DOI] [Google Scholar]
- Kounaves, S. P. , Chaniotakis N. A., Chevrier V. F., Carrier B. L., Folds K. E., Hansen V. M., McElhoney K. M., O'Neil G. D., and Weber A. W. (2014), Identification of the perchlorate parent salts at the Phoenix Mars landing site and possible implications, Icarus, 232, 226–231. [Google Scholar]
- Lide, D. R. (2003), CRC Handbook of Chemistry and Physics: A Ready‐Reference Book of Chemical and Physical Data, 84th ed., CRC Press, Boca Raton, Fla. [Google Scholar]
- Massé, M. , Beck P., Schmitt B., A., Pommerol , McEwen A., Chevrier V., Brissaud O., and Séjourné A. (2014), Spectroscopy and detectability of liquid brines on Mars, Planet. Space Sci., 92, 136–149, doi: 10.1016/j.pss.2014.01.018. [DOI] [Google Scholar]
- McEwen, A. S. , Ojha L., Dundas C. M., Mattson S. S., Byrne S., Wray J. J., Cull S. C., Murchie S. L., Thomas N., and Gulick V. C. (2011a), Seasonal flows on warm Martian slopes, Science, 333(6043), 740–743, doi: 10.1126/science.1204816. [DOI] [PubMed] [Google Scholar]
- McEwen, A. S. , Ojha L., Dundas C. M., Mattson S. S., Byrne S., Wray J. J., Cull S. C., Murchie S. L., Thomas N., and Massé M. (2011b), Recurring slope lineae: Warm‐season incremental flows in the middle southern latitudes of Mars, Fifth Mars Polar Science Conference, Abstract 6017.
- McEwen, A. , Chojnacki M., Dundas C., Ojha L., Masse M., Schaefer E., and Leung C. (2015), Recurring slope lineae on Mars: Atmospheric origin?, EPSC Abstracts, 10, EPSC2015‐786‐1.
- McKay, C. P. , Friedmann E. I., Gómez‐Silva B., Cáceres‐Villanueva L., Andersen D. T., and Landheim R. (2003), Temperature and moisture conditions for life in the extreme arid region of the Atacama desert: Four years of observations including the El Niño of 1997–1998, Astrobiology, 3(2), 393–406, doi: 10.1089/153110703769016460. [DOI] [PubMed] [Google Scholar]
- Möhlmann, D. T. F. (2011), Latitudinal distribution of temporary liquid cryobrines on Mars, Icarus, 214(1), 236–239, doi: 10.1016/j.icarus.2011.05.006. [DOI] [Google Scholar]
- Nikolakakos, G. , and Whiteway J. A. (2015), Laboratory investigation of perchlorate deliquescence at the surface of Mars with a Raman scattering lidar, Geophys. Res. Lett., 42, 7899–7906, doi: 10.1002/2015GL065434. [DOI] [Google Scholar]
- Nuding, D. L. , Rivera‐Valentin E. G., Davis R. D., Gough R. V., Chevrier V. F., and Tolbert M. A. (2014), Deliquescence and efflorescence of calcium perchlorate: An investigation of stable aqueous solutions relevant to Mars, Icarus, 243, 420–428, doi: 10.1016/j.icarus.2014.08.036. [DOI] [Google Scholar]
- Nuding, D. L. , Davis R. D., Gough R. V., and Tolbert M. A. (2015), The aqueous stability of a Mars salt analog: Instant Mars, J. Geophys. Res. Planets, 120, 588–598, doi: 10.1002/2014JE004722. [DOI] [Google Scholar]
- Ojha, L. , Wilhelm M. B., Murchie S. L., McEwen A. S., Wray J. J., Hanley J., Massé M., and Chojnacki M. (2015), Spectral evidence for hydrated salts in recurring slope lineae on Mars, Nat. Geosci., 8, 829–832, doi: 10.1038/ngeo2546. [DOI] [Google Scholar]
- Runyon, K. , and Ojha L. (2014), Recurring slope lineae, in Encyclopedia of Planetary Landforms, edited by Hargitai H. and Kereszturi Á., pp. 1–6, Springer, New York. [Google Scholar]
- Stone, D. B. , Clarke G. K. C., and Blake E. W. (1993), Subglacial measurement of turbidity and electrical conductivity, J. Glaciol., 39(132), 415–420. [Google Scholar]
- Zorzano, M.‐P. , Mateo‐Martí E., Prieto‐Ballesteros O., Osuna S., and Renno N. (2009), Stability of liquid saline water on present day Mars, Geophys. Res. Lett., 36, L20201, doi: 10.1029/2009GL040315. [DOI] [Google Scholar]