

Abstract
The perceived benefit of return of individual research results (IRR) in accordance to participants’ preferences in genomic biobank research is unclear. Parents were randomized to the hypothetical scenario that their child was enrolled in 1 of 4 biobanks with different policies for return of IRR: “None”; “All”; “Binary” – choice to receive all or none; and “Granular” – use a preference-setting tool to choose categories of IRR based on the preventability and severity of a condition and several opt-out options. Parents were given a hypothetical IRR report for their child. The Granular group was the most satisfied with the process, biobank, and IRR received. The None group was least satisfied and least likely to agree that the biobank was beneficial. The response to the statement that the biobank was harmful was similar between groups. Our data suggest that the ability to designate preferences leads to greater satisfaction and may increase biobank participation.
INTRODUCTION
With dramatic advances in technology and the constant discovery of novel genetic information, individuals are now able to receive individual genetic data that may have meaning to them. In the research setting, there is a growing consensus that return of individual genetic information to participants may be desirable. Not only do participants express the desire to receive research results1–4, but many argue that research may generate information that is important to participants’ health, and that they have a right to such information5,6.
Initial guidelines for return of genomic research results emphasized the return of results for severe, potentially life-threatening diseases for which effective treatment and/or prevention was available based on analytic and clinical validity, actionability, and severity of the disease7,8. The American College of Medical Genetics (ACMG) recommendations for return of incidental findings in the clinical setting9,10 focused attention on return of genetic information to patients and families. The research community has been struggling with return of individual research results (IRR)6,11–14, in particular whether there is an obligation to return IRR and the role of participant preferences. Recently the Presidential Commission15 and a joint Clinical Sequencing Exploratory Research (CSER) Consortium and the Electronic Medical Records and Genomics (eMERGE) Network group16 put forth guidelines suggesting that unlike the clinical setting, in the research realm there is no duty to return research results, and that if research results are offered, investigators should allow participants to opt out of receiving results15,16.
One option for result disclosure is to give participants the option to define, at the time of enrollment, the types of results to receive17, allowing participants to make selections based on their “personal utility”18–21 and the meaning of genomic information to them14,17,22. In 2007 we proposed the “Informed Cohort” model13 that reflects this approach, an automated infrastructure for implementing a preference-driven approach to return of results. Our group at Boston Children’s Hospital (BCH) had as a goal the implementation of the Informed Cohort model in a pediatric setting as the Gene Partnership (GP). We recently published guidelines for return of IRR from pediatric genomic studies in accordance with parental preferences and considering the developing autonomy of pediatric participants, all in the context of protecting participants from medical and psychosocial harms from result disclosure23,24.
A major challenge to incorporating preferences into return of research results is ensuring that it is done in a manner that is both scalable and reflects participants’ true desires for information to receive. Although participants may desire to have a choice, does it matter to them how granular their choices are? Or is just having a choice the important factor? In addition, there is a lack of evidence about whether biobank participants truly understand the implications of their choice of IRR to receive. Given that they are choosing from among hypothetical future events, it is not clear if their stated preferences are stable, reliable.
As our group considered return of IRR in Gene Partnership, we sought to explore whether degree of satisfaction with enrollment in a hypothetical biobank was associated with having an ability to designate preferences regarding receiving IRR, considering both the ability to set any preferences and the ability to set nuanced preferences in comparison to having situations of no choice regarding preferences. Finally we were interested to see if the opportunity to see hypothetical results returned after exercising nuanced preference setting increased satisfaction with the results received. To answer these questions, we randomized parents to 1 of 4 hypothetical child biobank scenarios reflective of different policies for return of research results and gave them a hypothetical research result report for their child. In this analysis we report on participant satisfaction with the process, biobank, and hypothetical results received. We hypothesized that those in the group with an opportunity to set nuanced preferences for IRR would have higher satisfaction than those without that opportunity.
METHODS
This research study was approved by the BCH Institutional Review Board (IRB-P00006896: “Study to Measure the Effectiveness of a Preference-setting Model for the Return of Individual Research Results”).
Development and Testing the Survey
We previously developed a participant-centered preference setting model through formative research with parents25. The resultant model allows parents to choose which results to receive based on the severity and preventability of possible conditions. The model also allows parents to opt out of receiving results for specific categories of conditions perceived by many parents in our interviews to be highly sensitive – mental illness, developmental disorders, and childhood-onset degenerative conditions – as well as adult-onset conditions not treatable during childhood.
To assess participant satisfaction with the biobank model to which participants were assigned under our experiment, survey questions were developed by our team of genomic researchers, genetic counselors, behavioral scientists, survey methodologists, and medical geneticists. Baseline survey questions before presenting hypothetical IRRs were adapted primarily from the MedSeq “Expectations/Perceived Utility” questionnaire26. Follow-up questions were adapted from quotes from the parent interviews conducted to develop the preference setting model25 and from additional literature27. Cognitive interviews were conducted with parents of inpatients at BCH to test the survey for comprehension and ease of administration. The survey was programmed into REDCap and administered as a web survey28.
Randomization to four hypothetical biobanks
Prior to enrollment parents were randomized to one of four hypothetical biobanks with different policies for return of genetic research results models (see figure 1 for a flow chart of the study): 1) Group 1a received no results (None); 2) Group 1b received all results (All); 3) Group 2 were given a choice to receive all or no results (Binary); and 4) Group 3 used the preference setting tool to choose categories of results to receive (Granular).
Figure 1.
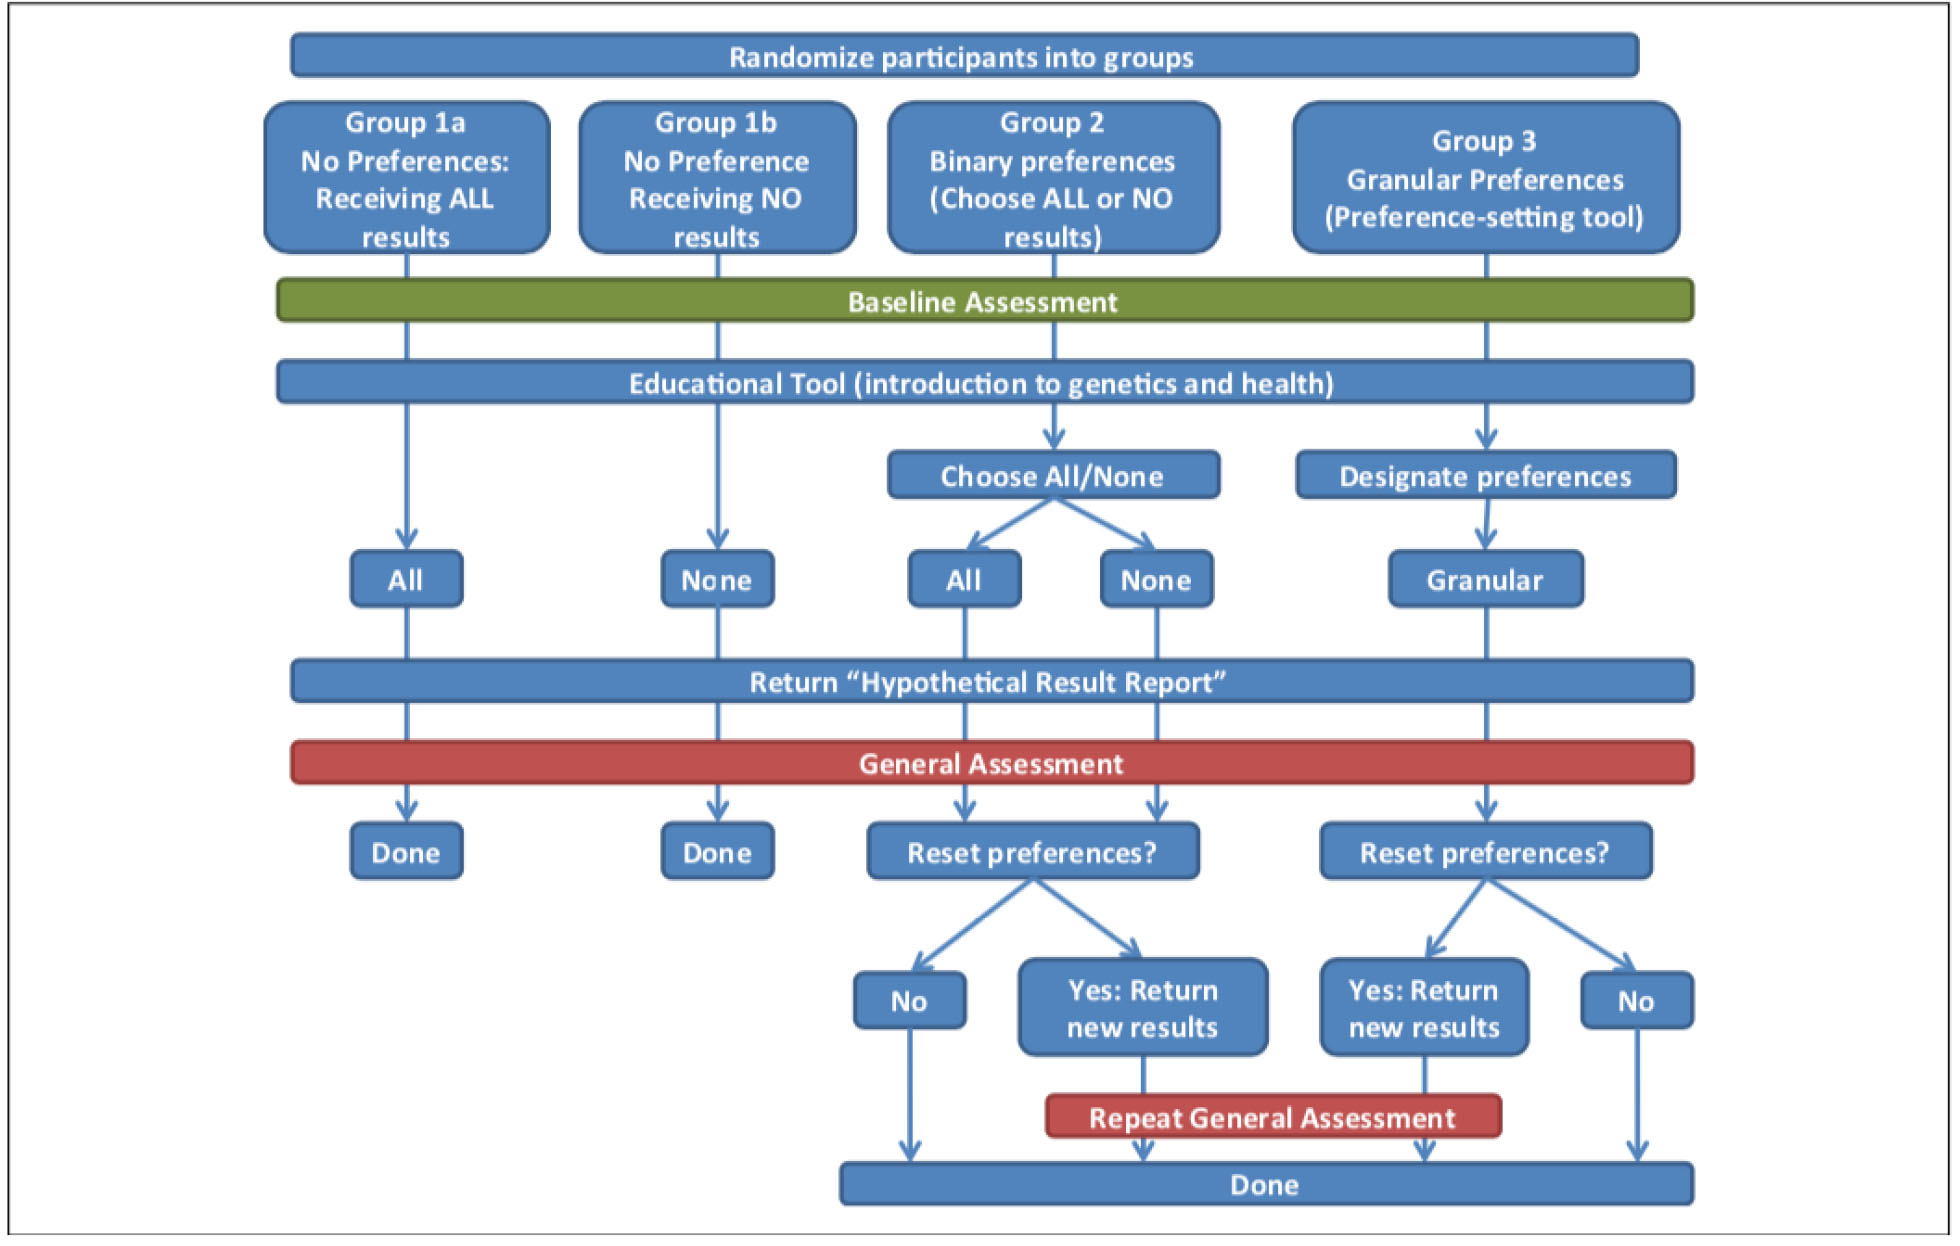
Flowchart of the study.
Upon starting the online survey participants were asked to watch a 5-minute educational video about basic genetic concepts, including a brief description of genetic biobanks and the potential for return of IRRs. All participants then answered demographic questions and questions about reasons why they might or might not want to receive genetic information about their child. The participants of groups 1a and 1b (None and All) had no choice regarding receiving IRR and were told they would receive either all genetic research results (Group 1a-All) or no results (Group 1b-None). Group 2 (Binary) was given a choice between receiving all or no results. Group 3 (Granular) was asked to designate preferences with regard to which research results they wanted to receive using a three-step preference-setting process: 1) They were given the option to decide if first they wanted to receive results for disorders that were preventable, non-preventable, both, or neither. 2) Those who chose preventable, non-preventable, or both were given the option to receive results for conditions that were severe, not severe, or both. 3) The participants were offered the option to opt out of receiving results for conditions classified in the following four categories: mental illnesses, developmental and learning disorders, childhood-onset degenerative diseases, and adult-onset conditions not preventable in childhood. The preference setting process ended for participants who chose to receive neither preventable nor non-preventable results, as all possible results were eliminated with this first decision.
Return of hypothetical IRR
All groups were presented with a “Hypothetical Result Report” that showed genetic conditions in a 2×2 table according to the criteria of preventability and severity (see Figure 2). The conditions had been previously selected and classified into one of the four cells by a group of 20 genetic health care professionals at BCH. Included in each cell were conditions that parents could have opted out of receiving (mental illnesses, developmental and learning disorders, childhood-onset degenerative diseases, or adult-onset conditions). The report was shown to participants in all four groups in order to highlight research results that they may or may not receive. Conditions would be highlighted as “received” or “withheld” based on which group participants were assigned to. The All group saw all of the conditions highlighted, whereas every condition was crossed out for the None group. The Binary group would receive the appropriate grid that reflected their decision to receive all or no results. The Granular group would be shown the appropriate grid that reflected their decision to receive severe and/or non-severe conditions, preventable and/or non-preventable conditions, mental illnesses, developmental disorders, child-onset degenerative diseases, or adult-onset conditions (see Figure 3 for an example).
Figure 2.

Hypothetical result report.
Note. This grid was shown to participants in all four survey groups to highlight research results that they may or may not receive. Certain conditions would be highlighted as “received” and others crossed out as “withheld” based on which group participants were assigned to. The All group saw all of the conditions highlighted, whereas ever condition was crossed out for the None group. The Binary group would receive the appropriate grid that reflected their decision to receive all or no results. The Granular group would be shown the appropriate grid that reflected their decision to receive severe and/or non-severe conditions, preventable and/or non-preventable conditions, mental illnesses, developmental disorders, child-onset degenerative diseases, or adult onset conditions.
Figure 3.
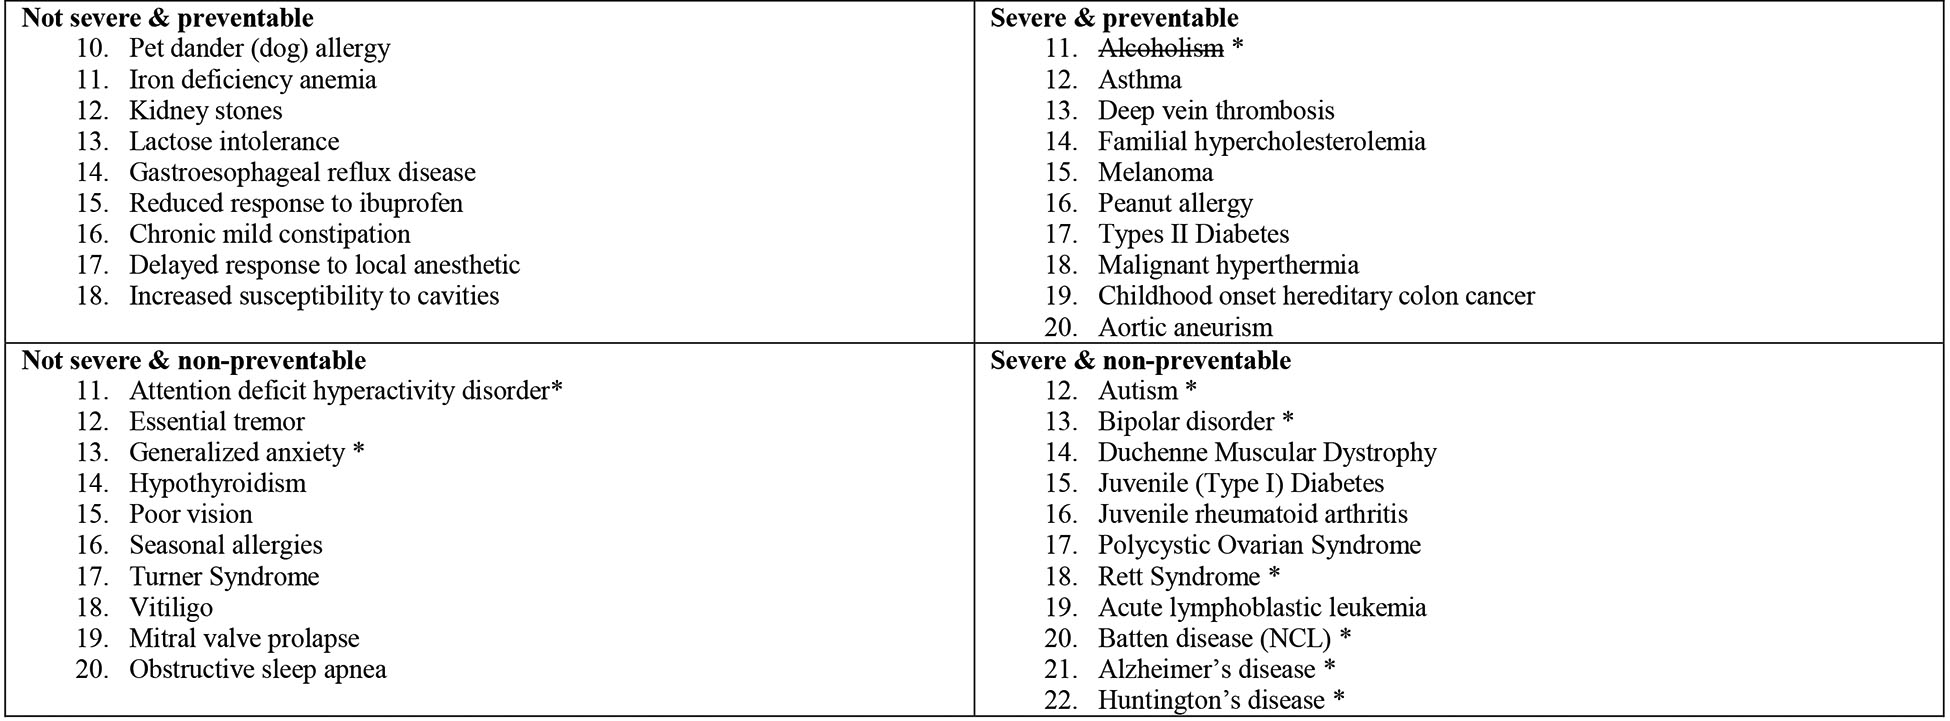
An example of a hypothetical result report for a participant who set his or her preferences to receive the following types of conditions: Preventable only, both severe and non-severe, opt out of mental health conditions.
Note: Conditions with a strikethrough are those that would not be disclosed. Conditions marked with an asterisk are included in the opt-out categories.
After participants were presented with their hypothetical result report they were asked to answer questions assessing their satisfaction with the process of setting preferences and the results. Additional questions assessed their perceived benefits and harms from receiving the hypothetical results they choose. The All and None groups were finished after these sets of questions while the Binary and Granular groups were given the option to reset their preferences. If participants indicated that they wanted to change their preferences, they were given the opportunity to reset them and then again answered questions about their satisfaction with the preference setting process and results.
Sample Design and Participants
The sample for this study was drawn from BCH patient population. Participants were parents or guardians of children who received care at BCH in the 24 months preceding the sample selection date. Eligibility criteria included being 18 years or older and having at least one child less than 18 years at the time of the study. Since a notification about the survey was sent by mail, and the survey was sent by email, the child’s medical record had to have an email address and mailing address for the parent. Parents were excluded if either the parent or their child had been, or was, enrolled in the Gene Partnership. Based on our previous experience of a 16% response rate to a previous mailed paper survey that we conducted29, we anticipated a slightly better response rate of 20% as the current survey was sent by email. We randomly selected 12,430 individuals to participate and be randomized into one of four groups. To allow more detailed analyses for the Binary and Granular groups the sample was disproportionately distributed: 15% of the participants were assigned to the All group, 15% to the None group, 30% to the Binary group, and 40% to the Granular group.
Survey dissemination
A pre-notification letter explaining the study was mailed to the potential parent participant and included the email address to which we were planning to email the survey, and in the letter we encouraged the parent to contact study staff by phone or email to update the email address if needed. The letter also indicated that participants who completed the survey would be entered into a raffle for one $100 Visa gift cards for every 100 completed surveys. Nine days after the pre-notification letter was mailed, the survey invitation email was sent to parents. The URL link to the survey directed participants to the biobank to which they were randomized. Participants were sent a maximum of three reminder emails.
Survey Pilot
The survey was piloted with 500 participants, randomly selected from the same sampling frame as used in the main study, and minor adjustments were made to the survey based on the results of the pilot study. In order to determine the number of undeliverable emails in the pilot survey, the final reminder email was sent out from an email account not connected with the web survey program (REDCap) allowing us to see which emails were “undeliverable” (7.4% of these emails). Of the delivered emails, the response rate was 21.6%. Data from the pilot study were not included in the final analyses.
Key Measures
We measured participants’ satisfaction with the process and the results themselves after participants were shown their Hypothetical Result Report which indicated which IRR they would or would not have received. The response scale ranged from 0 to 10 where 0 indicated “very dissatisfied” and 10 indicated “very satisfied”. For those in the Binary and Granular groups who reset their preferences, their satisfaction was assessed again after they saw their second Hypothetical Result Report. Analyses of satisfaction data used the final set of satisfaction ratings from each participant.
Finally, after receiving their Hypothetical Results Report participants were asked their opinions about the biobank and the preference setting process they had experienced with regard to each of the following four criteria: “For me, being a part of this type of biobank would be…” a) “a good thing”, b) “a bad thing”, c) “beneficial”, and d) “harmful”30. Each criterion was evaluated on a 5-point Likert scale, ranging from strongly disagree to strongly agree. For ease of presentation for this publication, the two most extreme response options on each side of the bipolar scale (strongly disagree and disagree, as well as agree and strongly agree) were collapsed into one since this did not change the results.
Data Management and Analyses
All web survey data were collected using REDCap28 and analyzed using Stata 12.131. Demographic characteristics and background information are shown as percentages or means. Fisher’s Exact tests and ANOVAs were used to test for differences between the four groups with regard to these characteristics. The mean satisfaction with the results and the preference setting process was compared between the groups using Kruskal-Wallis tests because the normal distribution assumption of ANOVA was violated. Participants’ opinions about the biobank to which they were assigned were also compared using Fisher’s Exact tests.
Multiple linear regression was conducted and only variables significant in the bivariate analyses were included in the regression models.
RESULTS
Response Rates and Sample Characteristics
The full survey was conducted in the same manner as the pilot. Sixty-three of the mailed pre-notification letters were not delivered and “returned to sender” and 72 participants asked to be removed from the study after receiving the pre-notification letter and were removed from the survey email list. Ninety-eight participants contacted study staff and provided updated email addresses. We sent 12,295 survey invitation emails and assumed the email undeliverable rate in the full survey was the same as in the pilot survey (7.35%) for an estimated 904 emails not delivered and 11,391 emails reaching respondents. A total of 2,718 respondents completed the survey for a response rate32 (RR3) of 23.9%. The maximum response rate difference between the groups was 2.4% and was not significantly different between groups: None group 24.6% (421/1,709), All group 24.7% (422/1,709), Binary group 24.9% (849/3,414), and Granular group 22.5% (1,026/4,559). In addition, 242 respondents completed at least 25% of the questions presented to them but not the complete survey and this was not significantly different between groups. The inclusion of the partial respondents yielded an overall response rate (RR4) of 26.0% (2,960/11,391). The percentage of partial respondents was lowest in the None group with 4.1% (18/439), followed by the All group with 5.8% (26/448) and the Binary group with 8.4% (78/927), and highest in the Granular group with 10.5% (120/1,146) which was also the longest of the 4 surveys. All subsequent analyses include partial respondents.
The demographic characteristics of the participants, overall and by group, are shown in Table 1, along with prior experience with research and genetic testing. Participants were on average 42.9 years old and the majority were female and Caucasian. The four groups did not show significant differences with regard to the demographic and background characteristics (Table 1).
Table 1.
Demographic and Background Characteristics
| Percentage/M | |||||||
|---|---|---|---|---|---|---|---|
| Characteristic | Total Na | All Groups Combined | None | All | Binary | Granular | P |
| Mean age (SD) | 2.905 | 42.9 (7.4) | 42.9 (7.3) | 43.1 (7.5) | 42.7 (7.4) | 43.0 (7.5) | .830 |
| Female | 2.960 | 91.0% | 91.8% | 91.3% | 90.0% | 91.5% | .615 |
| Race * | 2874 | All Groups | None | All | Binary | Granular | P |
| White | 93.2 | 92.7 | 92.8 | 92.7 | 93.9 | .675 | |
| Black | 2.4 | 2.1 | 2.5 | 3.2 | 1.8 | .267 | |
| Asian | 3.7 | 4.9 | 3.6 | 3.3 | 3.5 | .500 | |
| Native American or Alaskan Native | 0.4 | 0.2 | 0.2 | 0.3 | 0.6 | .829 | |
| Native Hawaiian or Other Pacific Islander | 0.1 | 0.0 | 0.2 | 0.1 | 0.1 | .747 | |
| Other | 1.6 | 1.6 | 2.0 | 1.3 | 1.7 | .743 | |
| Ethnicity | 2889 | ||||||
| Hispanic | 4.1% | 5.1% | 4.3% | 4.5% | 3.3% | ||
| Education | 2896 | .857 | |||||
| Eighth grade or less | 0.3% | 0.2% | 0.2% | 0.1% | 0.5% | ||
| Some high school but did not graduate | 0.5% | 0.2% | 0.7% | 0.6% | 0.4% | ||
| High school graduate or GED | 3.7% | 4.4% | 3.4% | 3.4% | 3.9% | ||
| Some college | 12.6% | 12.6% | 11.8% | 14.4% | 11.4% | ||
| 2-or-4-year college graduate | 38.0% | 37.4% | 39.0% | 38.0% | 37.9% | ||
| More than 4-year college degree | 45.0% | 45.1% | 44.9% | 43.5% | 46.1% | ||
| Work in health care | 2960 | 23.6% | 24.2% | 24.1% | 24.0% | 22.9% | .904 |
| Prior participation in research | 2959 | 37.0% | 40.1% | 38.6% | 36.4% | 35.6% | .332 |
| Prior genetic testing experience | 2960 | 40.9% | 42.8% | 42.2% | 39.9% | 40.4% | .688 |
| Child diagnosed with genetic disorder | 2960 | 23.2% | 23.7% | 23.0% | 23.4% | 23.0% | .990 |
Differences in the number (N) for each item reflect the fact that not everyone answered every question
Legend:
multiple selections possible
Participant Satisfaction with Preference Setting Process and Results
Significant differences in satisfaction ratings were observed among groups (Table 2), indicating that participants assigned to the Granular group are the most satisfied with both the preference setting process and the hypothetical results they had received while the None group was the least satisfied. The Binary and All groups rated their satisfaction very similar and nearly as high as the Granular group.
Table 2.
Participant Satisfaction With the Process and the Results Received by Group Randomized to, Demographic Characteristics, and Baseline Attitudes
| Satisfaction with process | Satisfaction with results | |||
|---|---|---|---|---|
| M(SD) | P | M(SD) | P | |
| Group randomized to | ||||
| Group (n = 2,805) | ||||
| None | 3.17 (2.95) | <.001 | 3.69 (3.02) | <.001 |
| All | 6.50 (2.42) | 6.09 (2.47) | ||
| Binary | 6.65 (2.51) | 6.06 (2.63) | ||
| Granular | 7.30 (2.20) | 7.00 (2.28) | ||
| Demographic characteristics | ||||
| gender (n = 2805) | ||||
| Male | 6.29 (2.78) | .753 | 5.98 (2.70) | .636 |
| Female | 6.35 (2.82) | 6.07 (2.77) | ||
| Age (n= 2752) | ||||
| <35 years | 6.46 (2.87) | .675 | 6.12 (2.89) | .958 |
| 35–39 years | 6.42 (2.72) | 6.05 (2.63) | ||
| 40–44 years | 6.35 (2.89) | 6.09 (2.84) | ||
| 45–49 years | 6.33 (2.75) | 6.05 (2.72) | ||
| 50+ years | 6.20 (2.89) | 5.99 (2.80) | ||
| Education (n= 2749) | ||||
| Some grade school | 5.88 (2.95) | .745 | 6.75 (2.19) | .462 |
| Some high school | 6.85 (2.27) | 7.00 (2.31) | ||
| Graduated high school | 6.33 (3.24) | 6.25 (2.90) | ||
| Some college | 6.45 (2.88) | 6.21 (2.81) | ||
| 2-or 4-year college graduate | 6.41 (2.76) | 6.08 (2.70) | ||
| Post college graduate course or degree | 6.26 (2.81) | 5.98 (2.81) | ||
| Hispanic | ||||
| No | 6.36 (2.81) | .219 | 6.09 (2.77) | .014 |
| Yes | 6.02 (2.83) | 5.42 (2.91) | ||
| Caucasian race (n=2805) | ||||
| No | 6.16 (2.76) | .265 | 5.72 (2.72) | .037 |
| Yes | 6.36 (2.83) | 6.10 (2.77) | ||
| African American race (n=2805) | ||||
| No | 6.34 (2.82) | .881 | 6.08 (2.76) | .144 |
| Yes | 6.29 (2.99) | 5.54 (2.99) | ||
| Asian race (n= 2805) | ||||
| No | 6.36 (2.83) | .218 | 6.08 (2.76) | .080 |
| Yes | 6.00 (2.61) | 5.59 (2.82) | ||
| Working in health care (n=2805) | ||||
| No | 6.40 (2.71) | .067 | 6.06 (2.73) | .875 |
| Yes | 6.17 (2.96) | 6.09 (2.82) | ||
| Baseline attitudes | ||||
| Previous research experience (n=2805) | ||||
| No | 6.37 (2.75) | .512 | 6.05 (2.73) | .691 |
| Yes | 6.30 (2.94) | 6.09 (2.82) | ||
| Previous genetic testing (n=2805) | ||||
| No | 6.40 (2.71) | .207 | 6.09 (2.71) | .533 |
| Yes | 6.26 (2.97) | 6.03 (2.85) | ||
| Child with genetic diagnosis (n=2805) | ||||
| No | 6.33 (2.82) | .602 | 6.03 (2.76) | .293 |
| Yes | 6.39 (2.83) | 6.16 (2.80) | ||
| Some reasons I might want information are… | ||||
| It might help me prepare for the future (n=2805) | ||||
| Noa | 5.66 (2.77) | <.001 | 5.57 (2.69) | .002 |
| Yesb | 6.42 (2.82) | 6.12 (2.77) | ||
| It might help me feel more in control over myfuture (n=2805) | ||||
| Noa | 5.75 (2.79) | <.001 | 5.66 (2.64) | <.001 |
| Yesb | 6.54 (2.80) | 6.20 (2.80) | ||
| It might prevent me from worrying (n=2805) | ||||
| Noa | 6.12 (2.76) | <.001 | 5.86 (2.68) | .026 |
| Yesb | 6.55 (2.86) | |||
| It might help me seek medical treatments for my child (n=2805) | ||||
| Noa | 5.82 (2.93) | .002 | 5.71 (2.78) | .026 |
| Yesb | 6.40 (2.80) | 6.10 (2.76) | ||
| Some reasons I might not want information are… | ||||
| I fear that I might find out something I don’t want to know (n=2805) | ||||
| Noa | 6.45 (2.91) | .025 | 6.12 (2.87) | .199 |
| Yesb | 6.21 (2.69) | 5.99 (2.62) | ||
| It might cause me anxiety (n=2805) | ||||
| Noa | 6.42 (2.97) | .237 | 6.06 (2.96) | .989 |
| Yesb | 6.29 (2.70) | 6.06 (2.61) | ||
| I think it’s the doctor’s job to deal with health information, not mine (n=2805) | ||||
| Noa | 6.34 (2.82) | .778 | 6.06 (279) | .414 |
| Yesb | 6.22 (2.61) | 6.41 (2.48) | ||
| Sometimes, ignorance is bliss (n=2805) | ||||
| Noa | 6.36 (2.85) | .389 | 6.07 (2.80) | .835 |
| Yesb | 6.23 (2.63) | 6.04 (2.55) | ||
| I find the information hard to understand (n=2805) | ||||
| Noa | 6.34 (2.84) | .670 | 6.06 (2.79) | .600 |
| Yesb | 6.43 (2.52) | 6.16(2.45) | ||
| Comfort | ||||
| Comfortable with the possibility of getting genetic research results about your child from a biobank study (n=2805) | ||||
| Noa | 5.75 (2.45) | <.001 | 5.57 (2.38) | <.001 |
| Yesb | 6.57 (2.92) | 6.25 (2.88) | ||
Note: The total number of respondents might be different for the rows of this table. They are based on the number of respondents who answered both questions and not every respondent answered every question.
”No” represents the combined response categories “neither agree nor disagree,” “disagree,” and “strongly disagree.”
”Yes” represents the combined response categories “agree” and “strongly agree”
”No” represents the combined response categories “neutral,” “somewhat uncomfortable,” and “very uncomfortable.”
”Yes” represents the combined response categories “somewhat comfortable” and “very comfortable”
We then looked at baseline factors associated with satisfaction with the preference setting process and the hypothetical results they had received (Table 2). None of the demographic factors were associated with satisfaction with the process. Only non-Hispanic ethnicity (p=0.014) and Caucasian race (p=0.037) were associated with greater satisfaction with the results. For the overall sample, satisfaction with both process and hypothetical results was associated with perceiving that novel information might (might not) help to: 1) prepare for the future; 2) feel more in control over my future; 3) prevent me from worrying; and 4) seek medical treatments for my child (p <0.001 to p=0.026). Decreased satisfaction with the process was associated with fear of “finding out something I don’t want to know”. Being comfortable with the possibility of getting genetic research result about their child was also associated with greater satisfaction with both the process and results.
We then compared satisfaction with the process and results received between the groups (Table 3). The Granular group was more satisfied than all other groups, the Binary was more satisfied than the None group, and the All was more satisfied than the None group (all p<0.001). The Binary group was equally satisfied as the All group. In a multiple linear regression model we assessed the simultaneous association of demographics and the baseline variable with satisfaction with the process and with satisfaction with the results (Table 4). For both dependent variables, satisfaction with the process and the results was associated with type of biobank assigned and comfort with the possibility of receiving genetic research results about one’s child; satisfaction with the process was associated with the perception that returned results would help a participant feel “more in control over my future”.
Table 3.
Post Hoc Multiple Comparisons of Satisfaction With the Preference-Setting Process and the Hypothetical Results Received Across Groups
| Satisfaction with process | Satisfaction with results | ||||
|---|---|---|---|---|---|
| Group I | Group II | Mean difference (I-J) | P | Mean difference (I-J) | P |
| Granular | Binary | 0.65 | <.001 | 0.94 | <.001 |
| All | 0.79 | <.001 | 0.92 | <.001 | |
| None | 4.12 | <.001 | 3.31 | <.001 | |
| Binary | All | −0.15 | 1.00 | −0.03 | 1.00 |
| None | 3.48 | <.001 | 2.37 | <.001 | |
| All | None | 3.33 | <.001 | 2.39 | <.001 |
Table 4.
Multiple Linear Regression Predicting Satisfaction With the Process and Satisfaction With the Results
| Satisfaction with the process (n = 2,652) |
Satisfaction with the results (n = 2,651) |
|||
|---|---|---|---|---|
| Regression coefficient | P | Regression coefficient | P | |
| Model constant | 2.60 | <.001 | 3.21 | <.001 |
| All groupa | 3.33 | <.001 | 2.46 | <.001 |
| Binary groupa | 3.49 | <.001 | 2.46 | <.001 |
| Granular groupa | 4.12 | <.001 | 3.38 | <.001 |
| Male | −0.09 | .596 | −0.09 | .608 |
| Age in categories | −0.05 | .179 | −0.01 | .760 |
| Education | −0.05 | .442 | −0.10 | .086 |
| Hispanic | −0.22 | .367 | −0.35 | .177 |
| Caucasian race | 0.16 | .345 | 0.32 | .073 |
| Child with genetic diagnosis | 0.03 | .821 | 0.13 | .265 |
| It might help me prepare for the futureb | 0.13 | .528 | 0.13 | .532 |
| It might help me feel more in control over my futureb | 0.51 | <.001 | 0.22 | .118 |
| It might prevent me from worryingb | 0.06 | .584 | 0.20 | .076 |
| It might help me seek medical treatments for my childb | −0.10 | .587 | −0.12 | .541 |
| I fear that I might find out something I don’t want to knowb | −0.12 | .227 | −0.02 | .854 |
| Comfortable with the possibility of getting genetic research Results about your child from a biobank studyb | 0.62 | <.001 | 0.58 | <.001 |
The comparison group is the “None group”
Response categories dichotomized into “Yes” (positive categories) and “No” (middle option and negative categories).
We then included interactions between the biobank the respondents were randomized to and their answers to the questions why they might or might not want to receive results in order to assess if the relationship between the assigned biobank and the satisfaction with the process and the results varies as a function of different baseline preferences with regard to receiving results. Significant interactions were observed among type of biobank and perceiving that IRR would enhance participants’: 1) feelings of being in control of one’s future, and 2) comfort with the possibility of getting genetic research results about their child. We found that although overall those in the None group were less satisfied than those in the other groups, as previously described, satisfaction within the None group was greater for those who agreed with the statement that they feared they might find something that they didn’t want to know compared to those who disagreed with this statement, whereas within the Binary and All groups satisfaction was greater for those who disagreed with the fear statement compared to those who agreed. A similar pattern emerged for the interaction between biobank randomized to and being comfortable with the possibility of getting genetic research result about their child with the pattern in the None group differing from the other groups. Within the None group those who were comfortable were less likely to be satisfied compared to those who disagreed with the comfort statement, whereas those within the other 3 biobanks who agreed with the comfort statement were more likely to be satisfied with the biobank randomized to.
Participants’ Opinions towards Biobanks
When asked to evaluate the biobank they had experienced, participants’ opinions were significantly different in three of the four characteristics (Table 5). Proportionately fewer participants in the None group agreed that the biobank to which they were assigned was “a good thing” or “beneficial” compared to the other groups. Proportionately more participants in the None group agreed with the statement that the biobank they experienced was “a bad thing”. The All, Binary, and Granular groups showed similar distributions of opinions across all four characteristics. Interestingly, no significant difference could be found between the four groups with regard to the statement that the biobank was harmful.
Table 5.
Participant Opinions About Biobank
| None (%) | All (%) | Binary (%) | Granular (%) | P | |
|---|---|---|---|---|---|
| A good thing | |||||
| Strongly disagree/disagree | 9.50 | 2.35 | 2.81 | 1.85 | <.001 |
| Neither agree nor disagree | 23.28 | 16.47 | 18.71 | 16.52 | |
| Strongly agree/agree | 67.22 | 81.18 | 78.48 | 81.63 | |
| A bad thing | |||||
| Strongly disagree/disagree | 61.76 | 72.00 | 74.30 | 77.84 | <.001 |
| Neither agree nor disagree | 27.08 | 24.24 | 20.56 | 18.27 | |
| Strongly agree/agree | 11.16 | 3.76 | 5.14 | 3.89 | |
| Beneficial | |||||
| Strongly disagree/disagree | 8.31 | 2.35 | 2.57 | 2.14 | <.001 |
| Neither agree nor disagree | 28.50 | 27.06 | 22.31 | 23.62 | |
| Strongly agree/agree | 63.18 | 70.59 | 75.12 | 74.25 | |
| Harmful | |||||
| Strongly disagree/disagree | 64.13 | 70.82 | 71.38 | 72.30 | .110 |
| Neither agree nor disagree | 29.22 | 24.24 | 23.48 | 22.93 | |
| Strongly agree/agree | 6.65 | 4.94 | 5.15 | 4.76 | |
Discussion
As genetic analyses have become more accessible research tools for gene discovery, questions about if, when, and how to return genomic information to research participants have become more pressing. This is particularly true in large biobank research where thousands of individuals may be enrolled, and extensive and multiple analyses may be performed with potential for myriad findings. Recent recommendations and guidelines have suggested that although returning results to participants in genomic research is not an obligation, it may be desirable15,16. One of the biggest limitations to returning genomic research results to participants is feasibility – the model is costly, and adequately educating and guiding participants about types of results they could receive to enable informed choices is challenging. Our goal was to use the return of hypothetical results to evaluate the stability of preferences and satisfaction with process for four biobank types, including a biobank that implemented a preference setting model.
This is the only study that we are aware of where participants are randomized to biobanks with different return of results policies that includes a biobank where the participant designates their preferences for return of IRR. We elucidate specific responses of participants randomized to different biobank conditions including a novel condition that enables specification of granular preferences for IRR—an issue of high public health and biomedical significance. Our results demonstrate that choice matters with respect to participant satisfaction, with more nuanced choice associated with greatest satisfaction. We found that with the exception of harm, those in None group had the most negative views about the process and the biobank compared to the other groups. When it came to hypothetical results received, those in the Granular group showed the greatest satisfaction, the None group were the least satisfied, and the All and Binary groups were in between. Thus the benefits of enrolling in a biobank appear to be perceived as the greatest by those who receive results and those who have choices regarding what to receive. The finding that return of results led to greater satisfaction is not unexpected as others have shown that participants are more likely to enroll in a biobank if there is return of research results4,33. Our results take these findings one step further and examine participant satisfaction once enrolled in a hypothetical biobank, and we show that indeed satisfaction is higher for those enrolled in a biobank where they received hypothetical results.
Our results also show that, although satisfaction was highest for those enrolled in the Granular group, satisfaction was still reasonably high in those who received all results or had a choice between all and none. Thus having a choice, even it is just all or none, or just receiving results, provides more satisfaction than no return of results. The implication is that providing granular preferences may not be needed and that just offering a choice of all or none may be adequately beneficial without requiring an infrastructure to support granular preferences.
There has been much concern about potential harms in return of genomic results. Interestingly, there was no significant difference between the four groups with regard to the statement that the biobank was harmful. Thus although there is a concern of greater psychological harms with return of results, we did not see any increase in harms in the Granular group. These findings are consistent with the finding of an association with baseline reasons for wanting information, including benefits of preparing for the future, having more control over the future, preventing worry, and seeking medical treatments, with increased satisfaction with the process and results. Thus it appears that satisfaction is associated with reasons to want information (benefits) and not reasons to NOT want information (harms).
There are limitations to our study. The biobank and the results returned were hypothetical. However, randomizing participants to different biobanks allowed us to compare across groups even though the scenario was hypothetical. The response rate was low, at about 24%, although this was higher than our previous mailed paper survey, and respondents were generally Caucasian, well-educated, and female, all of which may affect generalizability. The dropout rate during the survey was highest for the Granular group, which was not unexpected since the Granular survey was longer and more involved.
Return of genomic results from biobank research will be a challenge. In the future, with adequate online education and an opportunity to see what types of results one might receive after setting preferences, may make the ability to set granular preference for return of results a feasibly reality.
Best Practices
Recent recommendations have suggested that returning results to participants in genomic research may be desirable. One of the biggest limitations, however, is feasibility. Our goal was to use the return of hypothetical results to evaluate the stability of preferences and satisfaction with process for four biobank types, including a biobank that implemented a preference setting model. Our results also show that, although having a choice, even it is just all or none, or just receiving results, provides more satisfaction than no return of results, a more granular choice is the most desirable. Our findings suggest that biobank researchers may want to consider return of results and some degree of preference setting to enhance enrollment and satisfaction. Our findings also suggest that an online tool, such as the one we developed and implemented, may make preference setting feasible.
Research Agenda
We have now tested a preference-setting tool in an online format with a large cohort of individuals using hypothetical scenarios. The next step is to implement in a biobank where actual results are being returned to participants and to study the outcomes in terms of benefits, harms, and satisfaction.
Educational Implications
We have implemented a model for return of results that provides education for participants and that removes some burden from researchers to return results from large studies on a of case-by-case basis. The model teaches participants to consider the potential beneficial and harmful implications of IRRs.
Acknowledgements
This work was supported by the National Human Genome Research Institute/National Institutes of Health (NIH) grants NHGRI R01 HG006615 (Holm, PI) , NHGRI U01HG006828 (Holm, PI) , and NHGRI U19 HD077671 (Green, PI, Holm, Christensen).
Sources of funding: NHGRI R01 HG006615–02 (Holm, PI); NHGRI U01HG006828–01 (Holm) – eMERGE; NHGRI U19 HD077671 (Holm, Green, Christensen)
Footnotes
Conflict of interest: None of the authors has a conflict of interest.
REFERENCES
- 1.Harris ED, Ziniel SI, Amatruda JG, et al. The beliefs, motivations, and expectations of parents who have enrolled their children in a genetic biorepository. Genetics in Medicine. March 2012;14(3):330–337. [DOI] [PMC free article] [PubMed] [Google Scholar]
- 2.Kaufman DJ, Murphy-Bollinger J, Scott J, Hudson KL. Public opinion about the importance of privacy in biobank research. American Journal of Human Genetics. November 2009;85(5):643–654. [DOI] [PMC free article] [PubMed] [Google Scholar]
- 3.Shalowitz DI, Miller FG. Communicating the results of clinical research to participants: attitudes, practices, and future directions. PLoS Medicine. May 13 2008;5(5):e91. [DOI] [PMC free article] [PubMed] [Google Scholar]
- 4.O’Daniel J, Haga SB. Public perspectives on returning genetics and genomics research results. Public Health Genomics. 2011;14(6):346–355. [DOI] [PMC free article] [PubMed] [Google Scholar]
- 5.Wolf SM. The past, present, and future of the debate over return of research results and incidental findings. Genetics in Medicine. April 2012;14(4):355–357. [DOI] [PMC free article] [PubMed] [Google Scholar]
- 6.Wolf SM, Crock BN, Van Ness B, et al. Managing incidental findings and research results in genomic research involving biobanks and archived data sets. Genetics in Medicine. April 2012;14(4):361–384. [DOI] [PMC free article] [PubMed] [Google Scholar]
- 7.Fabsitz RR, McGuire A, Sharp RR, et al. Ethical and practical guidelines for reporting genetic research results to study participants: updated guidelines from a National Heart, Lung, and Blood Institute working group. Circ Cardiovasc Genet. December 1 2010;3(6):574–580. [DOI] [PMC free article] [PubMed] [Google Scholar]
- 8.NCI. Workshop on Release of Research Results to Participants in Biospecimen Studies. 2010; Bethesda, MD. [Google Scholar]
- 9.Green RC, Berg JS, Grody WW, et al. ACMG recommendations for reporting of incidental findings in clinical exome and genome sequencing. Genetics in Medicine. June 20 2013. [DOI] [PMC free article] [PubMed] [Google Scholar]
- 10.ACMG. ACMG Updated Recommendation on “Opt Out” for Genome Sequencing Return of Results 2014; https://www.acmg.net/docs/Release_ACMGUpdatesRecommendations_final.pdf.
- 11.Caulfield T, McGuire AL, Cho M, et al. Research ethics recommendations for whole-genome research: consensus statement. PLoS Biology. March 25 2008;6(3):e73. [DOI] [PMC free article] [PubMed] [Google Scholar]
- 12.Clayton EW, Smith M, Fullerton SM, et al. Confronting real time ethical, legal, and social issues in the Electronic Medical Records and Genomics (eMERGE) Consortium. Genetics in Medicine. October 2010;12(10):616–620. [DOI] [PMC free article] [PubMed] [Google Scholar]
- 13.Kohane IS, Mandl KD, Taylor PL, Holm IA, Nigrin DJ, Kunkel LM. Medicine. Reestablishing the researcher-patient compact. Science. May 11 2007;316(5826):836–837. [DOI] [PubMed] [Google Scholar]
- 14.Kohane IS, Taylor PL. Multidimensional results reporting to participants in genomic studies: getting it right. Sci Transl Med. June 23 2010;2(37):37cm19. [DOI] [PubMed] [Google Scholar]
- 15.Presidential-Commission-for-the-Study-of-Bioethical-Issues. ANTICIPATE and COMMUNICATE: Ethical Management of Incidental and Secondary Findings in the Clinical, Research, and Direct-to-Consumer Contexts. In: Services USDoHH, ed; Washington, D.C: 2013. [DOI] [PubMed] [Google Scholar]
- 16.Jarvik GP, Amendola LM, Berg JS, et al. Return of genomic results to research participants: the floor, the ceiling, and the choices in between. American Journal of Human Genetics. June 5 2014;94(6):818–826. doi: 810.1016/j.ajhg.2014.1004.1009 Epub 2014 May 1018. [DOI] [PMC free article] [PubMed] [Google Scholar]
- 17.Ravitsky V, Wilfond BS. Disclosing individual genetic results to research participants. American Journal of Bioethics. Nov-Dec 2006;6(6):8–17. [DOI] [PubMed] [Google Scholar]
- 18.Foster MW, Mulvihill JJ, Sharp RR. Evaluating the utility of personal genomic information. Genetics in Medicine. August 2009;11(8):570–574. [DOI] [PubMed] [Google Scholar]
- 19.Grosse SD, Kalman L, Khoury MJ. Evaluation of the validity and utility of genetic testing for rare diseases. Adv Exp Med Biol. 2010;686:115–131. [DOI] [PubMed] [Google Scholar]
- 20.Grosse SD, McBride CM, Evans JP, Khoury MJ. Personal utility and genomic information: look before you leap. Genet Med. Aug 2009;11(8):575–576. [DOI] [PMC free article] [PubMed] [Google Scholar]
- 21.Khoury MJ, McBride CM, Schully SD, et al. The Scientific Foundation for personal genomics: recommendations from a National Institutes of Health-Centers for Disease Control and Prevention multidisciplinary workshop. Genetics in Medicine. August 2009;11(8):559–567. [DOI] [PMC free article] [PubMed] [Google Scholar]
- 22.Rothstein MA. Tiered disclosure options promote the autonomy and well-being of research subjects. Am J Bioeth. Nov-Dec 2006;6(6):20–21; author reply W10–22. [DOI] [PubMed] [Google Scholar]
- 23.Holm IA, Savage SK, Green RC, et al. Guidelines for return of research results from pediatric genomic studies: deliberations of the Boston Children’s Hospital Gene Partnership Informed Cohort Oversight Board. Genetics in Medicine. January 9 2014;9(10):190. [DOI] [PubMed] [Google Scholar]
- 24.Holm IA, Taylor PL. The Informed Cohort Oversight Board: from Values to Architecture. Minn. J. L. Sci. & Tech 2012;13(2):669–690. [PMC free article] [PubMed] [Google Scholar]
- 25.Bacon PL, Harris E, Savage SK, et al. The Development of a Preference Setting Model for the Return of Individual Genomic Research Results. Journal of Empirical Research and Human Research Ethics. In press. [DOI] [PubMed] [Google Scholar]
- 26.Vassy JL, Lautenbach DM, McLaughlin HM, et al. The MedSeq Project: a randomized trial of integrating whole genome sequencing into clinical medicine. Trials. March 20 2014;15:85.(doi):10.1186/1745-6215-1115-1185. [DOI] [PMC free article] [PubMed] [Google Scholar]
- 27.DuBenske LL, Burke Beckjord E, Hawkins RP, Gustafson DH. Psychometric evaluation of the Health Information Orientation Scale: a brief measure for assessing health information engagement and apprehension. J Health Psychol. September 2009;14(6):721–730. doi: 710.1177/1359105309338892. [DOI] [PMC free article] [PubMed] [Google Scholar]
- 28.Harris PA, Taylor R, Thielke R, Payne J, Gonzalez N, Conde JG. Research electronic data capture (REDCap)—A metadata-driven methodology and workflow process for providing translational research informatics support. Journal of Biomedical Informatics. 2009;42(2):377–381. [DOI] [PMC free article] [PubMed] [Google Scholar]
- 29.Ziniel SI, Savage SK, Huntington N, et al. Parents’ preferences for return of results in pediatric genomic research. Public Health Genomics. 2014;17(2):105–114. doi: 110.1159/000358539 Epub 000352014 Mar 000358513. [DOI] [PMC free article] [PubMed] [Google Scholar]
- 30.Wade CH, Shiloh S, Woolford SW, et al. Modelling decisions to undergo genetic testing for susceptibility to common health conditions: an ancillary study of the Multiplex Initiative. Psychol Health. 2012;27(4):430–444. doi: 410.1080/08870446.08872011.08586699 Epub 08872011 Jun 08870449. [DOI] [PMC free article] [PubMed] [Google Scholar]
- 31.Stata Statistical Software: Release 12 [computer program]. StataCorp LP, College Station, TX; 2011. [Google Scholar]
- 32.Standard Definitions: Final Dispositions of Case Codes and Outcome Rates for Surveys. 7th edition ed: The American Association for Public Opinion Research; 2011. [Google Scholar]
- 33.Kaufman D, Murphy J, Scott J, Hudson K. Subjects matter: a survey of public opinions about a large genetic cohort study. Genetics in Medicine. November 2008;10(11):831–839. [DOI] [PubMed] [Google Scholar]