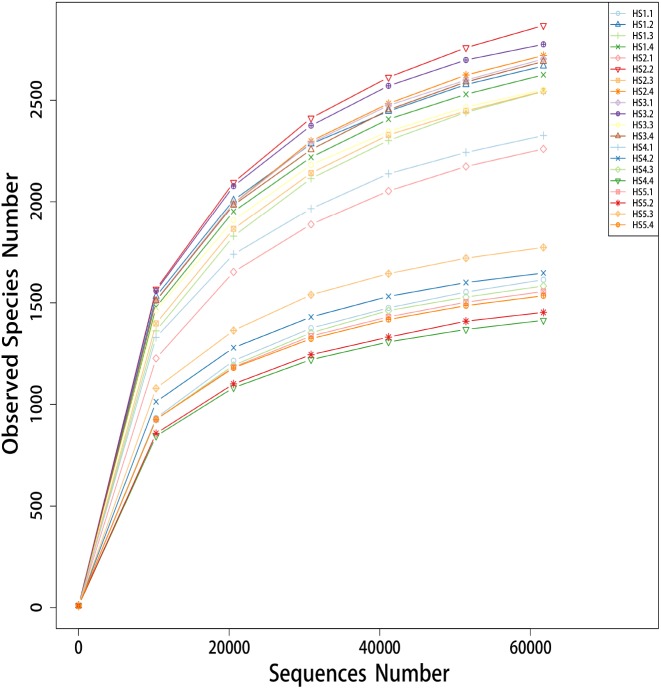
Figure 1. The rarefaction analysis anomg the 20 different samples.
The group HS1 samples included sheep HS1.1, HS1.2, HS1.3 and HS1.4. The treatment HS2 samples included sheep HS2.1, HS 2.2, HS2.3 and HS4. The treatment HS3 samples included sheep HS3.1, HS3.2 HS3.3 and HS3.4. The treatment HS4 samples included HS4.1, HS4.2, HS4.3 and H4.4. The treatment HS5 samples included HS5.1, HS5.2, HS5.3 and H5.4. The treatment HS1, concentrate to forage ratio 0:100; HS2, concentrate to forage ratio 15:85; HS3, concentrate to forage ratio 30:70; HS4, concentrate to forage ratio 45:55; HS5, concentrate to forage ratio 60:40.

