Abstract
Immune responses generally decline with age. However, the dynamics of this process at the individual level have not been characterized, hindering quantification of an individual’s immune age. Here, we use multiple ‘omics’ technologies to capture population- and individual-level changes in the human immune system of 135 healthy adult individuals of different ages sampled longitudinally over a nine-year period. We observed high inter-individual variability in the rates of change of cellular frequencies that was dictated by their baseline values, allowing identification of steady-state levels toward which a cell subset converged and the ordered convergence of multiple cell subsets toward an older adult homeostasis. These data form a highdimensional trajectory of immune aging (IMM-AGE) that describes a person’s immune status better than chronological age. We show that the IMM-AGE score predicted all-cause mortality beyond well-established risk factors in the Framingham Heart Study, establishing its potential use in clinics for identification of patients at risk.
Reporting Summary.
Further information on experimental design is available in the Nature Research Reporting Summary linked to this article.
The human immune system changes with age, ultimately leading to a clinically evident, profound deterioration resulting in high morbidity and mortality rates attributed to infectious and chronic diseases1. At the cellular level, population-based cross-sectional studies have shown that many immune components change with age, spanning both the innate and adaptive arms of the immune system, and involving changes in cellular frequencies and altered functional capacity2–8. Concomitant with the overall down- regulation of immune responsiveness with aging, a moderate rise in circulating inflammatory mediators, commonly termed ‘inflammaging’9, is often observed. Inflammaging seems central to most chronic diseases of older age and is the root cause of decreased cellular responsiveness10,11.
However, aging does not affect all immune systems equally. Genetics is involved in shaping the immune-system composition12–14, an effect that declines with age15 owing to an individual’s life history. Taken together, genetic and environmental variation introduces substantial inter-individual variability of many immune features that increases with age16,17. Previous studies have used this variability to identify biomarkers based on individual immune phenotypes at baseline that are correlated with clinical outcomes18. A recent cross-sectional study has shown that healthy human immune states are continuous rather than stratified into discrete phenotypes, with the major axis of variation dictated by immune-senescence features, such that individuals of the same chronological age may differ in their immune age19. Such decoupling has been further shown in other biological age metrics, including both molecular (for example, methylation20) and clinical (for example, frailty21) metrics.
This high inter-individual variability highlights the necessity of longitudinal tracking to study the gradual changes the immune system undergoes with age. However, so far, longitudinal studies tracking the immune system over time have been either short in duration (weeks to months)6,22 or low in resolution, covering a small fraction of the system’s dynamics23–25. The relative stability of the immune system suggests that changes over short time spans are subtle, mistakenly suggesting that individuals’ immune profiles do not change, whereas a longer tracking period may allow for their systematic longitudinal characterization. Furthermore, the complexity and variability of the immune system suggest that data from independent studies addressing different immune components cannot be completely merged to yield a comprehensive system-wide understanding of immunological aging, and that low-dimensional biomarkers cannot capture the system’s complexity reproducibly.
The immune system monitors the external and internal environments of an individual, and thus changes as a function of the environment. The dynamics of such systems are commonly studied in the natural world using a dynamical systems framework26 that represents a system’s state as a point in a high-dimensional space corresponding to the amounts/values of the system’s components. The dynamic behavior of the system is represented by the rate of change of the system’s components at each point in space. Though most points in space exhibit nonzero rates, special emphasis is placed on points at which the system’s rate is zero, corresponding to steady states on which the system may converge to yield attractor points representing homeostatic states in which the system is resilient to small perturbations.
Here, we used multiple ‘omics’ technologies in a cohort of >100 adults of different ages who were sampled longitudinally over the course of 9 years to comprehensively capture population- and individual-level changes in the immune system over time. Using dynamical systems tools, we identified cell-subset dynamics that lead toward a high-dimensional attractor point, namely a novel homeostasis of older adults. We show that the cellular immune profiles of our cohort were distributed throughout a continuous trajectory along which older adults’ immune systems changed over time, dictating an immunological age metric that predicts overall survival independent of age, gender and cardiovascular disease.
Results
Longitudinal tracking of multiple immune features.
To assess at high resolution the dynamics of older adults’ immune systems, we conducted multi-omics profiling of peripheral blood samples collected annually from young and older adults during the years 2007–2015 as part of the Stanford-Ellison longitudinal aging study. The cohort included 135 healthy individuals: 63 young adults (aged 20–31 at enrollment) and 72 older adults (aged 60–96 at enrollment) (Supplementary Table 1, Extended Data Fig. 1a–c and Methods). Samples were profiled by two experimental designs that yielded two data sets: an ongoing design, in which samples were profiled annually using a suite of technological platforms available at that time for measuring cellular phenotyping, cytokine-stimulation assays and whole-blood gene-expression (Methods); and a snapshot design, in which longitudinal samples of 18 participants of the ongoing data set (3 young adults and 15 older adults) were assayed simultaneously for deep phenotyping of blood cell subsets by mass cytometry, thereby removing much of the complication of year-to-year technical variation (Extended Data Fig. 1d,e). This complementary dual design allowed for a comprehensive and reasonably powered longitudinal analysis of immune system changes over time (Fig. 1).
Fig. 1 |. Study design.

Peripheral blood samples from 135 healthy individuals (63 young and 72 older adults) were collected over 9years. The snapshot cohort included 18 individuals that were profiled at the end of the seventh year (2013) by cell subset phenotyping, whereas the entire ongoing cohort was profiled annually for cell subset phenotyping, functional responses of cells to cytokine stimulations, and whole-blood gene expression.
Individuals’ cellular immune profiles vary in their baseline values and rates of change.
To understand the dynamics of immune cells in healthy older adults, we first analyzed the snapshot data set profiled by single-cell mass cytometry (CyTOF). We manually gated 73 immune-cell subsets (Supplementary Fig. 1 and Supplementary Table 2), and, for each one of them, we calculated the group-and individual-level longitudinal slopes in frequency for older adults (Methods and Supplementary Tables 3 and 4). For most cell subsets, the group-level longitudinal slopes matched the known directions of age-induced alterations. For instance, naive CD8+ T cells exhibited a decline over time at the group level (ta. 2a). However, though the longitudinal individual-level slopes were skewed toward the direction of the longitudinal group-level slopes, they exhibited high inter-individual variability, including individuals changing in an opposite direction to the group slope (Fig. 2a). This behavior was observed for multiple immune-cell subsets such as B cells, CD8+CD28− T cells, natural killer (NK) cells and CD8+ T cells expressing CD57 (refs. 27,28; Fig. 2b).
Fig. 2 |. Individuals’ cellular immune profiles exhibit inter-individual variability both at baseline and in their rate of change.
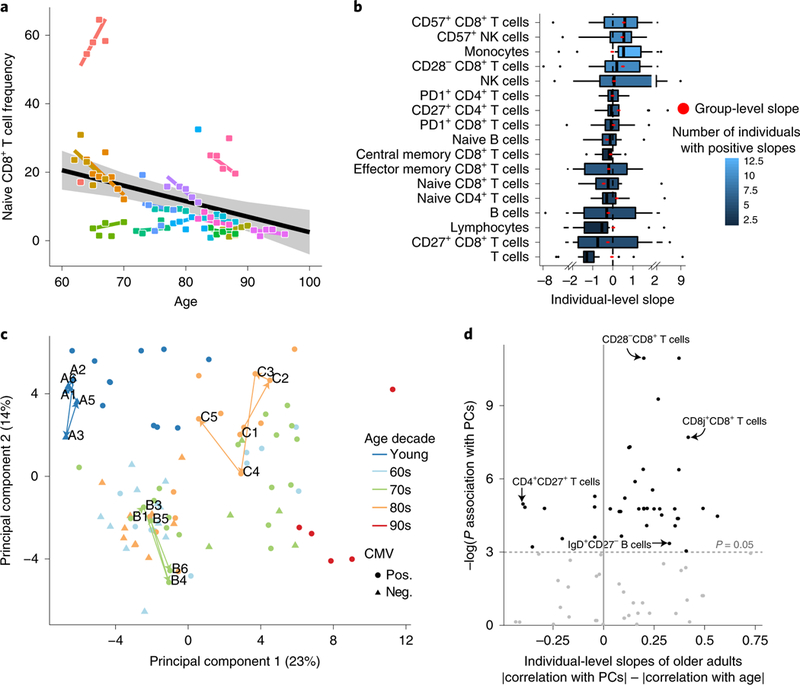
PBMC samples of 18 individuals sampled annually over a 7-year period of the snapshot data set were profiled at high resolution by mass cytometry and manually gated into 73 distinct cell populations. a, Individuals vary in their rate of change of naive CD8+ T cells over time. Shown are the group-level longitudinal regression line (black line, derived from mixed-linear model) and the individual-level lines of each individual (colored by individual). Shaded area denotes confidence interval. b, The frequencies of multiple cell subsets changed at different rates (slopes) among older adults. Boxplots show the distribution of individual- level longitudinal slopes of cell-subset frequencies for 17 immunosenescence-associated cell subsets (n = 15 older adults; boxes represent 25th and 75th percentiles around the median (line); whiskers, 1.5× interquantile range). Group level slopes per cell subset are red dots, whereas boxplot color denotes number of individuals exhibiting a positive individual slope. c, PCA of individuals’ cellular profiles using all cell-subsets’ frequencies. The single time points of an individual are colored by an individual’s age (in decades) at recruitment, with shape denoting CMV serology (pos., positive; neg., negative). Three representative trajectories are shown as bold lines connecting the single time points labeled by visit number and subject identifier and are colored by individual’s decade of age. d, Cell subsets (dots) are scattered by their significance of correlation with the main two principal components (y-axis, P values were calculated using linear regression followed by Fisher’s combination and BH correction, n = 18 individuals) and the difference between the Pearson correlation values of their individual-level slopes calculated either versus individuals’ baseline positions in the PCA space or versus age (x-axis). P value threshold of 0.05 is displayed by a horizontal dashed line.
To check whether this large interindividual variation was reflected in the global dynamics of immune profiles, we applied principal component analysis (PCA) using all cellular frequencies measured in the snapshot data set (Fig. 2c). The main two principal components (PC1 and PC2), which together captured 37% of the total variability, were highly correlated with the frequencies of many immune-senescence-associated cell subsets, such as CD28CD8+ T cells, naive CD4+CD8+ T cells, and memory B cells. Furthermore, these axes were significantly correlated with age and cytomegalovirus (CMV) infection, a known accelerator of immune aging (linear regression PPC1 = 1.75 × 10⁻⁸, 2.78 × 10⁻⁵; PPC2 = 7.47 × 10⁻⁹, 5.39 × 10⁻⁴, for age and CMV, respectively, n = 94), indicating that the two-dimensional PCA space reflects the overall immunosenescence levels. Notably, the variation between individuals was greater than that within an individual over time both with respect to position in the PCA space and to the majority of individual immune-cell subset levels (t-test P< 2.2 × 10⁻¹⁶ for immune profiles; Benjamini-Hochberg (BH)-adjusted t-test P < 0.05 for 82.19% of cell subsets; Methods and Extended Data Fig. 2a,b).
To study the dynamics of an individual’s immunosenescence levels, we calculated the trajectory’s length in the PCA two-dimensional space per individual (Methods). Young individuals exhibited shorter trajectories compared to older adults, indicating their relative longitudinal stability with respect to immunosenescence-related cell subsets (Extended Data Fig. 2c; t-test P = 0.03; Methods). We thus sought to leverage the pronounced dynamics of older adults’ immune profiles to study the factors governing the large inter-individual variability of the individual slopes of immune cell subsets. For this, for each cell subset we examined the correlation between the older adults’ individual-level slopes and either their age or their location in the two-dimensional PCA space (as a proxy for immunosenescence levels), where both values correspond to the subject’s baseline visit. Notably, baseline location of older adults in the PCA space dictated longitudinal dynamics more than age exclusively among cell subsets that were correlated with the main axes (Fig. 2d, Extended Data Fig. 2d and Methods; paired t-test P = 1.7 × 10⁻⁴ (n = 39), 0.085 (n = 34) for cell subsets correlated or not correlated with PCA axes, respectively). Taken together, baseline immunosenescence levels during the study dictated longitudinal dynamics more than age did, in a cell-subset-dependent manner.
Immune cells in older adults converge toward steady-state levels in a baseline-dependent manner to yield attractor points.
To extend these findings quantitatively, we turned to the large ongoing data set that includes longitudinal cell-subset profiling of 135 individuals (Supplementary Fig. 1–3 and Supplementary Tables 2 and 5). We observed a large year-to-year variation that spanned both age groups owing to technical issues inherent to the annual profiling (Extended Data Figs. 1d and 3a). Leveraging the insight from the snapshot data set regarding the longitudinal stability of the young adults’ immune profiles, we used the young adult cohort to adjust the ongoing data set, yielding greater correlation between the two data sets (Methods, Extended Data Fig. 3 and Supplementary Table 6).
We first identified by cross-sectional analysis 33 cell subsets that were consistently associated with age after adjustment to CMV covariate in the 9 years of the study (Fig. 3a and Methods; BH-adjusted combined P< 0.05; Supplementary Table 7). These included multiple cell subsets that have previously been linked to immunosenescence, such as CD8+ T-cell subsets lacking expression of CD28 and those expressing CD85j, CD57 or PD1, whose abundance increased with age, as well as naive CD8+ T cells, whose abundance decreased with age (Fig. 3a). Furthermore, we noted marked age-dependent changes in the frequencies of monocytes, NK cells, B cells and multiple CD4+ T-cell subsets29.
To characterize the longitudinal dynamics of cellular frequencies, we calculated for each of these cell subsets the difference in frequency between two consecutive years (annual change; Fig. 3b and Supplementary Table 8). Of the 33 cell subsets, 16 exhibited annual changes that were significantly and consistently different from zero with a direction that reliably matched the trend observed with age (Methods). This indicates that whereas some cell subsets continued changing during the study, other cell subsets were stable, and the detected age effect on their frequencies suggests that a major part of their dynamics occurred before participants’ entry into the study.
To understand what dictates cell subset dynamics, we used cell subsets that continued changing during the study and examined the correlation of their annual change with age (Fig. 3b,c, top). However, for all of these cell subsets, we did not detect any significant correlation between the two variables (Extended Data Fig. 4). Motivated by our previous finding regarding the effect of baseline immunosenescence levels on dynamics, we examined the correlation of the annual change in cellular frequencies with the corresponding baseline frequencies for each cell subset (Methods). We observed significant negative correlations between annual change and baseline frequencies for most cell subsets that were not restricted to extreme baseline values (Fig. 3b,c, bottom, and Supplementary Table 9). Thus, the rates at which immune-cell frequencies changed over time in older adults depended on the present frequency rather than on age.
Cell-subset dynamics dictate three stages describing an ordered convergence on a high-dimensional attractor point.
We sought to extrapolate from the baseline and annual-change model the dynamic behavior of cell subset frequency during the 9-year course of the study. The negative correlation between annual-change and baseline cellular frequencies suggests that individuals with high frequencies decreased their levels whereas those with low frequencies increased their levels. Between these lies an intermediate point around which the cell subset’s levels are stable and toward which these two extremes converge. We reasoned that for each cell subset that continued changing during the study in a baseline-dependent manner, one could glean the frequency toward which the cell subset converges, or the steady-state frequency the system ‘pushes’ the cell toward, that is, an older-adult attractor point (Fig. 4a).
Fig. 4 |. Immune cell dynamics in older adults yield a convergence on an attractor point.
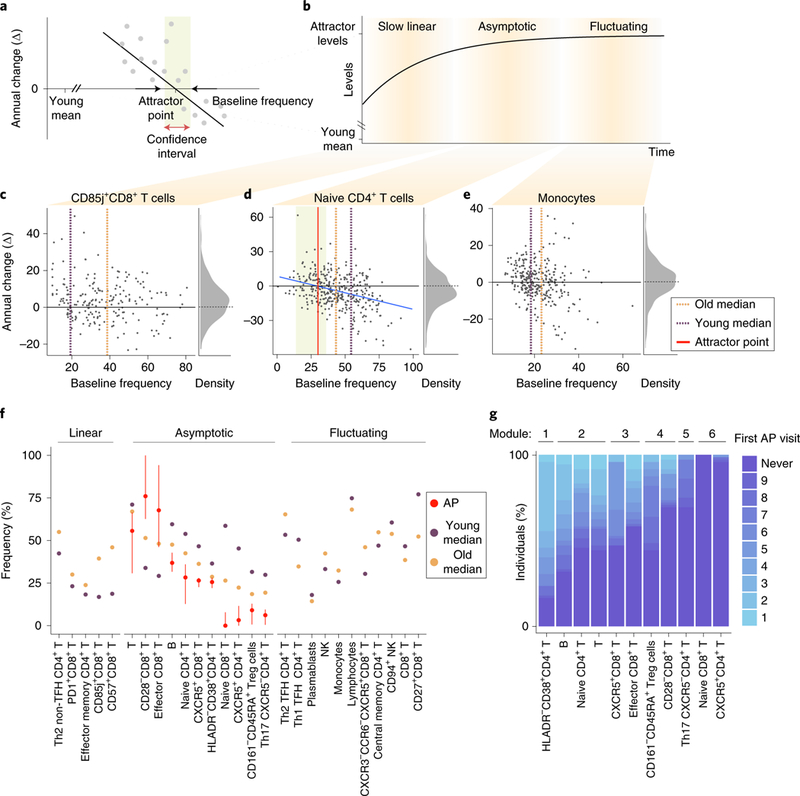
a, Some cell subsets exhibit baseline-dependent dynamics, enabling inference of an attractor point corresponding to the stable frequency on which the system converges, along with a corresponding confidence interval (shaded box). b, A generalized model of cell-subset dynamics in healthy aging enables classification of cell subsets into three classes that differ in their ordering of reaching the attractor points: slow linear, asymptotic and fluctuating. c-e, Annual change versus baseline scatter plots along with annual change versus density distribution plots of three representative cell subsets assigned to the different classes. CD85j+CD8+ T cells (Pannual change = 343 × 10−8) naive CD4+ T cells (Pannual change = 594× 10−5 Pliner model = 5.33 × 10⁻⁷) and monocytes (Pannual change = 0.14) were classified as slow linear, asymptotic and fluctuating, respectively. Dashed orange and purple lines correspond to median abundance in old and young adults, respectively, whereas red line and shaded box correspond to attractor point and the confidence interval, respectively. f, Cell-subset classification along with the median cellular frequencies measured in young (purple, n = 63 individuals) and older (orange, n = 72 individuals) adults. For the asymptotic cell subsets, attractor point and corresponding confidence interval are in red. g, Ordering of asymptotic cell-subset modules by the time at which they reached attractor-point levels. Color represents first visit in which the cell subset reached the attractor point within an individual. Cell-subset assignments into modules appear on top. AP, attractor point.
The 33 age-affected cell subsets were classified into three classes representing sequential stages of convergence toward their homeostatic levels based on both their longitudinal dynamics and whether we could locate their attractor points (Fig. 4b–e, Extended Data Fig. 5 and Supplementary Table 9). Notably, 11 cell subsets exhibited significant longitudinal dynamics that depended on the baseline, allowing us to derive the attractor point, corresponding to where the cell subset converged (Methods). We classified these cell subsets, including CD8+CD28− T cells, as ‘asymptotic,’ located their attractor points, and quantified confidence intervals and P values of their attractor-point locations (Fig. 4d,f, middle, Extended Data Fig. 6a, Supplementary Table 10 and Methods). Moreover, as a group, the dynamics of these cells better fit an asymptotic model than a linear one (P < 0.03, Methods). Conversely, five cell subsets including CD57+CD8+ T cells exhibited significant and baseline- independent longitudinal dynamics, barring the identification of an attractor point and suggesting slow linear dynamics (Fig. 4c,f, left, and Extended Data Fig. 6b). Accordingly, the dynamics of these cell subsets as a group did not fit an asymptotic model (P > 0.11, Methods). Last, for 11 cell subsets including NK cells, we did not detect significant longitudinal dynamics, despite the fact that their frequency was significantly affected by age. These cell subsets had already reached the attractor-point levels and continued ‘fluctuating’ around them during the course of the study (Fig. 4e,f, right, and Extended Data Fig. 6c). The remaining six cell subsets were excluded owing to a lack of confidence in our ability to classify them (Methods and Supplementary Table 9). Thus, our longitudinal measurements enabled inference of a global dynamic model in older adults through cell-subset classification and identification of the attractor-point levels toward which the cell subsets converge.
The fluctuating cell subsets indicate that cell subsets did not reach their attractor point simultaneously. Asymptotic cell subsets greatly varied in the age at which they reached their attractor point across individuals, whereas within individuals they reached their attractor point levels relatively concomitantly (Extended Data Fig. 7a,b, median interquartile range 14.75 and 2 years, respectively). This suggested that we could infer an ordering of cell-subset convergence based on the time when the subsets reached their attractor-point levels within an individual. To do this, we identified pairs of cell subsets whose internal ordering was conserved across individuals and used them to derive a global cascade comprising six modules of cell subsets that reached their attractor points sequentially (Fig. 4g and Methods). Notably, naive CD4+ T cells reached their attractor point levels much earlier than naive CD8+ T cells. Beyond this ordering, we calculated per individual the correlations between age-related cell-subset frequencies measured longitudinally and found many significant internal correlations (Extended Data Fig. 7c,d and Methods). These results suggest that immune cell subsets of older adults change together in a graded manner toward a high-dimensional attractor point, corresponding to a new homeostasis. We thus aimed to explore immune-system dynamics from a high-dimensional perspective to assemble a robust representation of the individual’s immune-system state that could not be achieved using single cell subsets.
Cellular profiles change along a trajectory reflecting an immune age.
Our longitudinal measurements are sensitive to the environment and cover only a fraction of an individual’s life span. We reasoned that by using the entire study population, we could infer the underlying structure describing immune-system dynamics throughout an individual’s adult life. To do this, we represented each individual’s immune profile in a given year as the frequencies of the cell subsets that changed longitudinally, and applied the diffusion-pseudotime algorithm30 (Methods). Individuals’ immune profiles formed a nonbranched trajectory, with young individuals’ immune profiles located at one end of its trajectory (Fig. 5a and Supplementary Table 11). We leveraged the trajectory’s linearity to assign the immune profiles pseudotime values corresponding to their relative location along it. The assigned pseudotime values of older adults were significantly dependent on age (linear regression P = 5.96 × 10⁻⁹, n = 294 immune profiles). Furthermore, the individual slopes of older adults along the trajectory were significantly positive, as opposed to those calculated for the young adults, indicating the younger adults’ stability compared to older adults (Fig. 5b and Extended Data Fig. 8a; t-test P = 0.36 and 6.92 × 10⁻¹⁹ for young (n = 17) and older adults (n = 55) having at least three pseudotime values, respectively).
Fig. 5 |. A linear trajectory explains dynamics of cellular frequencies in healthy aging.
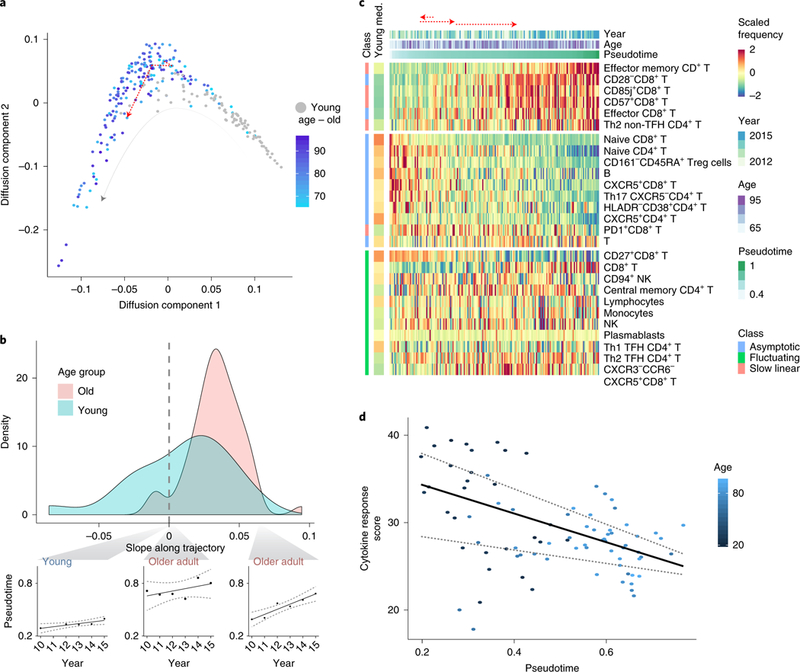
a, Diffusion-map dimensionality reduction of young (gray) and old (colored by age) individuals calculated using scaled cellular frequencies. Red dashed line denotes longitudinal immune profile of one old individual along the trajectory. b, Density plots of individual-longitudinal slopes along the trajectory calculated on young (light blue) and old (pink) individuals. Specific examples of longitudinal dynamics along the trajectory of one young individual (left) and two older adults are shown on bottom. c, Scaled frequencies of cell subsets classified as slow linear, asymptotic or fluctuating (left bar) along the pseudotime axis corresponding to the trajectory. Median values of scaled frequencies measured in young individuals are in left bar whereas longitudinal measurements of one older adult appear on top as dashed, red arrows. d, Cytokine response score of 2011 samples colored by age and median regression line versus pseudotime (quantile regression P= 0.028, 0.41 (n = 83 cytokine response scores) for pseudotime and age, respectively). Quantile regression lines of quantiles 0.25 and 0.75 are shown as dashed lines.
To characterize the molecular processes captured by the trajectory, we calculated the slope along the trajectory of the frequency of each cell subset classified as fluctuating, linear or asymptotic. Fluctuating cell subsets exhibited significantly smaller slopes along the trajectory compared to linear and asymptotic cell subsets (t-test P = 0.02, n = 11 and 16, respectively; Fig. 5c, Extended Data Fig. 8b and Supplementary Table 12). Furthermore, the correlations between cell subsets’ frequencies and the trajectory were high, and significantly greater than those calculated versus age (paired t-test P = 1.2 × 10⁻⁴ (n = 27 cell subsets); Extended Data Fig. 8b,c and Supplementary Table 12), highlighting the close association between the trajectory and immune status.
Intracellular signaling responses to cytokines are altered in older individuals compared to young31, as captured by an aggregated cytokine response score derived from 14 assays spanning the major immune lineages. Because a longitudinal analysis of these features was not applicable for technical reasons, we hypothesized that these longitudinal alterations could be captured cross-sectionally using the trajectory. We calculated the cytokine response score per sample and observed a significant negative correlation with the trajectory that was consistent across years and was more significant than the correlation with age (Fig. 5d, Extended Data Fig. 8d, Supplementary Fig. 4 and Methods; median-regression P=0.028 and 0.41 (n = 83 samples from 2011) for trajectory and age, respectively). By analyzing each cytokine response separately, we found five cytokine responses that significantly changed along the trajectory (Methods, BH-false discovery rate < 0.2, Extended Data Fig. 8e). The inferred trajectory describes immune-system dynamics in aging with functional consequences, suggesting that it is an immune-aging axis whose value for an individual at a given time point we now define as an IMM-AGE score.
IMM-AGE score predicts mortality in older adults better than epigenetic clock.
To assess some of the clinical implications of our immune-age metric, we examined the correlation of the baseline IMM-AGE score with longitudinal clinical information collected about the cohort (Supplementary Table 13). However, this analysis had poor statistical power owing to the plethora of clinical events experienced by the cohort, a problem that was even more pronounced even when we assessed the clinical predictive power of single cell subsets’ frequencies (Supplementary Note 1). Similarly, and despite prior observations relating to age31, we did not detect significant correlations between the IMM-AGE score and cardiovascular complications in this cohort, probably owing to small cohort size. This indicated that although the IMM-AGE metric was correlated with the cytokine-response score metric, it also captured additional aspects of the immune-aging process.
We thus hypothesized that an improved understanding of the relationship ofIMM-AGE with clinical data, specifically that related to cardiovascular disease, could be gleaned by analyzing a larger cohort. Despite the availability of multiple large cardiovascular studies, the scarcity of high-resolution immune profiling hinders direct assessment of the participants’ IMM-AGE scores. To overcome this barrier, we leveraged the multiple data types measured in the cohort to make associations between our cell-based IMM-AGE scores and gene expression measurements, the latter of which are made commonly. Specifically, we identified a candidate gene set whose expression was significantly and consistently correlated with both age and IMM-AGE score (Methods, Extended Data Fig. 9a and Supplementary Table 14). In accordance with cellular frequency dynamics along the trajectory, downregulated genes were predominantly expressed by naive CD8+ T cells, naive CD4+ T cells and B cells, whereas upregulated genes were predominantly expressed by cytotoxic NK cells and terminally differentiated effector memory CD8+ T cells (Methods, Extended Data Fig. 9b; binomial test P = 5.8 × 10⁻¹¹ (n = 35 genes), 3.7 × 10⁻⁹ (n = 29 genes), 7.9 × 10⁻⁹ (n = 33 genes), 1.52 × 10⁻⁵ (n = 17 genes) and 1.44 × 10⁻⁴ (n = 18 genes), respectively). Conversely, when we corrected the gene expression data for variation in cellular frequencies, we did not detect any gene whose expression changed significantly along the trajectory, indicating the close correspondence between the identified gene set and the cellular frequency-derived trajectory (Methods).
To test the association between IMM-AGE and cardiovascular disease, we used the Framingham Heart Study, which has rich clinical and cardiovascular information in addition to whole-blood gene-expression data for 2,292 participants aged 40–90 (Methods)32. Using a refined gene set of 57 genes whose expression changed along the trajectory, we assigned each participant an approximate IMM-AGE score33 (Extended Data Fig. 10a, Supplementary Table 14 and Methods). Similar to our observation in the original longitudinal data set, the IMM-AGE score was significantly correlated with age (linear regression P = 1.54 × 10−60, n = 2,292). Furthermore, after age adjustment, males exhibited significantly higher IMM-AGE scores as compared to females (linear regression P=7.22 × 10⁻²⁷, n = 2,292, Extended Data Fig. 10b). As both age and gender are associated with cardiovascular disease risk, we adjusted the IMM-AGE scores for these variables and identified a significant association between the adjusted values and cardiovascular state at baseline, such that individuals diagnosed with cardiovascular disease tended to exhibit accelerated immune aging (t-test P=2.34 × 10⁻³, n = 2,292; Extended Data Fig. 10c). Further adjustments of IMM-AGE score for other cardiovascular risk factors including total and high-density lipoprotein (HDL) cholesterol, diabetes, smoking and blood pressure, in addition to age and gender, had similar results (Extended Data Fig. 10d, t-test P=0.04, n = 2,292).
To further characterize the clinical predictive value of the IMM-AGE score, we calculated a multivariate Cox-regression model of all-cause mortality rates versus cardiovascular risk factors, the existence of cardiovascular disease and the IMM-AGE score at baseline Methods). We observed a significant association between baseline IMM-AGE score and overall survival during 7 years of follow up (P=4.2 × 10⁻⁴, n = 2,290, hazard ratio (HR) = 1.05 per 5-year increment). Moreover, stratification of individuals by their baseline IMM-AGE scores adjusted to these covariates showed a significant difference in overall survival between the groups (Fig. 6a, p = 0.018, n = 2,290, log-rank test).
Fig. 6 |. IMM-AGE score predicts all-cause mortality risk beyond well-established risk factors.
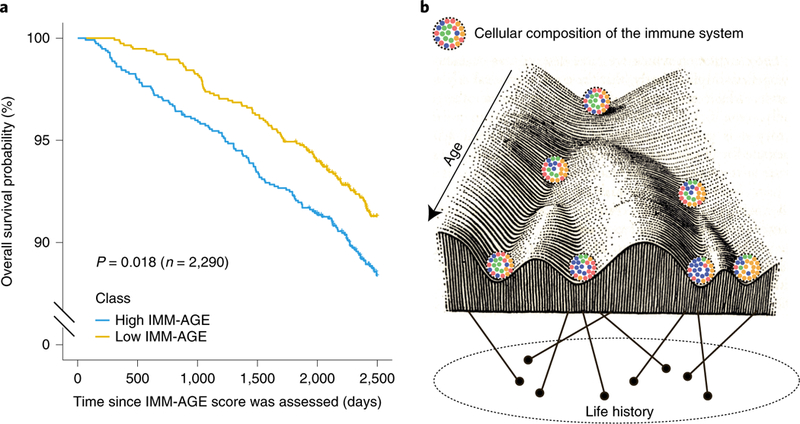
a, Kaplan-Meier overall survival curves for Framingham, Heart Study participants stratified based on median values of their IMM-AGE scores adjusted to cardiovascular risk factors and cardiovascular disease. Yellow and blue curves correspond to individuals with low and high IMM-AGE scores, respectively (P = 0.018, n = 2,290, two-sided log-rank test). b, Interaction between age and life history creates an immunological landscape dictating the composition of the cellular immune system.
Aging alters most physiological systems, potentially yielding a broad range of biological-age metrics. Of particular relevance is a DNA methylation-age metric that uses the effects of aging on DNA methylation to estimate a biological clock of aging34; this DNA methylation-age metric predicts all-cause mortality35. We sought to use methylation data from the Framingham participants to determine whether there is a link between the aging aspects captured by the two biological-age metrics (DNA methylation age and IMM-AGE). To do this, we calculated the DNA methylation age of the Framingham participants and observed a significant correlation between the DNA methylation age and the IMM-AGE score that did not depend on cardiovascular risk factors or cardiovascular disease (Methods, Extended Data Fig. 10e, linear regression P=9.71 × 10⁻⁸, n = 2,139). To compare the clinical utility of the two metrics while considering their inherent correlation, we calculated a multivariate Cox model regressing all-cause mortality against cardiovascular risk factors, cardiovascular disease status, and both biological age metrics at baseline. The resulting association of IMM-AGE with overall survival was >500-fold more significant than that obtained for DNA methylation age, highlighting the pivotal role of immune aging in survival (Methods, P = 8.3 × 10⁻⁵, 0.051; 5-year increment HR = 1.05 and 1.11 for IMM-AGE and DNA methylation age, respectively, n = 2,159).
Discussion
Most studies focused on the aging of the immune system are crosssectional and thus cannot identify longitudinal trends. Here we analyzed multiple immune-omics data in a longitudinal manner for the first time, leveraging natural immune heterogeneity at baseline to explore immune-aging dynamics at high resolution.
We characterized pronounced immune-system dynamics in older adults that contrasted with the immune-system stability of young adults. These dynamical properties may account for the previously noted difference in baseline immune heterogeneity between the groups17. We observed that immune-cell frequencies changed at substantially different rates; some cell subsets show no directionality of change yet differ between young and old individuals, suggesting that their change in abundance occurs at early ages before the age of 60 at which older adults entered the study, whereas other cell subsets continued changing (either increasing or decreasing) throughout the course of the study. For the latter group, we identified attractor points, a stable steady-state frequency toward which a cell subset converges with age. This suggests that the homeostasis of young and older adults differs, and that by tracking a diverse group of individuals over time one can characterize the stable high-dimensional point toward which the immune system gradually and asymptotically converges—that is, older adults’ homeostasis.
Notably, the relative longitudinal stability of the immune system within individuals as compared to interindividual heterogeneity yielded the traditional concept of a personalized equilibrium resulting in a diverse set of stable immune states6. Our study’s longitudinal design enabled systematic characterization of the fine-resolution immune-system dynamics occurring within an individual, revealing a relatively conserved homeostatic state that may differ slightly between individuals as a function of intrinsic and environmental factors.
We relied on population-level, longitudinal information of cellular frequencies over short time spans to describe a trajectory approximating a continuum of changes in cell composition that occur over an older adult’s lifetime. This trajectory captures the individual’s immune-aging process, which we quantified using the IMM-AGE score. The IMM-AGE score is correlated with age, yet it captures additional metrics such as cell-cytokine response better than age. We identified a gene signature approximating IMMAGE, obviating the need for high-dimensional cytometry data, and used it with data from the Framingham Heart Study to show that IMM-AGE score predicts all-cause mortality, thereby exhibiting a clinically meaningful biological clock. This opens the door to other large-scale prospective studies that would be needed to validate the IMM-AGE score, expand its definition to include more cell subsets, and find other clinical settings in which it may inform treatment or outcome.
An individual’s positioning on the trajectory better explained the variability between individuals in cellular cytokine responses than age, suggesting that immune age is the primary driver of observed immune variation in older adults. Thus, accounting for IMM-AGE score in study designs should allow for better detection of condition-driven signals. Moreover, a condition may interact with the immune system such that it should be studied in a specific immune-age context. Notably, the fluctuating cell subsets we identified indicate that immune aging begins by midadulthood (ages 40–60), and the lack of this age range in our cohort hindered direct characterization of cellular dynamics during the immune-aging initiation period. We expect that longitudinal data including this age group may provide clues for the prevention of early immune aging.
One may postulate that an individual’s immune age is a function of life history, namely environmental exposure coupled with genetic background. Similar to the epigenetic landscape model proposed by Waddington to describe cellular changes over developmental time36, one can describe the cellular composition of the immune system as traversing an immunological landscape (Fig. 6b). The trajectory we observed may be one path through this landscape corresponding to the immunosenescence process observed in aging, with interindividual variability in the rate of progression along it toward a minimum in the landscape representing older adults’ homeostasis. Our ability to position all individuals along one continuum reflects the global temporal homogeneity of the participants’ immune profiles that existed despite variability in immune-related phenotypic features such as CMV infection. However, we cannot exclude the possibility that additional trajectories and homeostatic states exist. Populations with exceptional longevity may exhibit slower advancement rates along the trajectory, whereas environmental factors such as geographical locations and chronic infections such as human immunodeficiency virus may shift the immune system toward a different path on the landscape37. Thus, it would be of interest to leverage the heterogeneity of additional populations to widen the range of immune states represented by the trajectory, potentially affecting its shape and branching properties. Our results show that one’s position in the immunological landscape has clinical implications for overall survival. For clinical events affecting the immune system, this would generate a feedback, with the occurrence of the event affecting the position of the immune system on the landscape itself.
Given the association between the immune system and survival, we expect that IMM-AGE can provide important information about immune system capacity. Recently, immunotherapy treatments in cardiovascular disease have yielded positive results, yet discovery of an immune-based biomarker to identify patients that would most benefit from immune modulation is needed38. Just as developmental reprogramming revolutionized the ability to modulate the paths a cell takes on Waddington’s epigenetic landscape, immune modulators may one day be identified that affect the position of an individual’s immune system along the immunological landscape.
Methods
Experimental Procedures.
Sample collection.
Peripheral blood samples were obtained at the Stanford Clinical and Translational Research Unit from a 9-year cohort that came into the clinic roughly three times per year as part of an influenza vaccine study; individuals were requested to return for annual visits after their year of enrollment, beginning in 2007 (Supplementary Table 1 and Extended Data Fig. 1a–c for demographics). All volunteers were assessed as generally healthy at the time of initial enrollment based on evaluation of their medical history and assessment of their vital signs. Exclusion criteria at the time of enrollment included an active systemic or serious concurrent illness; a history of immunodeficiency; any known or suspected impairment of immunologic function; diabetes mellitus treated with insulin; moderate to severe renal disease; blood pressure greater than 150/95 at screening; chronic hepatitis B or C; recent or current use of immunosuppressive medication; malignancy other than squamous cell or basal cell skin cancer, including solid tumors such as breast cancer or prostate cancer with recurrence in the past year, and any hematologic cancer such as leukemia, which might jeopardize volunteer safety or compliance with the protocol; autoimmune disease; history of blood dyscrasias or hemoglobinopathies requiring regular medical follow up or hospitalization during the preceding year; use of any anticoagulation medication; a medical or psychiatric condition or occupational responsibilities that would preclude subject compliance with the protocol; history of Guillain-Barre syndrome; pregnancy; membership in the clinical study team; and any condition that might interfere with volunteer safety, study objectives or the ability of the participant to understand or comply with the study protocol. Development of these conditions at visits after enrollment did not exclude continuing participation in the study, unless, in the opinion of the investigator, the condition interfered with the volunteer’s safety, study objectives or the ability of the participant to understand or comply with the study protocol. In total, 65 ml whole blood was drawn per individual and processed by standard procedures into peripheral blood mononuclear cells (PBMCs) and serum. The samples were processed in the Stanford Human Immune Monitoring Center in a standardized manner with multiple deep phenotyping modalities profiled. The longitudinal analysis we conducted established an approach orthogonal to previous studies that analyzed subsets of these data from a cross-sectional perspective11,27,31,39–41 (Extended Data Fig. 1e).
Determination of CMV seropositivity.
Determination of CMV seropositivity was conducted by ELISA using the CMV immunoglobulin G (IgG) ELISAkit (Calbiotech, CM027G). Serum samples were thawed at room temperature, and dilutions were prepared according to the manufacturer’s recommendations. Calculation of results was done on the basis of the controls provided by the vendor. For consistency, CMV status per individual was assessed using the most commonly observed CMV status among all longitudinal measurements.
Cell-subset phenotyping.
Cells were thawed and washed twice with warm culture medium followed by staining and profiling, which were performed using flow cytometry technology in years 2007–2009 and CyTOF (mass cytometry) technology in years 2010–2015 and for the snapshot data set (Extended Data Fig. 1d). For cellular phenotyping by flow cytometry, cells were stained for 30 min at 4 °C with a cocktail of antibodies (Supplementary Table 2), followed by a wash and resuspension in FACS buffer (PBS supplemented with 2% FBS and 0.1% sodium azide). Data were collected using DIVA software in an LRSII instrument (BD Biosciences), and data analysis was performed using FlowJo 8.8.6 by gating as described in Supplementary Figs. 2 and 3. For cellular phenotyping by CyTOF, 1 million live cells were resuspended in CyFACS buffer (PBS with 0.1% BSA, 2 mM EDTA and 0.05% sodium azide) and stained for 60 min with a cocktail of antibodies in 100 μl on ice (Supplementary Table 2). Cells were then washed twice and stained with live-dead maleimide-DOTA stain (5 mg ml−1 maleimide-DOTA loaded with 139-lanthanum or 115-indium) for 30 min in 100 μl on ice, followed by fixation using paraformaldeyde (2%) in 100 μl overnight. Cells were washed twice and permeabilized in saponin permeabilization buffer for 45 min on ice, washed twice with CyFACS buffer and incubated with Ir-intercalator (Fluidigm, 1:2,000 dilution) for 20 min. Cells were then washed with CyFACS and washed twice with milli-Q water. Samples were acquired by CyTOF machine (either CyTOF1 in years 2010–2013 and snapshot data set, or Helios in years 2014–2015). Data were analyzed using FlowJo software by gating as described in Supplementary Fig. 1.
Cytokine-response assays.
PBMCs were thawed in warm medium, washed twice and resuspended at 0.5 × 10⁶ viable cells per ml. Cells (200 μl) were plated per well in 96-well deep-well plates. After resting for 1 h at 37 °C, cells were stimulated by addition of 50 μl of cytokine (interferon-α (IFN-α), IFN-γ, interleukin-6 (IL-6), IL-7, IL-10, IL-2 or IL-21) and incubated at 37 °C for 15 min. The PBMCs were then fixed with paraformaldeyde, permeabilized with methanol and kept at −80 °C overnight. Each well was bar coded using a combination of Pacific Orange and Alexa-750 dyes (Invitrogen) and pooled in tubes. The cells were washed with FACS buffer (PBS supplemented with 2% FBS and 0.1% sodium azide) and stained with the following antibodies (all from BD Biosciences): CD3 Pacific Blue, CD4 PerCP-Cy5.5, CD20 PerCp-Cy5.5, CD33 PE-Cy7, CD45RA Qdot 605, pSTAT-1 AlexaFluor488, pSTAT-3 AlexaFluor647 and pSTAT-5 PE (Supplementary Table 2). The samples were then washed and resuspended in FACS buffer. Some 100,000 cells per stimulation condition were collected using DIVA 6.0 software on an LSRII flow cytometer (BD Biosciences). Data analysis was performed using FlowJo v9.3 by gating as described in Supplementary Fig. 4 (details regarding the gating scheme and fold-change calculation are in Shen-Orr et al.31). Normalization of data acquired in 2008 is detailed in Shen-Orr et al.31, whereas for data acquired in 2009–2012, we normalized the fold-change values through division by fold change measured on control samples that ran on the same plate.
Gene expression profiling.
RNA was extracted from the PAXgene RNA blood tubes (PreAnalytiX; VWR, 77776–026) using the QIAcube automation RNA extraction procedure according to the manufacturer’s protocol (Qiagen). The amount of total RNA, and A260/A280 and A260/A230 nm ratios were assessed using the NanoDrop 1000 (Thermo Fisher Scientific). RNA integrity was assessed using the Agilent 2100 Bioanalyzer (Agilent Technologies). In each sample the RNA integrity number was measured. For each sample, 100 ng of total RNA were used for first-strand cDNA synthesis by using T7 oligo(dT) primer at 42 °C for 2 h, and then for at least 2 min at 4 °C. Single-stranded cDNA was converted to double-stranded cDNA for 1 h at 16 °C, then for 10 min at 65 °C, and then for at least 2 min at 4 °C. Labeled complementary RNA (cRNA) was synthesized and amplified by in vitro transcription of the second-stranded cDNA template using T7 RNA polymerase. Purified cRNA was fragmented by divalent cations and elevated temperature. Some 11 μg of labeled and fragmented cRNA was hybridized onto the PrimeView GeneChip, washed, scanned and extracted according to the user guides GeneChip Fluidics Station 450 User Guide AGCC (P/N 08–0295), GeneChip Expression Wash, Stain and Scan User Guide for Cartridge Arrays (PN 702731), and GeneChip Command Console User Guide (P/N 702569). Briefly, the fragmented and labeled targets were hybridized to the arrays according to the standard Affymetrix protocol, which includes 16-h hybridization at 45 °C at 60 r.p.m. in the Affymetrix GeneChip Hybridization Oven 645. The arrays were then washed and stained in the Affymetrix GeneChip Fluidics Station 450. The arrays were scanned using the Affymetrix GeneChip Scanner 3000 7G. After checking the quality of each individual array, we imported the feature extraction files into R Bioconductor and analyzed them using the microarray package for probe filtering, quantile normalization, replicate probe summarization and log2 transformation.
Computational analysis.
Snapshot data set analysis.
Detecting longitudinally changing cell subsets.
We constructed longitudinal models of the cell-subset frequencies both at the group and the individual level. Group level slopes were calculated using mixed linear models of the cellular frequencies versus age, taking the intercept of each individual as a random effect (LME4 R package). Individual level slopes were computed separately for each individual via median linear regression (quantreg R package) of the cellular frequencies versus year. To check the global longitudinal dynamics of immune cell subsets, we applied PCA (FactoMineR R package) using cellular frequencies of all the cell types measured in the snapshot data set. Comparative analysis of inter- to intraindividual variation was applied using three methodologies: (1) with respect to location in two-dimensional PCA space, inter- and intraindividual Euclidean distances were compared; (2) with respect to individual cell subsets, the intraindividual coefficient of variation values calculated for each individual across years was compared to the interindividual coefficient of variation values calculated for each year across individuals (Extended Data Fig. 2a); (3) with respect to the variance-explaining factors of each cell subset, the proportion of variance explained for each cell subset was quantified by regression of each cell subset frequency versus age, CMV and subject identity, followed by extraction of an ANOVA table and decomposition of the total sum of squares into interindividual variation (sum of squares attributed to subject ID) and intraindividual variation (residual sum of squares, Extended Data Fig. 2b). For longitudinal stability analysis, the lengths of within-individual trajectories were calculated as the sum of distances between sequential years in the PCA two-dimensional space. For individual-level slope association analysis, to avoid bias introduced by repeated measures for each cell subset, median values of intraindividual frequencies were regressed versus the older adults’ median positions along the two main PCA axes. The resulting P values corresponding to both principal components were combined by Fisher’s methodology and corrected for multiple hypotheses by BH methodology to obtain the correlation significance of the cell subsets with the main PCA axes. Correlations of individual-level slopes with the two main PCA axes were combined by taking the maximal absolute correlation obtained for each PCA axis.
Correction of year-to-year technical variation of cellular frequencies data of the ongoing data set.
To account for technical differences between the years profiled in the ongoing data set, we leveraged our finding regarding the longitudinal stability of young adults’ immune profiles. Specifically, we treated the young individuals measured in two consecutive years as controls and adjusted the levels of each cell subset linearly to minimize the mean annual difference between the cell subset’s frequencies as measured in the control individuals. Starting with 2014 and heading backward, the data from each year were adjusted based on the next year.
Identification of cell subsets whose frequency changed with age with cross-sectional analysis of the ongoing data set.
The adjusted ongoing data set includes cellular frequency data measured in the years 2007–2015. For each cell subset, we generated a linear regression model by examining the correlation of its frequency versus age and CMV separately for each year in which the cell subset was measured. We combined the resulting age- and CMV-associated P values using a modified generalized Fisher method for combining P values obtained from dependent tests42 (CombinePValue R package) and adjusted the resulting combined P values to multiple hypotheses using the BH method. This led to 33 and 22 cell subsets with BH-adjusted combined age-related and CMV-related P < 0.05, respectively (Supplementary Table 7). To estimate the age-related effect size on cellular frequencies, we used the average cross-sectional ratio between older and young adults after filtering out years in which the measured ratio was opposite in direction to that of most of the analyzed years.
Cell subset classification based on longitudinal dynamics and attractor point determination.
Cell subset classification.
We classified cell subsets based on two criteria: (1) existence of longitudinal dynamics and (2) significant correlation between annual change and baseline frequencies. Specifically, in criterion 1, we checked whether the annual changes in the cell subset’s frequency were significantly different from 0 (P < 0.05, two tailed t-test). In criterion 2 we checked whether there was a significant correlation between annual change of cell subset’s frequency and its baseline frequency using a median linear regression model (quantreg R package, P < 0.05 calculated by a bootstrapping test). Cell subsets that did not fulfill criterion 1 were classified as fluctuating; cell subsets that fulfilled only criterion 1 were classified as slow linear; cell subsets that fulfilled both criteria were classified as asymptotic. To avoid the effect of technical noise on cellular classification, for each cell subset we excluded yearly intervals with mean direction of annual changes that contradicted the trend observed between age groups. We then excluded cell subsets with less than two remaining yearly intervals and those exhibiting mean annual change greater than the mean cross-sectional difference between age groups, which may indicate a high impact of technical noise. After following these filtering steps, we excluded 6 cell subsets of the 33 age-dependent cell subsets. This classification strategy is detailed in Extended Data Fig. 5, and final classifications of each cell subset of the 33 cell subsets exhibiting age association are in Supplementary Table 9. For attractor-point determination, the attractor point per asymptotic cell subset was defined as the intersection of the linear annual-change baseline model with the baseline axis. Confidence intervals for each attractor point were estimated via bootstrapping (boot R package).
Significance assessment of the attractor point location.
Cell subsets classified as asymptotic (that is, exhibiting annual change both significantly different from 0 and significantly dependent on baseline frequencies) were subjected to a set of three tests assessing the significance of their behavior. In these tests we repeatedly generated random regression lines corresponding to the null expected relationship between annual change and baseline frequency and tested the odds of observing the real-data result. As we expected null regression of cell subset frequencies toward the mean, our use of the null models and the significance measure we provide relate only to the derived location of the attractor point, that is, the intersection with the baseline axis. Below we detail the three different methodologies we applied to determine the significance of the attractor point location; the relevant P values are reported on a per-cell basis in Supplementary Table 10. Summarizing the results obtained for the three different methodologies, 9 cell subsets (of 11 cell subsets classified as asymptotic) exhibited attractor point locations that were significantly different from random under all the tests (P < 0.05). For permutations, we permuted the frequencies of each cell subset per individual with respect to time 100 times. For each permutation and for each cell subset, we calculated the annual change values and regressed them versus the baseline frequencies, yielding 100 null models per cell subset. For each model, we calculated the location of the attractor point as the intersection with the baseline axis to produce a null distribution of 100 attractor points for each cell subset. We then related the real attractor point obtained using the real longitudinal data to this null distribution, defining a P value. For instance, in a case where the real attractor point was located at the extreme 1% of the null distribution, a P value of 0.01 was calculated. This analysis led to 11 cell subsets (of 11 asymptotic cell subsets) with P < 0.05. For random sampling of cellular frequencies, we applied a model that simulated the cellular frequencies of different individuals based on their statistical characteristics observed in the real data. Specifically, in this test, we assumed that the cellular frequencies of each cell subset in each individual were sampled from a normal distribution with cell-subset- and individual-specific mean and s.d.; both were calculated from the data by standard estimators. For each cell subset, we simulated a typical longitudinal set of frequencies per individual by sampling values from these individual-specific distributions and regressed the obtained values of annual change versus the baseline values. This analysis was repeated 100 times per cell subset to achieve 100 null models. For each null model, we calculated the attractor point as the intersection of the null model with the baseline axis to yield a null distribution of 100 attractor points per cell subset. P values were then obtained by relating the real attractor point to this distribution, as in our approach to permutations. This analysis led to 10 cell subsets (of 11 asymptotic cell subsets) with P < 0.05. For random sampling of cellular frequencies with a longitudinal trend, to achieve a model better reflecting the longitudinal trends observed in the data, we further modified the model described for random sampling of cellular frequencies. To do this, after sampling the cell subset frequencies per individual from a normal distribution, we sorted the resulting sampled frequencies so that they matched the cross-sectional trend we observed (for instance, cell types whose abundance increase with age were sorted to preserve an increasing trend). Then we applied the same analysis as described for random sampling of cellular frequencies. This analysis led to 9 cell subsets (of 11 asymptotic cell subsets) with P < 0.05.
Retrospective group-level assessments of cell-subset classification.
Below we specify two additional analyses to test different dynamic properties that we expected would distinguish asymptotic from linear dynamics on a per-cell basis. The obtained results were then compared between the groups of cell subsets classified as asymptotic and linear to assess the significance of the classification at the group level. We first determined the decreasing trend of the absolute annual change. We expected the abundance levels of asymptotic cell subsets, in contrast with linear subsets, to stabilize with time as they approached the attractor-point levels. To quantify this, for each cell subset classified as either asymptotic or linear, we regressed the absolute annual-change values versus the visit number to obtain a slope corresponding to the mean magnitude of annual change differences along the study time course. The slopes of cell subsets classified as asymptotic were significantly negative (P = 0.03, t-test, n = 11), whereas those cell subsets classified as linear were not significantly different from 0 (P = 0.4, t-test, n = 5). Next, we examined the correlation between cell subset abundance measured in subsequent years. Asymptotic behavior can be modeled using the following equation: The solution of this equation is: suggesting that Linear behavior can be modeled using the equation The solution of this equation is: implying that: Thus, whereas both dynamic patterns support a linear relationship between cellular frequencies measured in two subsequent years, the corresponding slopes differ such that cell subsets that change linearly exhibit a slope of 1 whereas cell subsets that change asymptotically exhibit slopes of <1. To check this in our data, for each cell subset classified as either asymptotic or linear, we regressed the cellular frequencies measured in two subsequent years and calculated the resulting slopes. We observed that the cell subsets we classified as slow linear exhibited slopes not significantly different from 1, whereas cell subsets classified as asymptotic exhibited slopes significantly <1 (t-test P = 0.11 (n = 5) and 2.78 × 10⁻⁵ (n = 11) for linear and asymptotic cell subsets, respectively).
Cell subset order analysis.
To estimate the cascade in which the 11 asymptotic cell subsets reached their attractor points, for each individual and for each asymptotic cell subset, we identified the first year in which the cell subset reached its steady-state levels. Then, for each pair of cell subsets, we applied a binomial test to identify pairs of cell subsets that consistently and significantly (P < 0.05) exhibited a certain ordering within individuals. For global cell-subset ordering, we applied a modified version of the topological sort algorithm to derive modules of cell subsets whose ordering was conserved across individuals yet did not have identified internal ordering.
Longitudinal correlation between cell subsets.
We calculated the Spearman correlation between each pair of cell subsets within each individual across different years and averaged the resulting correlations across individuals. The significance of correlations was assessed by applying 100 permutations of the frequency values for each cell subset within an individual followed by recalculation of the pairwise correlations.
Trajectory assembly.
Scaling of cellular frequencies.
To normalize the effect of the cell subset-specific dynamic range of cellular frequency on trajectory building, we normalized abundance levels before trajectory assembly. Per cell subset, we first calculated the mean and s.d. of frequency values between the 10th and 90th percentiles. We used these values to normalize cellular differ frequencies by subtraction of the mean and division by s.d. For cell-subset selection, we used cell subsets with a significant nonzero annual change (criterion 1) whose frequencies did not across years owing to technical variation. To identify these subsets, we applied PCA on the scaled frequencies of the 21 cell subsets whose abundance changed longitudinally during the course of the study and that were measured in 2012–2015; these years included the full panel of cell types. This analysis revealed a clear separation of years 2014–2015 from 2012–2013, specifically in the second principal component. Hence, we excluded cell subsets whose absolute correlation with the second principal component was >0.6, resulting in 18 cell subsets. Specifically, the cell subsets used for trajectory building were B cells, CD161-CD45RA+ regulatory T cells, CD161+ NK cells, CD28−CD8+ T cells, CD57+CD8+ T cells, CD57+ NK cells, effector CD8+ T cells, effector memory CD4+ T cells, effector memory CD8+ T cells, HLADR-CD38+CD4+ T cells, naive CD4+ T cells, naive CD8+ T cells, PD1+CD8+ T cells, T cells, CXCR5+CD4+ T cells, CXCR5+CD8+ T cells, Th17 CXCR5- cells and regulatory T cells. For trajectory assembly, we applied the diffusion maps algorithm (destiny R package) on the scaled cellular frequencies of the selected cell subsets that were measured in 2012–2015; these years included the full panel of cells measured by CyTOF. The resulting diffusion pseudotime values were scaled to a range of 0–1. We then mapped samples measured by CyTOF in the remaining years (2010–2011) onto the trajectory using k-nearest neighbor algorithm with k = 10 using the trajectory-building cell subsets that were also measured in the mapped year. Next we determined cellular frequency profiles along the trajectory. For the identified cell subsets that were classified as fluctuating, asymptotic or slow linear, we calculated the slope of their frequencies along the older adults’ trajectory using linear regression per cell subset.
Dynamics of cellular response to cytokines along the trajectory.
Identification of phoshpo-flow cytokine responses that changed significantly with age.
We first excluded four samples (three samples from 2011 and one sample from 2012) that were identified as outliers by hierarchical clustering applied on all the samples per year using all phospho-flow cytometry features. To identify phospho-flow cytokine responses that changed significantly with age, we first calculated, per year (20082013) and for each phospho-flow cytokine response, the dependency of response levels with age by linear regression. We then excluded from further analysis the phospho-flow data collected in 2010 and 2013, because <20% of the measured responses were significantly dependent on age in those years, as opposed to >35% in the other years. Per cytokine response and for the remaining years, we combined the P values calculated per year (for 2008, 2009, 2011 and 2012) using a modified generalized Fisher method for combining P values obtained from dependent tests42 (CombinePValue R package). This resulted in 87 phospho-flow cytokine responses that changed significantly with age (BH-adjusted P < 0.05). From this group, we extracted only cytokine responses that changed significantly with age in at least two years, and for which we could derive a consistent trend (more than half of the years in which a significant trend was reported exhibited similar trends). This filtering step resulted in 40 phospho-flow cytokine responses that changed significantly and consistently with age. Based on a previous publication31, cytokine response score was calculated as the sum of the following individual phospho-flow cytokine responses: CD8+-pSTAT1-IFN-α, CD8+-pSTAT3-IFN-α, CD8+-pSTAT5-IFN-α, CD8+-pSTAT1-IL-6, CD8+-pSTAT3-IL-6, CD8+-pSTAT1-IFN-γ, CD8+-pSTAT1-IL-21, CD4+-pSTAT5-IFN-a, B cells-pSTAT5-IL-6, B cells-pSTAT1-IFN-a, monocytes-pSTAT3-IL-10, monocytes-pSTAT3-IFN-Y, monocytes-pSTAT3-IFN-a and monocytes-pSTAT3-IL6. We then identified individual phospho-flow cytokine responses that changed significantly along the trajectory. Levels of each phospho-flow cytokine response identified to be associated with age were correlated with the trajectory consisting of samples of older adults using linear regression per year (2011 and 2012). Per phospho-flow cytokine response, we excluded years in which there was a significant difference along the trajectory that contradicted the young- old trend. Then P values per cytokine response were combined across the relevant years using Fisher’s method and were adjusted for multiple hypotheses using BH method, resulting in five responses with BH-false discovery rate <20%.
Cardiovascular assessment.
Echocardiography data were obtained and processed as described in Shen-Orr et al31.
Gene expression analysis.
Preprocessing.
For gene expression analysis we used gene expression measurements collected on individuals during 2010–2015, since these were the only years used for trajectory building. Expression values across all years were first quantile normalized to allow comparative analysis across all years. We then excluded four gene expression samples (three samples from 2011 and one sample from 2014) identified as outliers by hierarchical clustering applied on all the gene expression samples per year. To identify differentially expressed genes across age groups, per year and for each gene, we calculated a linear regression model describing the dependence of expression levels on age. To combine P values obtained per gene across years, we used a modified generalized Fisher method for combining P values obtained from dependent tests42 (CombinePValue R package). We identified 4,605 genes whose expression levels significantly depended on age (BH-corrected combined P < 0.05). Next, we identified only genes that exhibited an age-dependent trend across the years as those genes for which a significant (P < 0.1) contradicting trend was reported in less than one of three years, resulting in 4,081 genes. To identify genes whose expression changed along the trajectory, for each of these 4,081 genes and per year, we derived a linear regression model describing the dependence of expression levels on the trajectory using only old adults’ samples. We then combined the P values calculated across the years by Fisher’s method, excluding years in which a significant trend (P < 0.05) along the trajectory was identified that contradicted the one observed across age groups. In this way, we identified 337 genes differentially expressed along the trajectory as those with BH-adjusted combined P < 0.05. To gain a robust genomic signature corresponding to the location along the trajectory, we used only genes whose expression changed significantly (P < 0.05) in >0.6 of the years where they were measured and whose trend in expression along trajectory did not significantly contradict the young-old trend, resulting in 121 genes.
Normal expression levels of the trajectory-related gene signature in immune cell subsets.
Normalized expression data were downloaded from Gene Expression Omnibus (GEO) (GSE24759). Because our trajectory-correlated genomic signature was identified using gene expression data of peripheral blood cells predominantly consisting of mature cells, we excluded gene expression data of sorted immature progenitor cell types from further analysis. After this filtration step, the expression matrix included 93 samples corresponding to 17 sorted peripheral blood cell subsets. Of the 121 genes identified as significantly and consistently changing along the trajectory, 79 genes were represented in the DMAP data set43. Probes were converted to the respective gene symbol by choosing per gene the probe with maximal expression levels across samples. We first calculated the mean expression of each gene by each cell subset and used this to identify per gene the three cell subsets exhibiting the highest expression levels. Then, per cell subset, we calculated the difference between the number of trajectory-upregulated genes and trajectory- downregulated genes expressed by the cell subset.
Gene-expression adjustment for variation in cell-type proportions.
Gene expression data were adjusted for variations in selected cell-type proportions (neutrophils, CD8+ T cells, B cells, CD85j+CD8+ T cells, naive CD4+ T cells and effector memory CD8+ T cells) by removing their effect on gene expression values from each gene expression profile within each year separately. Because the cell-proportion profiling data were generated on PBMC samples whereas the gene expression data were derived from whole-blood samples, we first ‘aligned’ them by transforming each cell type’s percentage PBMC frequencies (PPBMC) into percentage whole blood frequencies (PWB) using lymphocyte and monocyte proportions measured by complete blood count when available (in years 2010–2013): PWB = PPBMC• (CBClymphocytes + CBCmonocytes). For study years where complete blood count data were not available (2014 and 2015), we estimated neutrophil proportions directly from the whole-blood gene expression data using ImmunoStates-based immune signatures and computed the PBMC compartment proportions as 1—Pneutrophil. Whole-blood cell-type proportions were then standardized (centered, unit variance) and a multivariate linear model including the proportions as covariates was fitted on the non-log-scale expression profiles of each gene separately. The adjusted gene expression profiles were then defined as the sum of the fitted intercept coefficient and the residuals.
Framingham Heart Study data analysis.
Institutional Review Board (IRB) approval to analyze the Framingham Heart Study data was obtained from the Bnai Zion ethics board (IRB number BNZ-0029–15).
Gene expression preprocessing.
Normalized gene expression data generated using the platform Affymetrix Human Exon 1.0 ST were downloaded from the database of Genotypes and Phenotypes (dbGap; study identifier phs000007) and include the individuals from the Offspring and Generation 3 cohorts who attended the eighth and second clinical exams, respectively, and who signed either HMB-IRB- MDS or HMB-IRB-NPU-MDS research consent forms (n = 2,418 and 3,133 for Offspring and Generation 3, respectively). These gene expression data were first corrected for the different batches using Combat algorithm (sva R package) while avoiding adjustment of age- and gender-induced effects, followed by conversion of the probes into gene symbols by choosing per gene the probe that yielded maximal expression levels across 20 randomly chosen samples.
IMM-AGE approximation.
Of the 121 genes that were identified as consistently and significantly changing along the trajectory (Supplementary Table 14), 103 genes were also present in the Framingham gene expression data set. To reduce the technical noise stemming from changing the gene expression data set, which may influence intergene correlation relationships, we refined this gene set and chose only 57 genes that were highly correlated with the main PCA axis (absolute Pearson correlation > 0.4), an axis that significantly and consistently reflected the calculated IMM-AGE scores in our cohort across years (data not shown). We quantified the enrichment of this gene set in each participant of the Framingham study using single-sample gene-set enrichment projection33 and used the resulting enrichment scores as an approximation of the IMM-AGE scores of the Framingham participants. To improve the correspondence between the IMMAGE score and chronological age, we applied linear scaling on the IMM-AGE scores based on a linear regression of the IMM-AGE scores versus chronological age using individuals from the Offspring cohort, a cohort with a relatively homogeneous range of ages resembling the one observed in our cohort. A linear model of the resulting scaled IMM-AGE scores versus chronological age had slope and intercept of 1 and 0, respectively.
Clinical association analysis.
Here we used only individuals from the Offspring as they were older than individuals from the Generation 3 cohort at the date of gene expression profiling (66.8 ± 9.2 versus 45.5 ± 8.7 years old), and thus had a substantially higher prevalence of cardiovascular disease and mortality. Relevant phenotypic data sets were downloaded from dbGaP including gender and age at exam 8 (pht003099); smoking status, blood pressure and blood pressure treatment (pht000747); HDL, total cholesterol and fasting glucose (pht000742); diabetes treatment (pht000041; because diabetes treatment was not available for exam 8, we used the relevant information from exam 7, assuming the treatment status did not change between these two exams). Cardiovascular disease status at exam 8 and all-cause mortality during follow-up time were derived from the files ‘survival and follow-up status for cardiovascular events’ (pht003316) and ‘survival - all cause mortality’ (pht003317), respectively.
Survival analysis.
For cardiovascular association analysis, the IMM-AGE score was adjusted by linear regression with the cardiovascular covariates used for estimating the ASCVD clinical risk score, specifically age, gender, smoking status, diabetes, total cholesterol, HDL cholesterol and blood pressure. For all-cause- mortality association analysis, we calculated a multivariate Cox regression model regressing all-cause mortality versus the above-mentioned cardiovascular risk factors, cardiovascular disease status assessed on the date of exam 8, and the IMM-AGE score. For the Kaplan-Meier survival plot, IMM-AGE scores were adjusted by linear regression with the above-mentioned cardiovascular risk factors and cardiovascular disease status at exam 8, followed by stratification of individuals using a threshold calculated as the median adjusted IMM-AGE scores across individuals. Survival analyses were performed by R survival package.
Methylation data preprocessing.
Our analysis included the Framingham-Heart Study Offspring cohort that attended the eighth clinical exam for which methylation data were available. Methylation data generated using the platform Infinium HumanMethylation450 BeadChip of Illumina were downloaded from dbGap (study identifier phs000007). Raw data were normalized with a background correction followed by calculation of beta values (minifi R package). We excluded samples in which >1% of the probes exhibited detection P > 0.05, and calculated Horvath’s DNA methylation age per sample using the online calculator (https://dnamage.genetics.ucla.edu/). We excluded samples based on gender mismatch, poor correlation with gold standard (<0.85) and extremely high calculated DNA methylation age (>120), and samples with more than two technical replicates. For individuals with two technical replicates, DNA methylation age was averaged. These filtering steps resulted in 2,693 individuals with available DNA methylation age.
Clinical association analysis of DNA methylation age.
In the analysis used to compare DNA methylation age and IMM-AGE, both scoring systems were adjusted using linear regression for cardiovascular risk factors, including age, gender, smoking status, total cholesterol, HDL cholesterol, blood pressure status, diabetes and existence of cardiovascular disease, followed by exclusion of outlier samples for which the adjusted DNA methylation age exceeded the 99th percentile. For clinical utility comparison analysis, a multivariate Cox regression model was calculated regressing overall survival versus the above-mentioned cardiovascular risk factors, existence of cardiovascular disease and both biological age metrics.
Extended Data
Extended Data Figure 1 |. Study demographics and experimental platforms.
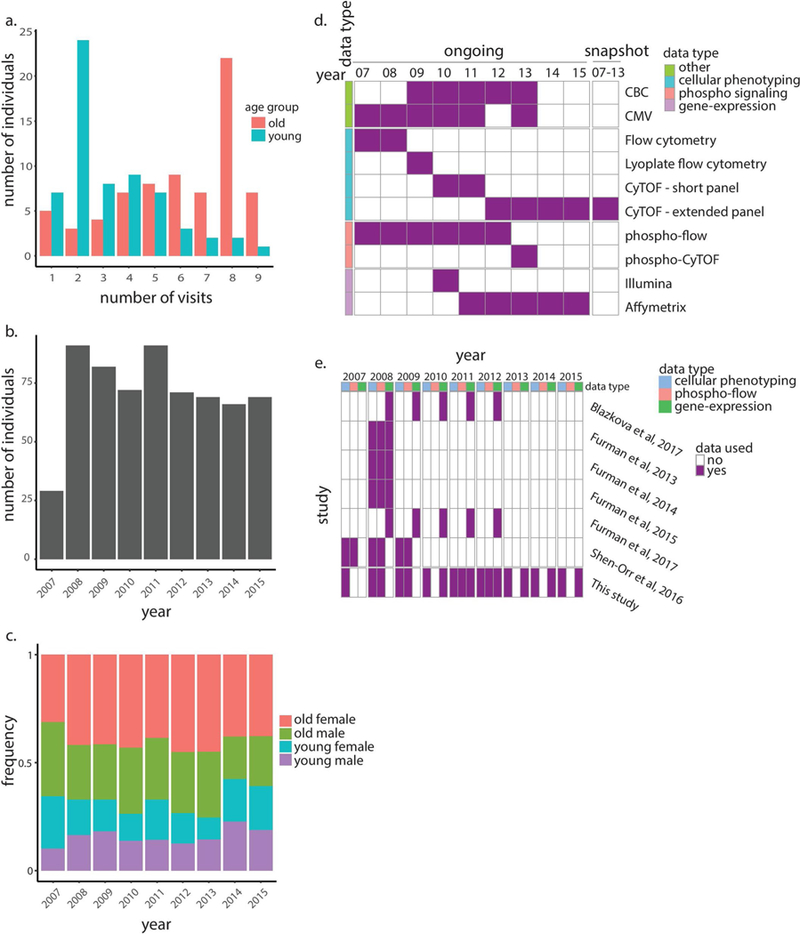
a, Histogram summarizes number of visits (years in which immune profiling was conducted) across individuals stratified by age group. b, Histogram summarizes total number of individuals profiled per year. c, Age and gender distributions of individuals profiled per year. d, Data types and platforms used for immune profiling in each year for snapshot (right column) and ongoing data sets (left columns). e, Data types and relevant years of the Stanford University’s longitudinal study of aging and vaccination that were analyzed in our study (bottom row) and other studies (top rows). CBC, complete blood count.
Extended Data Figure 2 |. Snapshot cohort analysis.
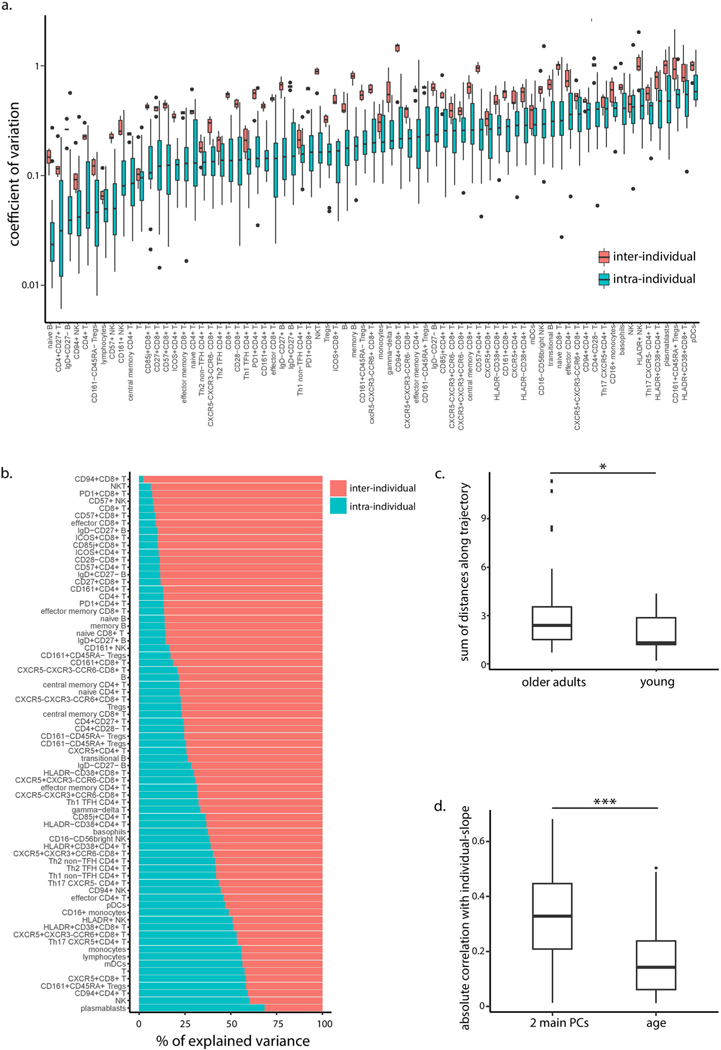
a, Interindividual (pink, n = 18 individuals) and intraindividual (blue, n = 6 years) variation distributions, calculated using coefficient of variation per cell subset. Boxes represent 25th and 75th percentiles around the median (line). Whiskers, 1.5× interquantile, range. b, Percentage of total variance per cell subset explained by interindividual variation (total sum of squares attributed to subject) and intraindividual, variation (residual sum of squares). c, Lengths of within-individual trajectories in young adults versus older adults as measured in the PCA twodimensional, space (P = 0.03, two-tailed t-test, n = 3 young adults and n = 15 older adults). Boxes represent 25th and 75th percentiles around the median, (line). Whiskers, 1.5× interquantile range. d, Spearman correlations of individual-level slopes of cell subsets highly correlated with the first two principal, components with age and the individual’s baseline position along the PCA two-dimensional axes (right and left boxplots, respectively, P = 1.7 × 10⁻⁴, twotailed, paired t-test, n = 39). Boxes represent 25th and 75th percentiles around the median (line). Whiskers, 1.5× interquantile range. *P < 0.05, ***P = 0.001.
Extended Data Figure 3 |. Adjustment of the ongoing dataset using young individuals improves its correlation with the snapshot dataset.
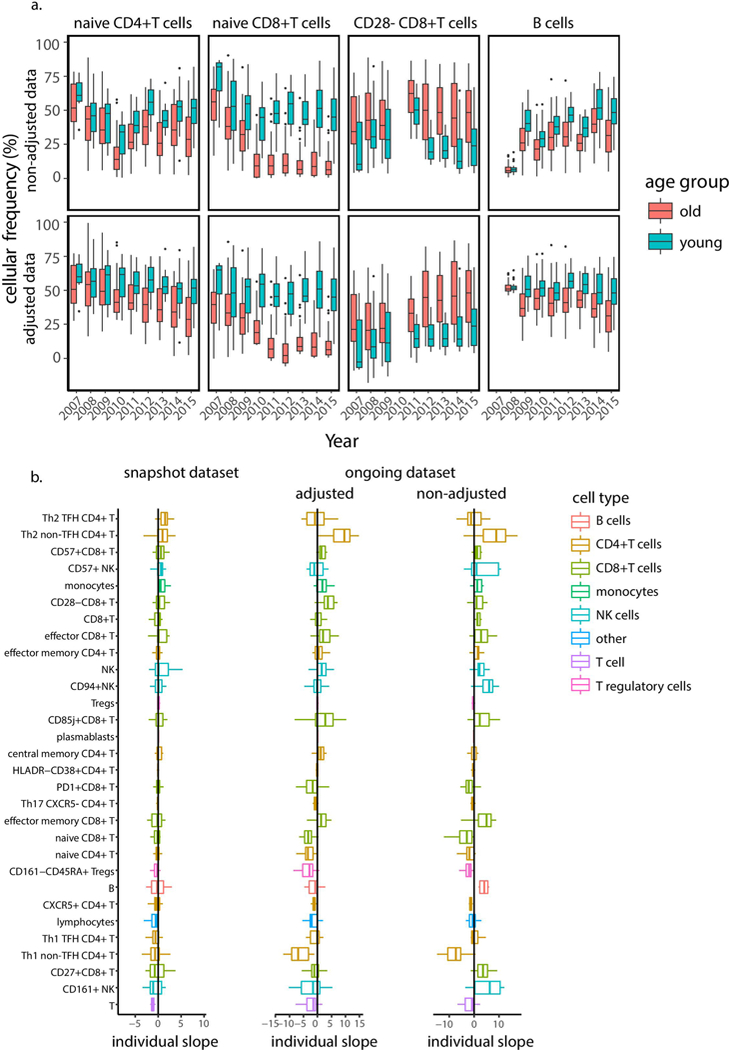
a,, Boxplots of representative cell-subset frequencies in 72 old (pink) and 63 young (light blue) adults before (upper panels) and after (lower panels) adjustment for young individuals. Boxes represent 25th and 75th percentiles around the median (line). Whiskers, 1.5× interquantile range. b, Individual slopes of frequencies of 30 immune cell subsets identified as associated with age calculated based on the snapshot (left), adjusted ongoing (middle) and nonadjusted ongoing (right) data sets. Adjustment of the ongoing data set improved the correlation between the slopes measured in the snapshot and ongoing data sets from 0.29 (linear regression P = 0.12, n = 30) to 0.54 (linear regression P = 0.004, n = 30). Boxes represent 25th and 75th percentiles around the median (line). Whiskers, 1.5× interquantile range.
Extended Data Figure 4 |. Age poorly affects longitudinal dynamics in cellular frequencies.
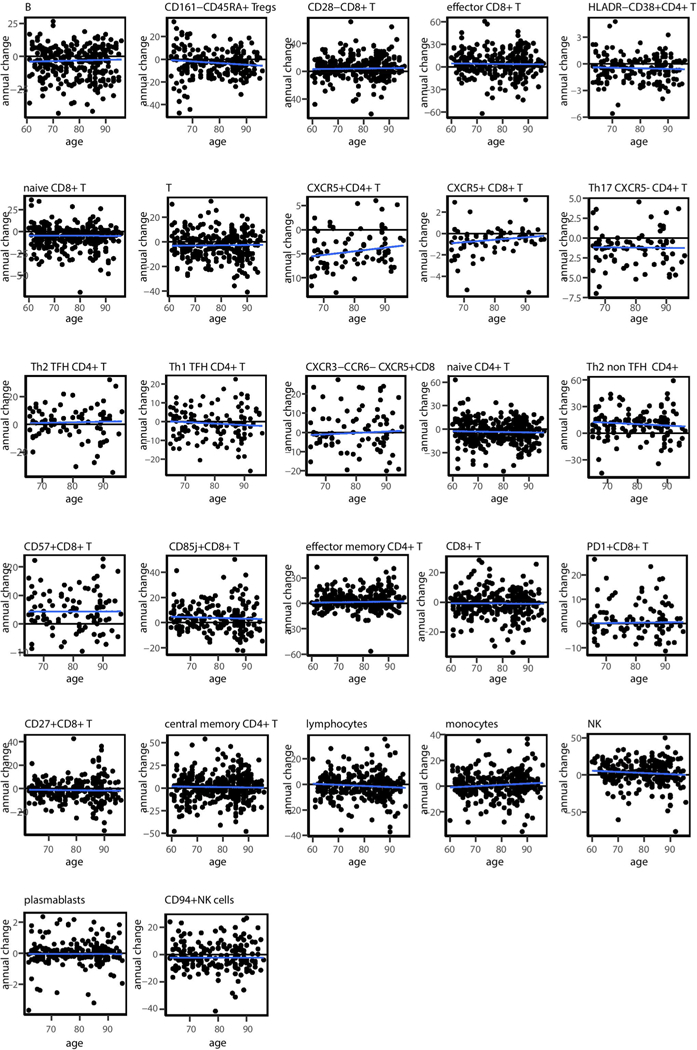
Scatter plots of annual change versus individual age for each cell subset identified as significantly age dependent. Blue lines denote linear regression lines.
Extended Data Figure 5 |. Classification scheme of cell subsets based on their dynamics.
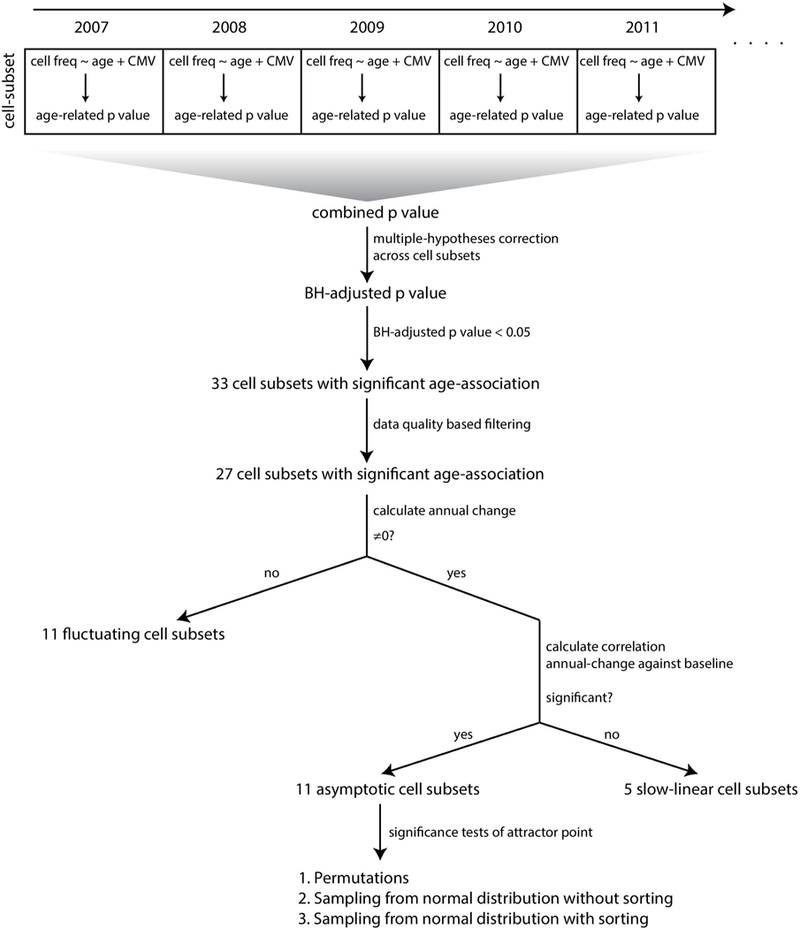
Cell subsets identified as significantly age dependent in a combinatorial analysis across years were filtered based on annual-change data quality. Cell subsets exhibiting an annual change not significantly different from 0 were classified as fluctuating, whereas those exhibiting a significant nonzero annual change were subjected to an additional analysis testing the relationship of their annual change with baseline frequencies. Cell subsets with a nonsignificant association were classified as linear whereas those exhibiting a significant association were classified as asymptotic and were subjected to three additional tests analyzing the significance of their identified attractor point locations.
Extended Data Figure 6 |. Three stages of longitudinal dynamics of cell subsets’ frequencies are captured in the ongoing dataset.
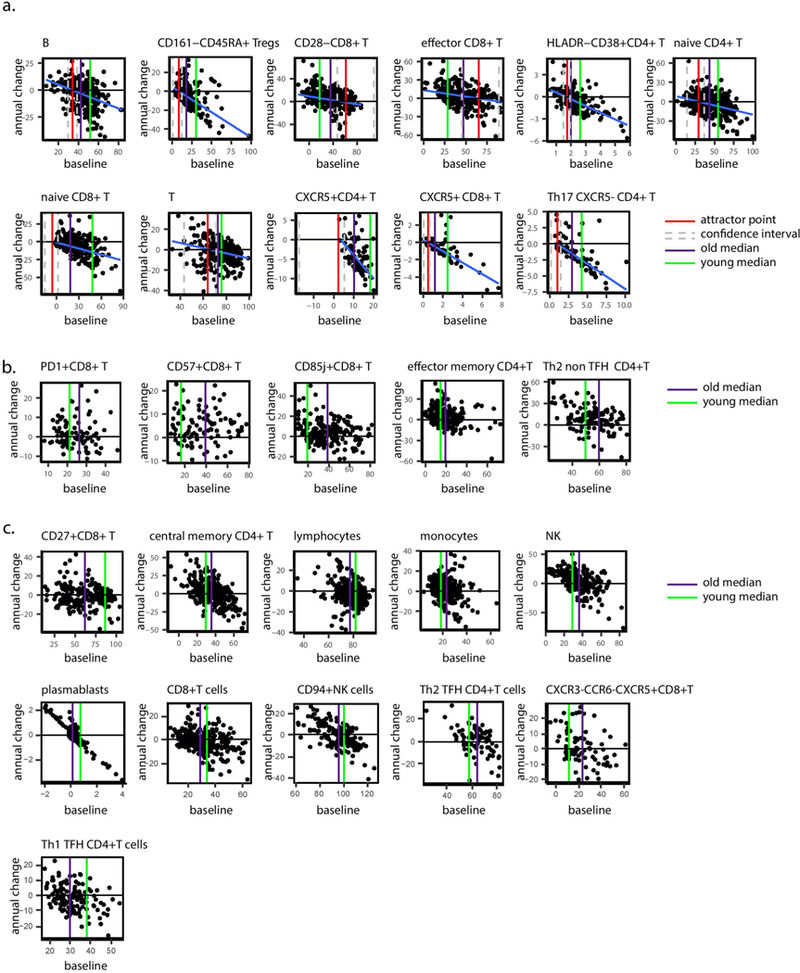
a, Scatter plots of annual change versus baseline frequencies for cell subsets classified as asymptotic. Blue, red, green and purple lines correspond to linear regression lines, attractor point frequencies and median frequency in young and older adults, respectively. Confidence intervals for attractor points are delimited by grey dashed lines. b, Scatter plots of annual change versus the baseline frequencies for cell subsets classified as slow linear. Green and purple lines denote median frequency in young and older adults, respectively. c, Scatter plots of annual change versus the baseline frequencies for cell subsets classified as fluctuating. Green and purple lines denote median frequency in young and older adults, respectively.
Extended Data Figure 7 |. Inherent correlations between cell subsets.
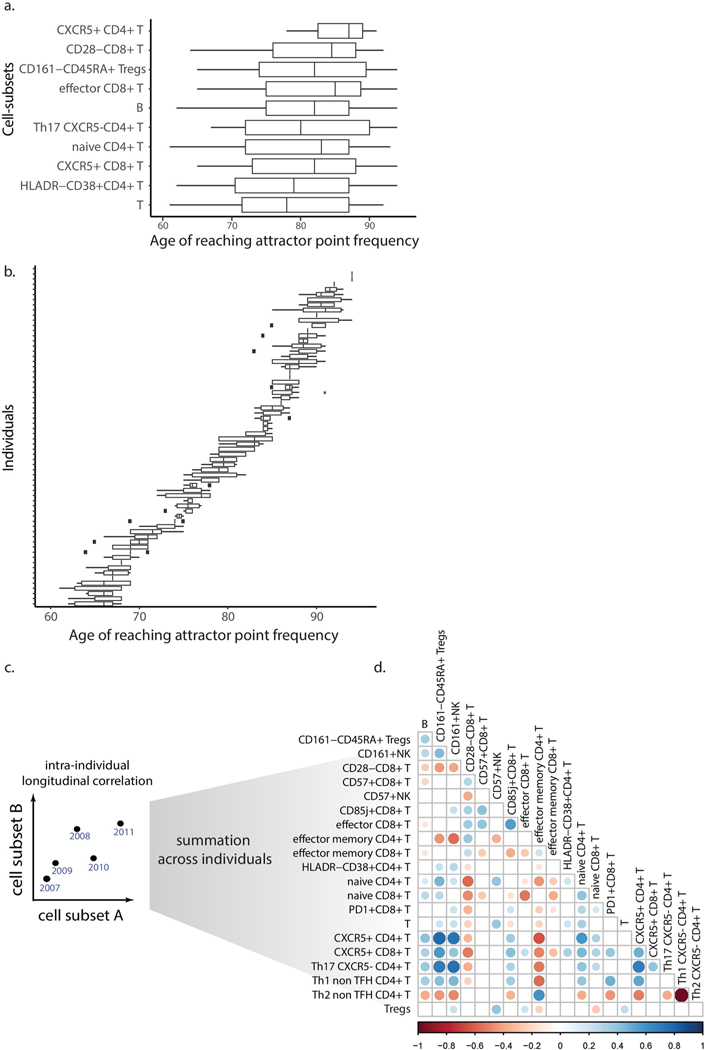
Boxplots denote ages at which cell subsets reached their corresponding attractor point frequencies stratified by either cell subset (median interquartile range of 14.75 years; naive CD8+ T cells were excluded as most individuals did not reach the attractor point frequencies; n = 72 individuals) (a) or individuals (median interquartile range of 2 years; n = 10 cell subsets) (b). Boxes represent 25th and 75th percentiles around the median (line). Whiskers, 1.5× interquantile range. c, Scheme describing longitudinal correlations calculated between every pair of cell subsets. d, Longitudinal pairwise Spearman correlations between cell subsets are indicated by circle color whereas circle size corresponds to P value (calculated by permutations; only correlations (P<0.05) are shown; n = 69 individuals).
Extended Data Figure 8 |. A linear trajectory explains the dynamics of cellular frequencies in healthy aging.
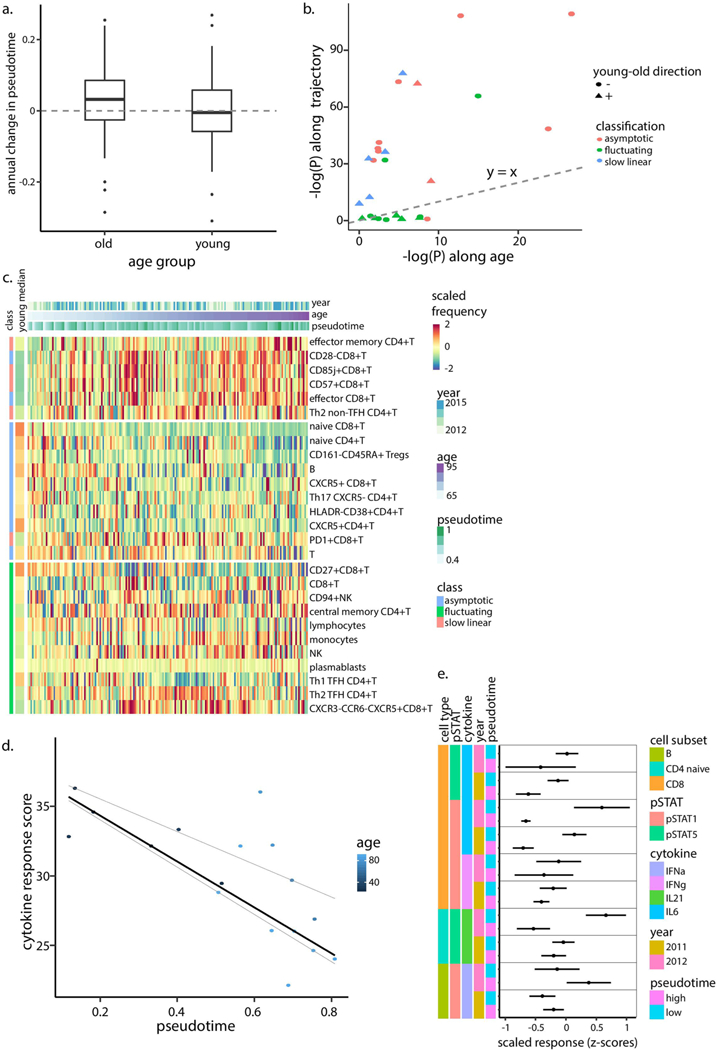
a, Annual change in pseudotime calculated for young (two-tailed binomial test p = 0.648, n = 77) and older (two-tailed binomial test p = 0.0018, n = 210) individuals. Boxes represent 25th and 75th percentiles around the median (line). Whiskers, 1.5× interquantile range. b, Linear-model-derived significance levels (n = 294 samples, calculated as -log[P]) of cellular frequencies that were regressed either versus age (x-axis) or pseudotime (y-axis). Each dot denotes a cell subset with shape corresponding to the direction of young-old differences and color corresponding to the cell subset classification. Dashed line is the y = x line. c, Scaled frequencies of cell subsets classified as asymptotic, slow linear or fluctuating (left bar) along the age axis. Median values of scaled frequencies calculated using young individuals are in the left bar. d, Cytokine response score of year 2012 samples colored by age and median regression line versus pseudotime (quantile regression P = 0.021, 0.77 (n = 17) for pseudotime and age, respectively). Quantile regression lines of quantiles 0.25 and 0.75 are shown as dashed lines. e, Scaled individual phospho-flow cytokine responses measured in years 2011–2012 in individuals positioned in either half of the trajectory as divided by the median (n = 28 and n = 6 in each group for 2011 and 2012, respectively). Dots and error bars correspond to median and s.d., respectively.
Extended Data Figure 9 |. Identification of a gene-set whose expression correlates with IMM-AGE.
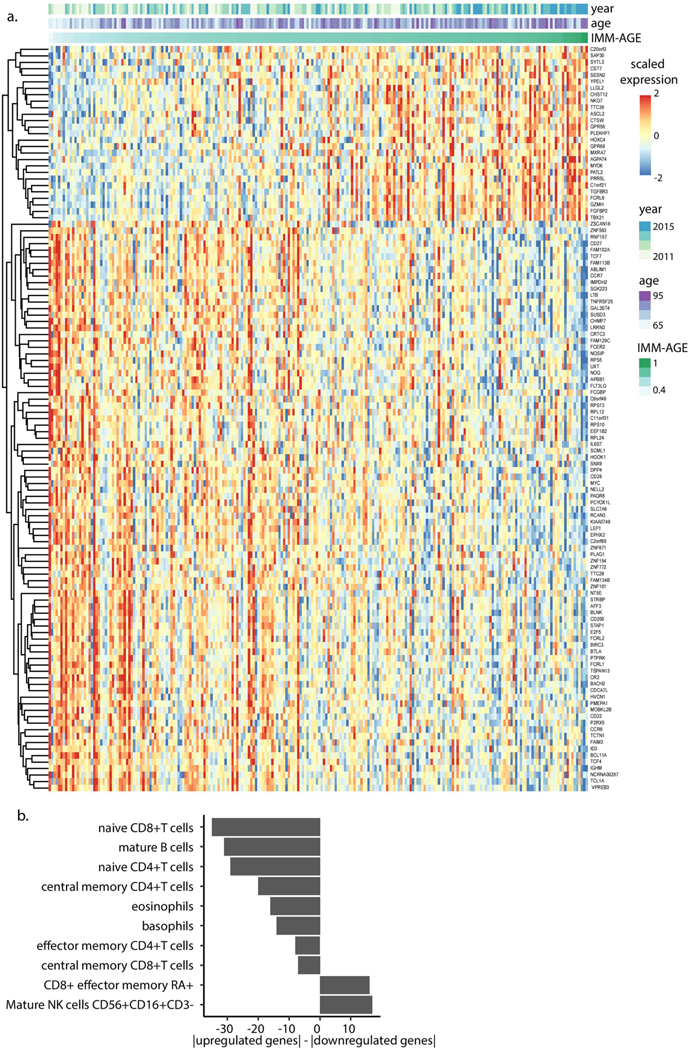
a, Scaled gene expression by individuals ordered based on their IMM-AGE scores for genes identified as consistently changing along the trajectory. Information about individuals’ IMM-AGE, age and year appears on top. b, Difference between number of up- and downregulated genes of the identified gene set expressed by different cell types in the DMAP data set. Only cell types exhibiting significant enrichment either for up- or downregulated genes are displayed.
Extended Data Figure 10 |. Clinical associations of iMM-AGE scores in the Framingham Heart Study dataset.
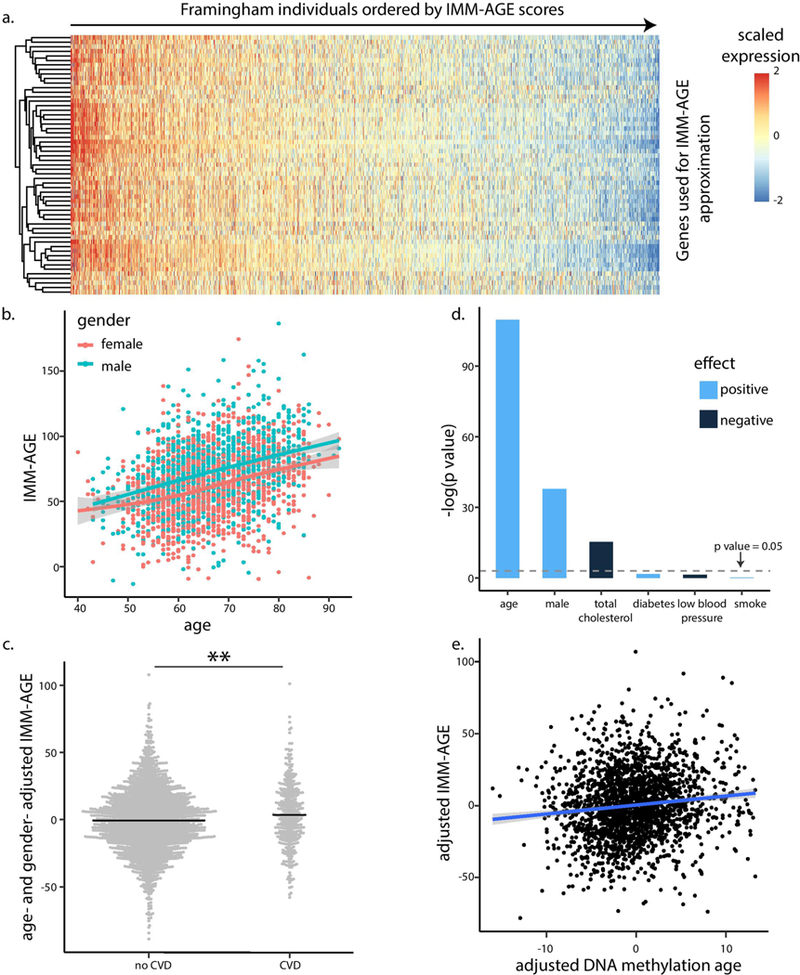
a, Expression levels of genes used for IMM-AGE approximation in gene expression samples of Framingham Heart Study participants ordered by approximated IMM-AGE scores. b, Correlation of estimated IMM-AGE scores with age and gender (linear regression P = 7×10−63 and 7.22 ×10⁻²⁷ (n = 2,292) for age and gender, respectively). Points correspond to individuals; color denotes gender. c, Age- and gender-adjusted IMM-AGE score of individuals stratified based on cardiovascular disease (dots); bold lines denote mean values (P= 0.0023, n = 2,292, two-tailed f-test). d, IMM-AGE score association with cardiovascular risk factors as obtained by linear regression. Bar colors denote positive (light blue) or negative (dark blue) associations. e, Linear regression of IMM-AGE versus DNA methylation age, where both variables were adjusted for cardiovascular risk factors and cardiovascular disease (n = 2,139 individuals). **P<0.01; CVD, cardiovascular disease.
Supplementary Material
Fig. 3 |. Annual change of immune cell–subset frequency depends, on baseline levels rather than on age.
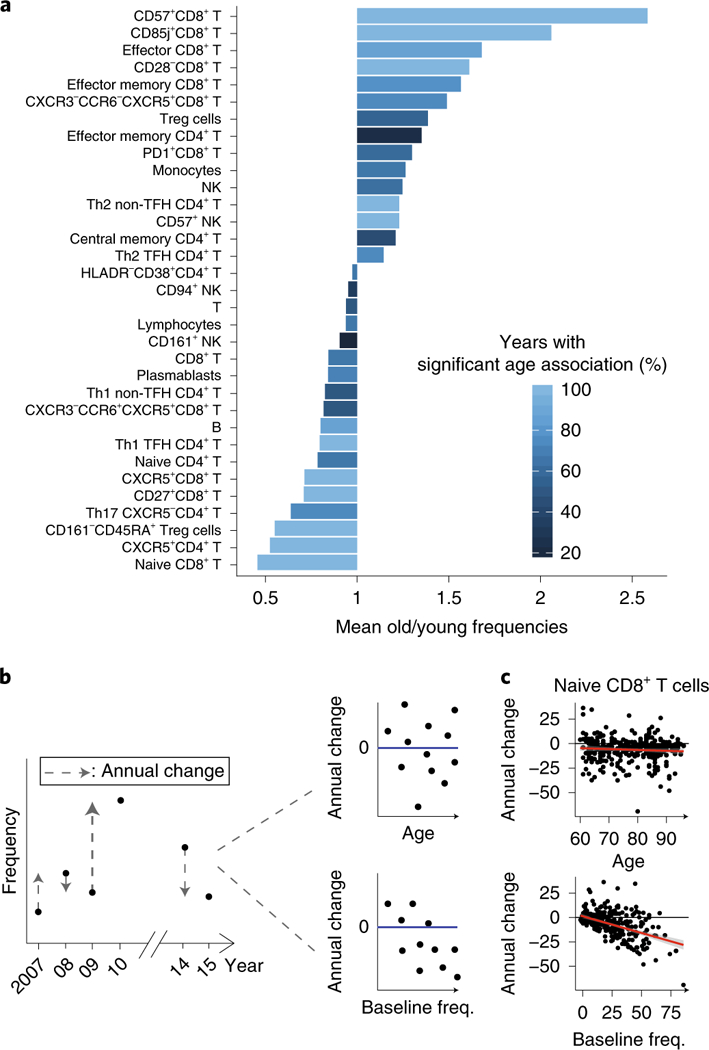
a, Some 33 cell subsets were, consistently correlated with age across 9 years of data (linear models, BHadjusted, combined P < 0.05). Cell subsets are ordered by the mean ratio, of cellular frequencies between older and young adults with color denoting, percentage of years in which a significant correlation versus age was identified. b, Analysis pipeline for estimating immune cell–subset temporal, dynamics in the ongoing data set. Cell-subset dynamics were estimated by regressing the annual change per cell subset for each of two consecutive years (delta) versus the individual’s age (top) or baseline levels of cellular frequency (median linear regression, bottom). c, Correlation between, annual change of naive CD8+ T cells either versus age (top) or versus, baseline frequencies (freq., bottom). Linear regression lines are in red. Th1,, T-helper 1 cells; Th2, T-helper 2 cells; Th17, T-helper 17 cells; Treg cells, regulatory T cells; TFH, T follicular helper cells.
Acknowledgements
We thank M. G’Sell for statistical analysis advice, O. Barak, B. Kidd, F. Haddad and members of the Shen-Orr lab for illuminating discussions; the clinical and administrative staff at the Stanford-Lucille Packard Children’s Hospital Vaccine Program; members of the Stanford Human Immune Monitoring Center for help with assay measurements; and D. Cohen for computational support. This work was supported in part by grants from the Ellison Medical Foundation, Howard Hughes Medical Institute, and National Institute of Allergy and Infectious Diseases (U19 AI057229 and U19 AI090019) to M.M.D.; and from the Israeli Science Foundation (grant 1365/12), Rappaport Institute and Kolk family awards to S.S.S.-O. The project was supported by National Institutes of Health (NIH)/ National Center for Research Resources Clinical and Translational Science Awards to Stanford University (UL1 RR025744). This trial is registered at http://www.clinicaltrials. gov as NCT01827462. The content is solely the responsibility of the authors and does not necessarily represent the official views of the NIH. The funders had no role in study design, data collection and analysis, decision to publish or preparation of the manuscript.
Footnotes
Competing interests
The authors declare competing interests: S.S.S.-O., Y.P. and A.A. are co-inventors of a patent application filed by the Technion and related to this work (provisional application number 62/667,698). S.S.S.-O., D.F. and M.M.D. are co-inventors of US patent US10119959B2 filed by Stanford and related to this work. R.G. holds equity in and is an employee of CytoReason. S.S.S-O, E.S. and K.K. hold equity in and consult for CytoReason. The authors have no other competing interests to disclose.
Additional information
Extended data is available for this paper at https://doi.org/10.1038/s41591–019-0381-y.
Supplementary information is available for this paper at https://doi.org/10.1038/ s41591–019-0381-y.
Reprints and permissions information is available at www.nature.com/reprints.
Publisher’s note: Springer Nature remains neutral with regard to jurisdictional claims in published maps and institutional affiliations.
Online content
Any methods, additional references, Nature Research reporting summaries, source data, statements of data availability and associated accession codes are available at https://doi.org/10.1038/ s41591–019-0381-y.
Ethical compliance. Written informed consent was obtained from all the study participants, and the study protocol was approved by the Stanford University Administrative Panels on Human Subjects in Medical Research (IRBs), confirming that the study complies with the relevant ethical regulations.
Code availability
Source code is available from the corresponding author upon reasonable request.
Data availability
Frequencies of gated cellular populations for the snapshot and ongoing data sets are in Supplementary Tables 3 and 5, respectively. Adjusted frequencies for the ongoing data set are in Supplementary Table 6. Subjects’ identities were shuffled to protect their privacy. Raw fcs files of the ongoing data set used for both cellular phenotyping and phospho-flow analysis were deposited into the Immport website (http://www.immport.org/immport-open/public/home/home) and can be downloaded using the following accession codes stratified by year: SDY212 (2008), SDY312 (2009), SDY311 (2010), SDY112 (2011), SDY315 (2012) and SDY478 (2013). Raw gene expression.CEL files for years 2011–2012 were deposited into the Immport website and can be downloaded using the following accession codes stratified by year: SDY112 (2011) and SDY315 (2012). Raw and processed gene expression data for years 2013–2015 are available in the GEO website (https://www. ncbi.nlm.nih.gov/geo/) through the following accession numbers: GSE123696 (2013), GSE123687 (2014) and GSE123698 (2015). Longitudinal clinical data of the participants are available in Supplementary Table 13, with the same shuffling of subjects’ identities used for cellular frequency data. DMAP gene expression data are publicly available on the GEO website (accession number GSE24759). Gene expression and methylation data from the Framingham Heart Study are available through dbGaP (study identifier phs000007). Phenotypic data are similarly available using the following accession codes: gender and age at exam 8 (pht003099); smoking status, blood pressure and blood pressure treatment (pht000747); HDL, total cholesterol and fasting glucose (pht000742); diabetes treatment (pht000041). Cardiovascular disease status at exam 8 and all-cause mortality during follow-up time were derived from the files ‘survival and follow-up status for cardiovascular events’ (pht003316) and ‘survival - all cause mortality’ (pht003317), respectively.
References
- 1.Goronzy JJ & Weyand CM Understanding immunosenescence to improve responses to vaccines. Nat. Immunol. 14, 428–436 (2013). [DOI] [PMC free article] [PubMed] [Google Scholar]
- 2.Deleidi M, Jggle M & Rubino G Immune ageing, dysmetabolism and inflammation in neurological diseases. Front. Neurosci. 9, 172 (2015). [DOI] [PMC free article] [PubMed] [Google Scholar]
- 3.Dorshkind K, Montecino-Rodriguez E & Signer RAJ The ageing immune system: is it ever too old to become young again? Nat. Rev. Immunol. 9, 57–62 (2009). [DOI] [PubMed] [Google Scholar]
- 4.Gruver AL, Hudson LL & Sempowski GD Immunosenescence of ageing. J. Pathol. 211, 144–156 (2007). [DOI] [PMC free article] [PubMed] [Google Scholar]
- 5.McElhaney JE Influenza vaccine responses in older adults. Ageing Res. Rev. 10, 379–388 (2011). [DOI] [PMC free article] [PubMed] [Google Scholar]
- 6.Carr EJ et al. The cellular composition of the human immune system is shaped by age and cohabitation. Nat. Immunol. 17, 461–468 (2016). [DOI] [PMC free article] [PubMed] [Google Scholar]
- 7.Nikolich-Zugich J The twilight of immunity: emerging concepts in aging of the immune system. Nat. Immunol. 19, 10–19 (2018). [DOI] [PubMed] [Google Scholar]
- 8.Lo Pez-Otin C, Blasco MA, Partridge L, Serrano M & Kroemer G The hallmarks of aging. Cell 153, 1194–1217 (2013). [DOI] [PMC free article] [PubMed] [Google Scholar]
- 9.Franceschi C et al. Inflamm-aging. An evolutionary perspective on immunosenescence. Ann. N. Y. Acad. Sci. 908, 244–254 (2000). [DOI] [PubMed] [Google Scholar]
- 10.Shen-Orr SS et al. Defective signaling in the JAK-STAT pathway tracks with chronic inflammation and cardiovascular risk in aging humans. Cell Syst. 3, 374–384.e4 (2016). [DOI] [PMC free article] [PubMed] [Google Scholar]
- 11.Furman D et al. Expression of specific inflammasome gene modules stratifies older individuals into two extreme clinical and immunological states. Nat. Med. 23, 174–184 (2017). [DOI] [PMC free article] [PubMed] [Google Scholar]
- 12.Orru V et al. Genetic variants regulating immune cell levels in health and disease. Cell 155, 242–256 (2013). [DOI] [PMC free article] [PubMed] [Google Scholar]
- 13.Patin E et al. Natural variation in the parameters of innate immune cells is preferentially driven by genetic factors. Nat. Immunol. 19, 302–314 (2018). [DOI] [PubMed] [Google Scholar]
- 14.Roederer M et al. The genetic architecture of the human immune system: a bioresource for autoimmunity and disease pathogenesis. Cell 161, 387–403 (2015). [DOI] [PMC free article] [PubMed] [Google Scholar]
- 15.Brodin P et al. Variation in the human immune system is largely driven by non-heritable Influences. Cell 160, 37–47 (2015). [DOI] [PMC free article] [PubMed] [Google Scholar]
- 16.Tsang JS Utilizing population variation, vaccination, and systems biology to study human immunology. Trends Immunol. 36, 479–493 (2015). [DOI] [PMC free article] [PubMed] [Google Scholar]
- 17.Shen-Orr SS & Furman D Variability in the immune system: Of vaccine responses and immune states. Curr. Opin. Immunol. 25, 542–547 (2013). [DOI] [PMC free article] [PubMed] [Google Scholar]
- 18.Brodin P & Davis MM Human immune system variation. Nat. Rev. Immunol. 17, 21–29 (2017). [DOI] [PMC free article] [PubMed] [Google Scholar]
- 19.Kaczorowski KJ et al. Continuous immunotypes describe human immune variation and predict diverse responses. Proc. Natl Acad. Sci. USA 114, E6097–E6106 (2017). [DOI] [PMC free article] [PubMed] [Google Scholar]
- 20.Horvath S et al. An epigenetic clock analysis of race/ethnicity, sex, and coronary heart disease. Genome Biol. 17, 171 (2016). [DOI] [PMC free article] [PubMed] [Google Scholar]
- 21.Clegg A, Young J, Iliffe S, Rikkert MO & Rockwood K Frailty in elderly people. Lancet 381, 62167–62169 (2013). [DOI] [PMC free article] [PubMed] [Google Scholar]
- 22.Nakaya HI et al. Systems analysis of immunity to influenza vaccination across multiple years and in diverse populations reveals shared molecular signatures. Immunity 43, 1186–1198 (2015). [DOI] [PMC free article] [PubMed] [Google Scholar]
- 23.Bektas A, Schurman SH, Sen R & Ferrucci L Aging, inflammation and the environment. Exp. Gerontol. 105, 10–18 (2018). [DOI] [PMC free article] [PubMed] [Google Scholar]
- 24.Pawelec G Immune parameters associated with mortality in the elderly are context-dependent: lessons from Sweden, Holland and Belgium. Biogerontology 19, 537–545 (2018). [DOI] [PubMed] [Google Scholar]
- 25.Lin Y et al. Changes in blood lymphocyte numbers with age in vivo and their association with the levels of cytokines/cytokine receptors. Immun. Ageing 13, 24 (2016). [DOI] [PMC free article] [PubMed] [Google Scholar]
- 26.Strogatz SH Nonlinear Dynamics and Chaos: With Applications to Physics, Biology, Chemistry, and Engineering (Studies in Nonlinearity) 1st edn (Addison-Wesley, Reading, Mass., 1994). [Google Scholar]
- 27.Furman D et al. Apoptosis and other immune biomarkers predict influenza vaccine responsiveness. Mol. Syst. Biol. 9, 659 (2013). [DOI] [PMC free article] [PubMed] [Google Scholar]
- 28.Merino J et al. Progressive decrease of CD8high+ CD28+ CD57- cells with ageing. Clin. Exp. Immunol. 112, 48–51 (1998). [DOI] [PMC free article] [PubMed] [Google Scholar]
- 29.Afzali B et al. CD161 expression characterizes a subpopulation of human regulatory T cells that produces IL-17 in a STAT3-dependent manner. Eur. J. Immunol. 43, 2043–2054 (2013). [DOI] [PMC free article] [PubMed] [Google Scholar]
- 30.Haghverdi L, Büttner M, Wolf FA, Buettner F & Theis FJ Diffusion pseudotime robustly reconstructs lineage branching. Nat. Methods 13, 845–848 (2016). [DOI] [PubMed] [Google Scholar]
- 31.Shen-Orr SS et al. Defective signaling in the JAK-STAT pathway tracks with chronic inflammation and cardiovascular risk in aging humans. Cell Syst. 3, 374–384.e4 (2016). [DOI] [PMC free article] [PubMed] [Google Scholar]
- 32.D’Agostino RB et al. General cardiovascular risk profile for use in primary care: The Framingham Heart Study. Circulation 117, 743–753 (2008). [DOI] [PubMed] [Google Scholar]
- 33.Barbie DA et al. Systematic RNA interference reveals that oncogenic KRAS-driven cancers require TBK1. Nature 462, 108–112 (2009). [DOI] [PMC free article] [PubMed] [Google Scholar]
- 34.Horvath S DNA methylation age of human tissues and cell types. Genome Biol. 14, R115 (2013). [DOI] [PMC free article] [PubMed] [Google Scholar]
- 35.Marioni RE et al. DNA methylation age of blood predicts all-cause mortality in later life. Genome Biol. 16, 25 (2015). [DOI] [PMC free article] [PubMed] [Google Scholar]
- 36.Waddington CH The Strategy of the Genes. A Discussion of Some Aspects of Theoretical Biology. With an Appendix by Kacser H (George Allen & Unwin, London, 1957). [Google Scholar]
- 37.Pawelec G Immune parameters associated with mortality in the elderly are context-dependent: lessons from Sweden, Holland and Belgium. Biogerontology 19, 537–545 (2018). [DOI] [PubMed] [Google Scholar]
- 38.Ridker PM et al. Antiinflammatory therapy with canakinumab for atherosclerotic disease. N. Engl. J. Med. 377, 1119–1131 (2017). [DOI] [PubMed] [Google Scholar]
- 39.Blazkova J et al. Multicenter systems analysis of human blood reveals immature neutrophils in males and during pregnancy. J. Immunol. 198, 2479–2488 (2017). [DOI] [PMC free article] [PubMed] [Google Scholar]
- 40.Furman D et al. Systems analysis of sex differences reveals an immunosuppressive role for testosterone in the response to influenza vaccination. Proc. Nail Acad. Sci. USA 111, 869–874 (2014). [DOI] [PMC free article] [PubMed] [Google Scholar]
- 41.Furman D et al. Cytomegalovirus infection enhances the immune response to influenza. Sci. Transl. Med. 7, 281ra43 (2015). [DOI] [PMC free article] [PubMed] [Google Scholar]
- 42.Dai H, Leeder JS & Cui Y A modified generalized Fisher method for combining probabilities from dependent tests. Froni. Genei. 5, 32 (2014). [DOI] [PMC free article] [PubMed] [Google Scholar]
- 43.Novershtern N Densely interconnected transcriptional circuits control cell states in human hematopoiesis. Cell 144, 296–309 (2011). [DOI] [PMC free article] [PubMed] [Google Scholar]
Associated Data
This section collects any data citations, data availability statements, or supplementary materials included in this article.


