Abstract
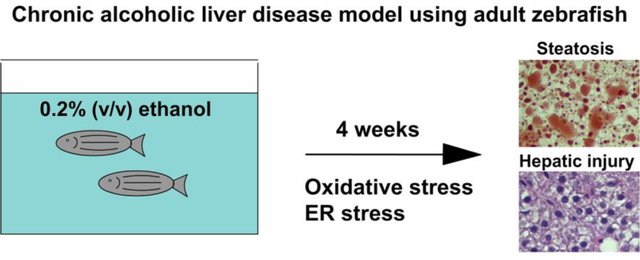
Chronic alcohol consumption is a major cause of chronic liver disease worldwide. Adult zebrafish have emerged as a new vertebrate model of alcoholic liver disease. In previous research, a high dose of chronic ethanol treatment induced characteristic features of steatosis and hepatic injury in adult zebrafish, yet the ethanol concentration in that study was significantly higher than the lethal dose in humans. In the current study, we examined whether a low dose of chronic ethanol exposure in adult zebrafish induced the metabolic and pathological features seen in alcoholic liver disease. We found that chronic ethanol treatment at 0.2 % ethanol (v/v) concentration for 4 weeks induced a significant elevation of serum glucose and triacylglycerol in adult zebrafish. In addition, serum alanine aminotransferase activity was significantly elevated after ethanol treatment. Histological analysis revealed steatosis and hepatocyte ballooning phenotype. Gene expression analysis using quantitative real-time PCR suggested that ethanol treatment induced inflammation, apoptosis, and fibrosis. In addition, we found significant increases in gene expression involved in glucose and lipid metabolism as well as mitochondrial biogenesis and function. Importantly, expression of genes involved in oxidative and endoplasmic reticulum stress, two major stress signaling pathways underlying hepatic injury in alcoholic liver disease, were highly upregulated in the livers of adult zebrafish after chronic ethanol treatment. In conclusion, we found that 4 weeks of low dose ethanol exposure leads to typical ethanol-induced liver disease, with pathological and gene expression patterns.
Keywords: Zebrafish, ethanol, liver, steatosis, hepatic injury
Graphical Abstract
Introduction
Patients with alcoholic liver disease (ALD) exhibit a wide spectrum of defects ranging from simple steatosis to steatohepatitis, fibrosis, cirrhosis, and hepatocellular carcinoma [1–3]. To study the pathophysiology and therapy of ALD, it is essential to develop an appropriate animal model. A recent study introduced adult zebrafish as a model of chronic alcoholic liver disease [4], and the study showed that chronic ethanol treatment (1% ethanol v/v) induced progression of alcoholic liver disease from simple steatosis to fibrosis after 2 to 12 weeks of treatment. However, the ethanol concentration was still higher than the lethal blood alcohol concentration in people (>0.5%). In addition, we recently found that adult zebrafish lost their appetite during 1% ethanol treatment, which might affect the pathogenesis of alcoholic liver disease. An additional study of ALD in adult zebrafish showed that high dose ethanol treatment (0.5%) for 2 to 4 weeks was enough to induce a range of ALD symptoms from steatosis to hepatic injury including fibrosis [5]. However, both studies focused on pathological analysis in the liver and changes of marker gene expression in the liver related to inflammation and lipogenesis; moreover, there was no investigation for genes associated with cellular stress directly linked to hepatic injury. Thus, comprehensive gene expression analysis would be required to establish adult zebrafish as a feasible model of ALD. In addition, because higher than 0.5% blood alcohol concentration is lethal in humans, 1% ethanol treatment may not be ideal to represent the condition of chronic ALD. To recapitulate the human ALD condition, we have tested lower doses of ethanol that can induce the intoxicated status in people. In this study, we addressed whether a low dose of ethanol (0.2% v/v) can recapitulate ethanol-induced hepatic injury and related metabolic changes seen in ALD patients, such as increases in serum glucose and neutral lipids levels [6, 7]. Importantly, 0.2% ethanol approximates the blood alcohol concentration in intoxicated humans. To assess such metabolic change and liver injury, we measured serum alanine aminotransferase (ALT), glucose and triacylglyceride level as well as histological analysis of the liver after 4 weeks of ethanol exposure in adult zebrafish. In addition, gene expression analysis was performed by quantitative RT-PCR of genes associated with liver inflammation, cell death, fibrosis, and lipid and glucose metabolism. Further, to determine two major stress signaling pathways causing the ethanol-induced liver injury, we evaluated multiple genes associated with oxidative stress and endoplasmic reticulum (ER) stress.
Materials and Methods
Zebrafish husbandry
All methods of this article were performed in accordance with relevant guidelines and regulations of the NIH Guide for the Care and Use of Laboratory Animals and Medical University of South Carolina’s Division of laboratory animal resources (DLAR). All experiments on zebrafish were approved by the Institutional Animal Care and Use Committee (IACUC) of the Medical University of South Carolina (IACUC protocol #3364). Two groups of 20 wild type male zebrafish (8 months) were raised in an isolated glass fish tank containing 8L of water with or without 0.2% ethanol (v/v) for 4 weeks. Fresh water with/without ethanol was exchanged every day in the morning and covered with glass lids to decrease of ethanol concentration that can be affected by fish metabolism and natural evaporation. We fed regular food twice per day (10 mg/fish/meal, the tested amount of food that can be completely consumed within 10 minutes).
H & E staining
Truncated bodies were fixed in 4% paraformaldehyde from overnight to two days at 4°C. Fixed samples were embedded in 1.2% agarose/5% sucrose, and saturated in 30% sucrose at 4°C for 1 to 2 days. Blocks were frozen using liquid nitrogen. 10 μm sections were collected on microscope slides using a Leica cryostat. Sections were used for H&E staining, which was conducted in the Histo-Core lab at Medical University of South Carolina (MUSC). Images were taken with HD202-S11B camera attached to the AmScope T800 microscope (United Scope LLC, Irvine, CA, USA).
PicroSirius red staining
Livers were fixed in 4% paraformaldehyde from overnight to two days at 4°C. Fixed samples were embedded in paraffin and sectioned in the Histo-Core lab at Medical University of South Carolina (MUSC). For Picrosirius red staining, sections were de-paraffinized in xylene and hydrated in distilled water. Slides were incubated with 0.1% Picro Sirius red (Polysciences Inc., Warrington, PA) and fast green FCF (Sigma-Aldrich, St.Louis, MO) solution for 1 hour and rinsed with acidified water (0.5% acetic acid). Sections were cleared in xylene and mounted with VectaMount permanent mounting medium (Vector Laboratories, Cat. H-5000).
Oil Red O (ORO) Staining.
For ORO staining on transversely sectioned larvae, frozen sections with 10 μm thickness were dried at room temperature for 5 minutes. 150 μl of working ORO solution (5% ORO in 60% isopropyl alcohol) was dropped to slides and stained for 30 seconds. Slides were then washed with distilled water and mounted using 75% glycerol.
Blood preparation and biochemical analysis
Zebrafish blood was obtained by minimally invasive blood collection using a heparinized needle. The site for blood collection is along the body axis and posterior to the anus in the region of the dorsal aorta. Blood was collected from adult zebrafish, 20 hours after feeding and diluted 1:10 in PBS. The average volume of blood collected from a three-individual fish (average body weight = 0.6 g) was 25 μL. Blood glucose level was measured with Bayer Contour NEXT Diabetes EZ meter (Bayer AG, Germany) using Contour NEXT Blood Glucose Test Strip. Plasma was separated by centrifugation for 15 minutes at 2,000 x g using a refrigerated centrifuge. 10 μl of plasma were transferred to 96-well plate, and ALT was measured using a microplate-based ALT activity assay kit (Pointe Scientific, Cat. A7526). Plasma triglycerides (TG) in diluted plasma was measured with INFINITY™ Triglycerides Liquid Stable Reagent (Thermo Scientific, Cat.no. TR22421) according to manufacturer’s protocol.
Quantitative polymerase chain reaction (qPCR)
For the qPCR studies in the liver, total RNA was isolated with Trizol® Reagent (Invitrogen, Cat. 15596–026) from three to five siblings per each group. Livers from preselected zebrafish, showing medium level of ALT level in each groups were used for qPCR analysis. The same amount of RNA was mixed to make pooled RNA as a template for complementary DNA synthesis. Oligo-dT primed complementary DNA were prepared by using superscript III First-Strand kit (Invitrogen, Cat.18080–051). Real-Time qPCR was performed with Bio-rad, CFX96 Real-time system with 1 cycle of 98°C for 30 seconds, 45 cycles of 95°C for 15 seconds, and 60°C for 30 seconds using 50 ng cDNA, 4 pmoles of each gene-specific primers per 20 μl reaction (Supporting Table 1), and SsoAdvanced™ Universal SYBR® Green Supermix (Bio-rad, Cat. 172–5274). We used qPCR primers that we employed in our previous study [8], or we newly designed and tested in our lab. Glyceraldehyde-3-phosphate dehydrogenase (gapdh) was used as reference, and relative quantification was calculated using double delta Ct method. The qPCR was run in at least triplicate for each gene. Total RNA were isolated from 3 to 5 livers in each group.
Hepatic TG analysis
Three of unexposed control and ethanol exposed fish were subjected to an overnight-fasting and obtained liver. Liver homogenized in tissue homogenization buffer (250 mM sucrose, 25 mM KCl, 0.5 mM EDTA, 50 mM Tris-HCl, pH 7.4) with 1x protease & phosphatase inhibitor (Halt™ protease & phosphatase inhibitor cocktail, Thermo Fisher Scientific, Cat. 78441) by sonication method. We collected the lysate and determined protein concentration using the Pierce™ BCA protein assay (Thermo Fisher Scientific, Cat. 23227); we kept the lysate in −80°C before TG analysis. Liver TG was measured by using Triglycerides Reagent (Thermo Scientific, Cat.no. TR22421) according to manufacturer’s protocol.
Measurement of intracellular ROS
Intracellular ROS was measured by using OxiSelect. In Vitro ROS/RNS Kit from Cell Biolabs (San Diego, CA), as per the manufacturer’s protocol. Lysates were collected (1 mg/ml) and immediately subjected to the ROS/RNS measurement. The fluorescent intensity of fluorophore dichlorofluorescein (DCF), which was formed by peroxide oxidation of the non-fluorescent precursor dichlorodihydrofluorescin (DCFH), was detected at 480Ex/530Em BMG LABTECH CLARIOstar (Germany). In contrast, DCFH with lysis buffer was used as a blank control.
Measurement of GSH and GSSG levels
Quantitative determinations of GSH and GSSG levels in liver lysates were performed using the enzymatic-recycling method [9]. Proteins in the extracts from control diet fed and PA-enriched diet fed adult livers were precipitated by sulfosalicylic acid and the supernatant was then divided into two tubes. For reduced GSH, the supernatant was incubated with the thiol fluorescent probe IV, and fluorescent intensities were measured at 400Ex/465Em. For total GSH (GSH+GSSG), the supernatant was neutralized by triethanolamine and incubated with the reduction system (containing NADPH and glutathione reductase) at 37°C for 20 min. GSSG was calculated based on the results from reduced GSH and total GSH; the ratio of .
Statistical tests
All evaluations were performed with MS Excel software. The Student t-test was used to test significant differences between groups. For the qPCR studies, three sets of qPCR were analyzed per each target gene. P values less than 0.05 were considered statistically significant.
Results
Low dose of ethanol treatment induced hepatic injury and mild fibrosis in adult zebrafish
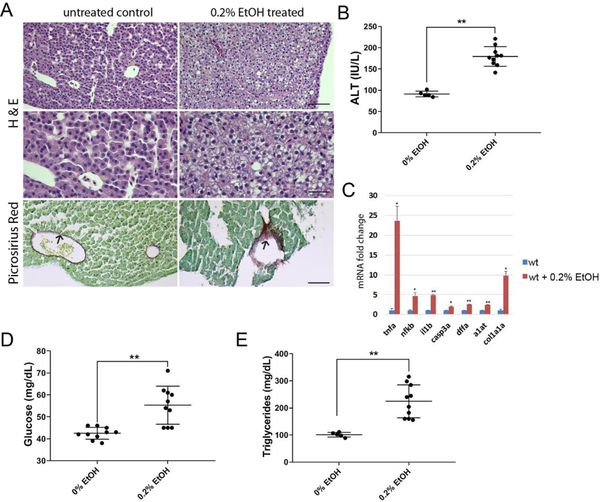
We tested whether low dose ethanol treatment can induce hepatic injury in adult zebrafish. Three groups of 14-month-old wild type male siblings were kept separated in a 10-liter capacity glass tank. The control group was raised in an isolated tank with system water from the main fish facility. Two groups of siblings were raised in water containing 0.2% ethanol (v/v). Ethanol treated water in the tank was exchanged once every other day for 4 weeks. The histological analysis showed an accumulation of ballooned hepatocytes in 0.2% ethanol treated fish and mild fibrosis (Figure 1A). In addition, the activity assay of serum alanine aminotransferase (ALT) indicated a liver injury in ethanol treated groups compared to the untreated control group (Figure 1B). Additionally, gene expression analysis involved in inflammation (tnfa, il1b), cell death (casp3a, dffa), hepatic injury (a1at), and fibrosis (col1a1a) using qPCR showed a significant elevation of tested genes in the liver of ethanol treated groups compared to untreated siblings (Fig. 1C), supporting an increase of serum ALT after chronic ethanol treatment.
Figure 1.
Chronic ethanol treatment induced hepatic injury, inflammation in the liver and elevation of serum glucose and triglycerides. Adult zebrafish were exposed to 0.2% ethanol for 4 weeks. (A) Hematoxylin and eosin (H&E) staining and Picrosirius Red staining in the liver of untreated and 0.2% ethanol treated adult zebrafish (top and middle). Control livers showed normal hepatocytes (n=8/10) and ethanol treated siblings showed hepatic injury (n=9/10). Control livers showed thin layer of picrosirius red positive staining surrounding blood vessels (n=6/6), ethanol exposed group showed intense staining of fibrotic tissue in some cases (n=2/5) Scale bar=50μm (top, bottom), 25 μm (middle). (B) Alanine aminotransferase assay from blood samples of control, 0.2 % ethanol exposed zebrafish. (C) Relative mRNA expression of genes associated with inflammation and liver injury. RNAs extracted from three to five siblings were used for analysis. (D) Quantification of serum glucose in control and ethanol treated zebrafish. (E) Quantification of serum triglycerides in control and ethanol treated zebrafish. Error bars indicate standard deviation of the mean. * p<0.05, ** p<0.005.
Low dose chronic ethanol treatment caused hyperglycemia, hyperlipidemia in adult zebrafish
Chronic alcohol consumption induces hyperglycemia and hypertriglyceridemia symptoms in people [10, 11]. We tested whether a low dose chronic ethanol treatment in adult zebrafish can recapitulate symptoms observed in humans. Blood samples were collected from the dorsal aorta located in the trunk of zebrafish using the glass pipette needle coated with heparin after treatment. Blood alcohol assay showed that 0.2% (v/v) ethanol exposure resulted in 0.165 and 0.175 % blood alcohol concentration after 1 day and 4 weeks, respectively (supporting Fig. S1). We found an increase in the serum glucose level (1.3 fold higher than untreated control) in the 0.2% ethanol treated group (Fig. 1D). In addition, we found a significant increase in the triacylglycerol level (2.2 fold) compared to untreated control after 0.2% ethanol treatment (Fig. 1E). Thus, the low dose chronic ethanol treatment in adult zebrafish recapitulated basic metabolic changes such as hyperglycemia and hyperlipidemia observed in patients with alcoholic liver disease.
Ethanol treated enhanced lipid metabolism and steatosis in the liver of adult zebrafish
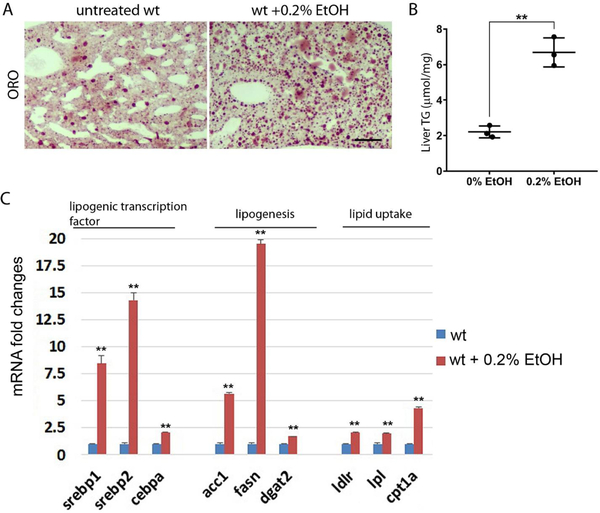
To investigate whether hepatic lipid metabolism was altered by chronic ethanol treatment in the liver of adult zebrafish, we examined the mRNA expression of genes involved in lipid metabolism using qPCR (Fig. 2C). We found a significant increase of genes for lipogenic transcription factors including sterol regulatory element binding transcription factor 1 (srebp1), srebp2, and CCAAT enhance binding protein alpha (cebpa). Genes involved in fatty acid synthesis were highly increased at 0.2% ethanol condition. The expression of (acc1) fatty acid synthase (fasn) that produces palmitic acid from acetyl-CoA and malonyl-CoA was increased, a diglyceride acyltransferase 2 (dgat2) that catalyzes the formation of triglycerides from fatty acid and diacylglycerol was elevated after ethanol treatment. We also investigated the expression of genes associated with lipid uptake in the liver. Additionally, we found the expression of low-density lipoprotein receptor (ldlr) and lipoprotein lipase (lpl) genes were elevated after ethanol treatment, which suggested increased ethanol-induced lipid uptake in the liver. Moreover, ethanol-induced carnitine palmitoyl transferase (cpt1) expression suggested that ethanol treatment increased fatty acid transport into the mitochondria, possibly leading to increased fatty acid β-oxidation. Further, ethanol-induced liver steatosis was confirmed by oil-red O staining and quantification of triacylglycerides in the liver (Fig. 2A, B). We found a 2-fold increase in total triglyceride at the 0.1% ethanol treatment condition and 3-fold increase at the 0.2% ethanol treatment condition in the liver. Thus, low dose chronic ethanol treatment in adult zebrafish recapitulated increased lipid metabolism and steatosis phenotype in ALD.
Figure 2.
Chronic ethanol treatment induced steatosis in the liver of adult zebrafish. (A) The relative mRNA expression of genes associated with lipid metabolism include lipogenic transcription factors, lipid synthesis, lipid uptake, and fatty acid transporting into the mitochondria. (B) Oil red O staining the section of liver in untreated control (left) and 0.2% ethanol treated wild type zebrafish. Scale bar=50 μm. (C) The quantification of triglycerides in the liver of control and ethanol treated zebrafish. Error bars indicate standard deviation of the mean. * p<0.05, ** p<0.005.
Ethanol treatment increased transcription of genes associated with superoxide formation oxidative stress response.
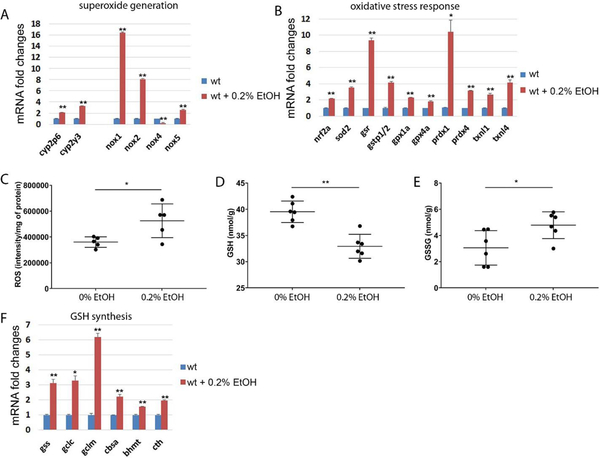
Chronic ethanol consumption is well known to increase reactive oxygen species (ROS) and ROS mediated oxidative stress in the liver [12, 13], which can be a major stress causing hepatic injury. To address whether chronic ethanol treatment can induce oxidative stress in the liver of zebrafish, we analyzed mRNA expression of genes directly associated with superoxide formation and oxidative stress response. We found that ethanol treatment significantly increased expression of NADPH oxidases (nox1, nox2, and nox5), responsible for production of superoxide, while decreased nox4, responsible for basal hydrogen-peroxide production in the liver (Fig. 4A). Thus, we speculated that chronic ethanol treatment in zebrafish might elevate the superoxide level in the liver. Elevated level of mitochondrial superoxide dismutase (sod2) mRNA expression (Fig. 4B) could be induced by superoxide accumulation in the liver. The increase of sod2 expression may result in an accumulation of hydrogen peroxide, leading to increased oxidative stress in the liver. The nuclear factor erythroid 2-like 2 (nrf2), the master regulator of anti-oxidative response, showed a significant increase of expression. Because increased oxidative stress triggers transcriptional activation of genes associated with oxidative stress response, we analyzed two main systems governing cellular redox reactions: the glutathione system and the thioredoxin system (Fig. 4B). The glutathione reductase (gsr), glutathione S transferase pi 1/2 (gstp1/2), and glutathione peroxidase 1a/4a (gpx1a, gpx4a) expressions were highly elevated after ethanol treatment. Moreover, we detected a transcriptional activation of peroxiredoxin 4 (prdx4) and thioredoxin-like 1/4 (txnl1, txnl4), in the thioredoxin system after ethanol treatment.
Figure 4.
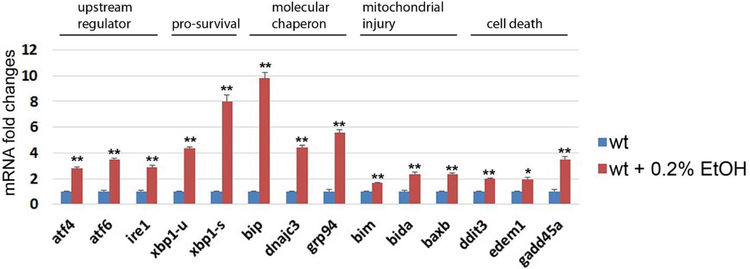
Low dose of ethanol treatment induced genes in UPR/ER stress in the liver of zebrafish. Error bars indicate standard deviation of the mean. * p<0.05, ** p<0.005.
ROS quantification result showed that ethanol elevated ROS in the liver (Fig. 4C). Furthermore, we found significant decrease in GSH and increase in GSH/GSSG ratio after ethanol exposure, which suggesting oxidative stress may plays key role in liver pathogenesis in adult zebrafish (Fig. 4D and E). Genes associated with GSH synthesis were highly elevated possibly to compensate decreased GSH by chronic ethanol exposure (Fig. 4F).
Ethanol treatment induced expression of genes associated with ER stress/unfolded protein response (UPR) in the liver.
Alcohol-induced ER stress its role in organ injuries have been well-studied [14, 15]. To determine whether chronic ethanol treatment induces ER stress in zebrafish, we determined the mRNA expression of multiple genes associated with ER stress-mediated unfolded protein response (UPR) in each untreated control and in ethanol treated siblings (Fig. 4). We found that ethanol treatment increased expression of genes in UPR/ER stress including upstream regulator of UPR response, activating transcription factor 4 (atf4), inositol-requiring enzyme 1 (ire1) and activating transcription factor 6 (atf6). The Ire1 functions as an endonuclease to splice x-box binding protein 1 (xbp1), resulting in increased spliced form of xbp1 (xbp1-s). We found ethanol treatment increased expression of un-spliced form of xbp1 (xbp1-u) as well as spliced form of xbp1 (xbp1-s). its target gene The inositol-requiring enzyme 1 (ire1). We also found significant increased mRNA expression in molecular chaperons that help protein folding including binding immunoglobulin protein (bip), DnaJ homolog subfamily C member 3 (dnajc3), and glucose-regulated protein 94 (grp94). Additionally, Bcl2 interacting mediator of cell death (bim), BH3-interacting domain death agonist a (bida), and Bcl2 associated x b (baxb) were upregulated by ethanol treatment; those genes were known to be activated by ER stress and to induce apoptosis through mitochondrial injury [16, 17]. Furthermore, we found the downstream targets of activating transcription factor 6 (atf6) associated with ER stress-induced cell death were significantly increased after chronic ethanol exposure, which include DNA damage-inducible transcript 3 (ddit3), ER degradation-enhancing alpha-mannosidase-like 1 (edem1) and growth arrest and DNA-damage-inducible 45 alpha (gadd45a). Thus, low dose chronic ethanol treatment increased expression of genes associated with the ER stress and UPR in the zebrafish liver, which suggests that elevated ER stress plays a key role in ethanol-induced liver injury in adult zebrafish, same as in people with ALD.
Ethanol treatment altered gene expression in glucose metabolism and pentose phosphate pathway in the liver.
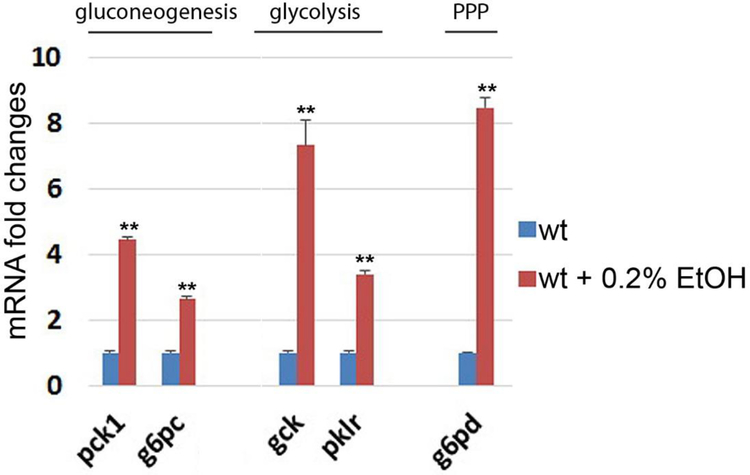
To understand changes of glucose metabolism after chronic ethanol consumption, we quantified mRNA expression of key enzymes in the gluconeogenesis (pck1, g6pc) and glycolysis pathways (gck, pklr). We found that all genes in both glucose metabolic pathways were significantly elevated by chronic ethanol treatment (Fig. 5). Activation of the gluconeogenesis and glycolysis pathway may increase the amount of glucose 6-phosphate in the liver. Because glucose 6-phosphate is the substrate for the initial step of pentose phosphate pathway (PPP), we analyzed the mRNA expression of glucose-6-phosphate dehydrogenase (g6pd), the initial enzyme in the PPP, after ethanol treatment. We found a significant increase in g6pd mRNA expression in the liver (Fig. 5).
Figure 5.
Ethanol treatment induced transcriptional activation of genes in gluconeogenesis, glycolysis, and pentose phosphate pathway in the liver of zebrafish. Relative mRNA expression of phosphoenolpyruvate carboxykinase 1 (pck1), glucose-6-phosphatase catalytic subunit (g6pc), glucokinase (gck), pyruvate kinase L/R (pklr) and glucose-6-phosphate dehydrogenase (g6pd). Error bars indicate standard deviation of the mean. * p<0.05, ** p<0.005.
Discussion
A rodent model of ALD has been used for decades, employing ad libitum feeding with the Lieber-DeCarli liquid diet containing ethanol [18, 19]. However, this diet in a rodent model could only induce mild steatosis without fibrosis after alcohol feeding for up to 9 months [18, 19], although blood ethanol levels reached to 0.1 to 0.15%, which is close to normal drunken state in human. To recapitulate alcoholic liver injury, the NIAAA model in mice combines chronic ethanol feeding and binge drinking [20]; however the condition of binge drinking is an extreme condition of alcohol overdose; 2 ml of 30% ethanol gavage per 100 g equals to immediate drinking of 1.2 liter of 30% liquor for a person weighing 60 kg. Thus, the NIAAA model may not represent condition of chronic ALD. To investigate alcoholic liver disease using zebrafish, previous studies have used zebrafish larvae [21–24]. However, because of the significant difference in age, results from larvae may not accurately recapitulate the human condition of alcoholism. We have shown herein that low dose chronic ethanol treatment was enough to cause ethanol-induced hepatic steatosis and injury in adult zebrafish. We used 0.2% ethanol treatment conditions, which is close to the blood ethanol concentration observed in continual drinkers. Consequently, we found a significant increase of hepatic injury indicated by the accumulation of ballooned hepatocytes and an increase of serum ALT (Fig. 1A and B). In a previous study using 1% ethanol exposure condition in adult zebrafish showed that long-term ethanol exposure induced fibrosis in the liver. However, we found early stage mild fibrosis in the liver after 4 weeks of 0.2% ethanol treatment and it was not consistent in all ethanol exposed groups (Fig. 1A). We believe that it was due to relatively shorter period of ethanol exposure compared to the previous paper. However, starvation might affect fibrotic phenotype in 1% ethanol exposure model, because we noticed that adult zebrafish barely ate foods with 1% ethanol exposure condition. As we found 0.2% ethanol exposure did not affect appetite during ethanol treatment period, our model might be more relevant to the condition of chronic ALD. Additionally, we investigated whether low dose chronic ethanol treatment can mimic hyperglycemia and hyperlipidemia that are frequently observed in ALD patients [25–27], and which cannot be addressed in a zebrafish larvae model. Our blood sample analysis after ethanol treatment showed a significant increase in serum glucose, triacylglycerides and ALT levels. Thus, our adult zebrafish model mimics both pathological and metabolic changes of ALD under the low dose ethanol exposure condition.
Comprehensive gene expression analysis by qPCR showed that low dose chronic ethanol treatment induced transcriptional activation of genes associated with lipid metabolism including lipogenic transcription factors, lipid synthesis and lipid uptake, which can be a main cause of steatosis. Increased mitochondrial β-oxidation activity and transcriptional activation of NAPDH oxidases (nox1, nox2 and nox5) by chronic ethanol treatment could increase superoxide formation and lead to elevation of oxidative stress in the liver. In addition, we found that chronic ethanol treatment in zebrafish activated key genes in both gluconeogenesis (pck1 and g6pc) and glycolysis (gck and pklr), which may result in an accumulation of glucose 6 phosphate in the liver. Importantly, glucose 6 phosphate is the substrate of g6pd in the pentose phosphate pathway, which can provide NAPDH within cells. We also found an increase of g6pd expression in the liver. This result suggests that ethanol treatment may alter glucose metabolism to accelerate the activity of the pentose phosphate pathway and result in increase of NADPH. Because NADPH is used in fatty acid synthesis and required for the activity of cellular anti-oxidation systems such as the glutathione and thioredoxin systems as the key cofactor [28, 29], chronic ethanol treatment may enhance glucose metabolism to maximize NADP production. Thus, our results suggest that ethanol treatment may activate the pentose phosphate pathway to support fatty acid synthesis and to protect oxidative stress in the liver.
In addition, chronic alcohol consumption has been known to cause hyperhomocysteinemia in the liver, which can induce ER stress mediated hepatic injury and steatosis [30–33]. As we have shown here, adult zebrafish exhibited a significant increase of gene expression associated with ER stress.
In conclusion, adult zebrafish under low dose chronic ethanol exposure recapitulated pathological, metabolic, and stress responses very well that have been observed in people with ALD. Thus, our adult zebrafish model of ALD can be an alternative animal model to study chronic liver disease in humans.
Supplementary Material
Figure 3.
Ethanol treatment in adult zebrafish activated genes associated with superoxide, hydrogen peroxide generation and regulation of redox balance in the liver. (A) Ethanol exposure increased relative mRNA expression in cyp2p6, cyp2y3, nox1, nox2 and nox5 in the liver. (B) Relative mRNA expression of nrf2, sod2 and genes associated with redox balance. (C) ROS quantification, (D) GSH level and (E) GSH/GSSG ratio were measured in the liver of control and 0.2% ethanol exposed groups. (F) Relative mRNA expression of genes associated with GSH synthesis including glutathione synthase (gss), glutamate-cysteine ligase, catalytic subunit (gclc), glutamate-cysteine ligase, modifier subunit (gclm), cystathionine b-synthase a (cbsa), betaine--homocysteine S-methyltransferase (bhmt). Error bars indicate standard deviation of the mean. * p<0.05, ** p<0.005.
Highlights.
Adult zebrafish as a model of chronic alcoholic liver disease
Ethanol exposure in zebrafish mimics pathological and metabolic changes in ALD
Acknowledgements/grant support
We thank Dr. Ye and Dr. Zhang at the Analytical Redox Biochemistry Core at MUSC for thiol, GSH, and GSSG determination. This work was supported by National Institutes Health (General Medical Sciences Grants P20GM103542-COBRE in Oxidants, Redox Balance, and Stress Signaling). The authors declare no conflicts of interest.
Abbreviations
- ALD
Alcoholic liver disease
- ALT
alanine aminotransferase
- ROS
reactive oxygen species
- UPR
unfolded protein response
Footnotes
Publisher's Disclaimer: This is a PDF file of an unedited manuscript that has been accepted for publication. As a service to our customers we are providing this early version of the manuscript. The manuscript will undergo copyediting, typesetting, and review of the resulting proof before it is published in its final citable form. Please note that during the production process errors may be discovered which could affect the content, and all legal disclaimers that apply to the journal pertain.
References
- [1].Gao B, Bataller R, Alcoholic liver disease: pathogenesis and new therapeutic targets, Gastroenterology 141(5) (2011) 1572–85. [DOI] [PMC free article] [PubMed] [Google Scholar]
- [2].O’Shea RS, Dasarathy S, McCullough AJ, Practice D Guideline Committee of the American Association for the Study of Liver, G. Practice Parameters Committee of the American College of, Alcoholic liver disease, Hepatology 51(1) (2010) 307–28. [DOI] [PubMed] [Google Scholar]
- [3].Stickel F, Seitz HK, Alcoholic steatohepatitis, Best Pract Res Clin Gastroenterol 24(5) (2010) 683–93. [DOI] [PubMed] [Google Scholar]
- [4].Lin JN, Chang LL, Lai CH, Lin KJ, Lin MF, Yang CH, Lin HH, Chen YH, Development of an Animal Model for Alcoholic Liver Disease in Zebrafish, Zebrafish 12(4) (2015) 271–80. [DOI] [PubMed] [Google Scholar]
- [5].Schneider AC, Gregorio C, Uribe-Cruz C, Guizzo R, Malysz T, Faccioni-Heuser MC, Longo L, da Silveira TR, Chronic exposure to ethanol causes steatosis and inflammation in zebrafish liver, World J Hepatol 9(8) (2017) 418–426. [DOI] [PMC free article] [PubMed] [Google Scholar]
- [6].Phukan JP, Sinha A, Deka JP, Serum lipid profile in alcoholic cirrhosis: A study in a teaching hospital of north-eastern India, Niger Med J 54(1) (2013) 5–9. [DOI] [PMC free article] [PubMed] [Google Scholar]
- [7].Carr RM, Correnti J, Insulin resistance in clinical and experimental alcoholic liver disease, Ann N Y Acad Sci 1353 (2015) 1–20. [DOI] [PMC free article] [PubMed] [Google Scholar]
- [8].Park K-H, Ye Z.-w., Zhang J, Hammad SM, Townsend DM, Rockey DC, Kim S-H, 3-ketodihydrosphingosine reductase mutation induces steatosis and hepatic injury in zebrafish, Scientific Reports 9(1) (2019) 1138. [DOI] [PMC free article] [PubMed] [Google Scholar]
- [9].Manevich Y, Hutchens S, Tew KD, Townsend DM, Allelic variants of glutathione S-transferase P1–1 differentially mediate the peroxidase function of peroxiredoxin VI and alter membrane lipid peroxidation, Free Radic Biol Med 54 (2013) 62–70. [DOI] [PMC free article] [PubMed] [Google Scholar]
- [10].Chait A, Mancini M, February AW, Lewis B, Clinical and metabolic study of alcoholic hyperlipidaemia, Lancet 2(7767) (1972) 62–4. [DOI] [PubMed] [Google Scholar]
- [11].Ben G, Gnudi L, Maran A, Gigante A, Duner E, Iori E, Tiengo A, Avogaro A, Effects of chronic alcohol intake on carbohydrate and lipid metabolism in subjects with type II (non-insulin-dependent) diabetes, Am J Med 90(1) (1991) 70–6. [DOI] [PubMed] [Google Scholar]
- [12].Thurman RG, Ji S, Lemasters JJ, Alcohol-induced liver injury. The role of oxygen, Recent Dev Alcohol 2 (1984) 103–17. [PubMed] [Google Scholar]
- [13].Cederbaum AI, Lu Y, Wu D, Role of oxidative stress in alcohol-induced liver injury, Arch Toxicol 83(6) (2009) 519–48. [DOI] [PubMed] [Google Scholar]
- [14].Ji C, Mechanisms of alcohol-induced endoplasmic reticulum stress and organ injuries, Biochem Res Int 2012 (2012) 216450. [DOI] [PMC free article] [PubMed] [Google Scholar]
- [15].Ji C, New Insights into the Pathogenesis of Alcohol-Induced ER Stress and Liver Diseases, Int J Hepatol 2014 (2014) 513787. [DOI] [PMC free article] [PubMed] [Google Scholar]
- [16].Kodama T, Hikita H, Kawaguchi T, Saito Y, Tanaka S, Shigekawa M, Shimizu S, Li W, Miyagi T, Kanto T, Hiramatsu N, Tatsumi T, Takehara T, The Bcl-2 homology domain 3 (BH3)-only proteins Bim and bid are functionally active and restrained by anti-apoptotic Bcl-2 family proteins in healthy liver, J Biol Chem 288(42) (2013) 30009–18. [DOI] [PMC free article] [PubMed] [Google Scholar]
- [17].Lindsay J, Esposti MD, Gilmore AP, Bcl-2 proteins and mitochondria--specificity in membrane targeting for death, Biochim Biophys Acta 1813(4) (2011) 532–9. [DOI] [PubMed] [Google Scholar]
- [18].Lieber CS, DeCarli LM, The feeding of alcohol in liquid diets: two decades of applications and 1982 update, Alcohol Clin Exp Res 6(4) (1982) 523–31. [DOI] [PubMed] [Google Scholar]
- [19].Lieber CS, Jones DP, Mendelson J, DecCarli LM, Fatty liver, hyperlipemia and hyperuricemia produced by prolonged alcohol consumption despite adequate dietary intake, Trans Ass Amer Physicians 76 (1963) 289–300. [Google Scholar]
- [20].Bertola A, Mathews S, Ki SH, Wang H, Gao B, Mouse model of chronic and binge ethanol feeding (the NIAAA model), Nat Protoc 8(3) (2013) 627–37. [DOI] [PMC free article] [PubMed] [Google Scholar]
- [21].Dai W, Wang K, Zheng X, Chen X, Zhang W, Zhang Y, Hou J, Liu L, High fat plus high cholesterol diet lead to hepatic steatosis in zebrafish larvae: a novel model for screening anti-hepatic steatosis drugs, Nutr Metab (Lond) 12 (2015) 42. [DOI] [PMC free article] [PubMed] [Google Scholar]
- [22].Passeri MJ, Cinaroglu A, Gao C, Sadler KC, Hepatic steatosis in response to acute alcohol exposure in zebrafish requires sterol regulatory element binding protein activation, Hepatology 49(2) (2009) 443–52. [DOI] [PMC free article] [PubMed] [Google Scholar]
- [23].Jang ZH, Chung HC, Ahn YG, Kwon YK, Kim JS, Ryu JH, Ryu DH, Kim CH, Hwang GS, Metabolic profiling of an alcoholic fatty liver in zebrafish (Danio rerio), Mol Biosyst 8(7) (2012) 2001–9. [DOI] [PubMed] [Google Scholar]
- [24].Tsedensodnom O, Vacaru AM, Howarth DL, Yin C, Sadler KC, Ethanol metabolism and oxidative stress are required for unfolded protein response activation and steatosis in zebrafish with alcoholic liver disease, Dis Model Mech 6(5) (2013) 1213–26. [DOI] [PMC free article] [PubMed] [Google Scholar]
- [25].Andersen BN, Hagen C, Faber OK, Lindholm J, Boisen P, Worning H, Glucose tolerance and B cell function in chronic alcoholism: its relation to hepatic histology and exocrine pancreatic function, Metabolism 32(11) (1983) 1029–32. [DOI] [PubMed] [Google Scholar]
- [26].Leggio L, Ray LA, Kenna GA, Swift RM, Blood glucose level, alcohol heavy drinking, and alcohol craving during treatment for alcohol dependence: results from the Combined Pharmacotherapies and Behavioral Interventions for Alcohol Dependence (COMBINE) Study, Alcohol Clin Exp Res 33(9) (2009) 1539–44. [DOI] [PMC free article] [PubMed] [Google Scholar]
- [27].Mendelson JH, Mello NK, Alcohol-induced hyperlipidemia and beta lipoproteins, Science 180(4093) (1973) 1372–4. [DOI] [PubMed] [Google Scholar]
- [28].Ren X, Zou L, Zhang X, Branco V, Wang J, Carvalho C, Holmgren A, Lu J, Redox Signaling Mediated by Thioredoxin and Glutathione Systems in the Central Nervous System, Antioxid Redox Signal 27(13) (2017) 989–1010. [DOI] [PMC free article] [PubMed] [Google Scholar]
- [29].Marty L, Siala W, Schwarzlander M, Fricker MD, Wirtz M, Sweetlove LJ, Meyer Y, Meyer AJ, Reichheld JP, Hell R, The NADPH-dependent thioredoxin system constitutes a functional backup for cytosolic glutathione reductase in Arabidopsis, Proc Natl Acad Sci U S A 106(22) (2009) 9109–14. [DOI] [PMC free article] [PubMed] [Google Scholar]
- [30].Werstuck GH, Lentz SR, Dayal S, Hossain GS, Sood SK, Shi YY, Zhou J, Maeda N, Krisans SK, Malinow MR, Austin RC, Homocysteine-induced endoplasmic reticulum stress causes dysregulation of the cholesterol and triglyceride biosynthetic pathways, J Clin Invest 107(10) (2001) 1263–73. [DOI] [PMC free article] [PubMed] [Google Scholar]
- [31].Blasco C, Caballeria J, Deulofeu R, Lligona A, Pares A, Lluis JM, Gual A, Rodes J, Prevalence and mechanisms of hyperhomocysteinemia in chronic alcoholics, Alcohol Clin Exp Res 29(6) (2005) 1044–8. [DOI] [PubMed] [Google Scholar]
- [32].Kaplowitz N, Ji C, Unfolding new mechanisms of alcoholic liver disease in the endoplasmic reticulum, J Gastroenterol Hepatol 21 Suppl 3 (2006) S7–9. [DOI] [PubMed] [Google Scholar]
- [33].Ji C, Mehrian-Shai R, Chan C, Hsu YH, Kaplowitz N, Role of CHOP in hepatic apoptosis in the murine model of intragastric ethanol feeding, Alcohol Clin Exp Res 29(8) (2005) 1496–503. [DOI] [PMC free article] [PubMed] [Google Scholar]
Associated Data
This section collects any data citations, data availability statements, or supplementary materials included in this article.


