Abstract
We couple a tumor growth model embedded in a microenvironment, with a bio distribution model able to simulate a whole organ. The growth model yields the evolution of tumor cell population, of the differential pressure between cell populations, of porosity of ECM, of consumption of nutrients due to tumor growth, of angiogenesis, and related growth factors as function of the locally available nutrient. The bio distribution model on the other hand operates on a frozen geometry but yields a much refined distribution of nutrient and other molecules. The combination of both models will enable simulating the growth of a tumor in a whole organ, including a realistic distribution of therapeutic agents and allow hence to evaluate the efficacy of these agents.
Keywords: Modeling, multiphase, biodistribution, code coupling, angiogenesis, smearded finite element
1. Introduction
Cancer is an extraordinarily complex disease. It is now recognized that methods commonly used in physics can help reducing the complexity of cancer to a manageable set of underlying principles and phenomena (Michor et al. 2011; Moore et al. 2011). Among the fields to which oncophysics can contribute belong the evolution and evolutionary theory of cancer, information coding and transfer in cancer, deconvolution of cancer complexity, and transport oncophysics. Transport oncophysics views cancer as a disease of multiscale mass transport dysregulation involving biological barriers. In fact each one of us is the sum of a multiplicity of transport differentials (i.e., gradients of metabolites, chemotherapy, oxygen) between cellular compartments (e.g., DNA, organelles, cytosol, cellular membranes, extracellular matrix, and vasculature) and these multiscale mass transport differentials distinguish malignant from normal cells and tissues (Koay and Ferrari 2014). Understanding the disorganization of these differentials in cancer opens a realm of possibilities in all aspects of oncological research. Transport aspects further control delivery of therapeutic agents (e.g. chemotherapeutics or molecularly targeted therapeutics such as T cells, antibodies, particles) which must pass through different and heterogeneous tumor and healthy compartments (e.g. vascular, stroma) with distinct physical properties (Ferrari 2013; Ferrari 2010). Delivery of drugs is an extremely complex procedure involving different spatial and temporal scales and taking place over several levels ranging from the organism to the intercellular environment. The underlying transport phenomena at individual tumor compartments may act as transport barriers possibly contributing to poor survival rates in cancer therapy (Ferrari 2013; Freyer et al. 1997).
In this paper we address a computational tool necessary for simulating simultaneously different aspects involved in transport oncophysics: tumor growth within the local tumor environment including angiogenesis, and bio distribution of nutrients, interstitial fluid flow and blood flow in the vasculature. This tool, together with imaging, analysis and quantification, will help to understand and predict cancer development and the efficacy of therapy, with the aim to design patient specific solutions for this complex disease.
Before presenting our tumor growth model we recall that the most advanced computational models for tumor growth prediction belong mainly to two types: multi-parameter and multi-phase models. Multi-parameter models are based on mixture theory (Cowin and Cardoso 2012) where the relevant balance equations are written directly at the level of interest and the thermodynamic consistency is satisfied at the same level. The evolution of phases and species within multi-parameter models is obtained either by use of phase field approach (Hawkins-Daarud et al. 2013; Lima et al. 2016; Lima et al. 2015; Oden et al. 2016; Oden et al. 2013; Oden et al. 2010; Rahman et al. 2017; Rocha et al. 2018; Vilanova et al. 2018) or of Volterra-Lotta (predator/prey like) equations (Carotenuto et al. 2018; Fraldi and Carotenuto 2018). Recent multiphase models (Kremheller et al. 2018; Sciumè et al. 2014a; Sciumè et al. 2013) are based on the Thermodynamically Constrained Averaging Theory (TCAT) (Gray and Miller 2014) where the model derivation proceeds systematically from known microscale relations to mathematically and physically consistent larger scale relations. This is accomplished by the use of averaging theorems. The thermodynamic analysis is consistent between scales, in the definitions of variables at different scales and in satisfying the entropy inequality. The closure relationships are obtained from a Simplified Entropy Inequality (SEI). Interfaces between constituents arise naturally from the solution of an initial-boundary value problem that must comprise the mass balance equations of all phases involved.
Our model is of the multiphase type with a deformable solid matrix (ECM) pervaded by three fluid phases, tumor cells (TCs), healthy cells (HCs) and interstitial fluid (IF),(Santagiuliana et al. 2016; Sciumè et al. 2014a; Sciumè et al. 2014b; Sciumè et al. 2013). In this model the extracellular matrix is a porous solid which may undergo remodeling and the fluid phases fill its pores. Tumor cells partition into living cells and necrotic cells. Healthy cells are in homeostasis. The IF transports chemical species such as nutrients, oxygen, signaling molecules like Tumor Angiogenic Factor (TAF), cytokines, etc.. Transport within extravascular space takes place by convection and diffusion. The model is able to simulate growth, hypoxia, necrosis and lysis of the TCs, migration of cells through the ECM, invasion and infiltration of the TCs into the healthy tissue, different stiffness of cell population with respect to the ECM, deposition and remodeling of ECM, build-up of cortical tension between HCs and TCs, adhesion of the cells to their ECM as well as adhesion among cells, and possible detachment. Angiogenesis is modeled as follows (Santagiuliana et al. 2016): when the oxygen mass fraction is lower than a critical value the tumor living cells produce TAF in response to hypoxia. TAF diffuses in the surrounding tissue and creates a chemical gradient between the tumor and any existing vasculature. Endothelial cells (ECs), lining the blood vessels, respond to the TAF. In our model endothelial cells are a species transported in the IF, which diffuse following their own gradient and that of TAF. The density of endothelial cells represents the concentration of capillary sprouts formed by accumulation of endothelial cells which are recruited from the parent vessel. This smeared representation of the neovasculature is an ideal intersection with the bio distribution model described next. The choice of a smeared representation instead of a discrete one is justified by the fact that the neovasculature is extremely chaotic and that there is no relationship between vessel diameter and flow velocity (Dewhirst and Secomb 2017; Discher et al. 2005).
The model for the bio distribution introduced by the group of Prof. Kojic, developed at the Houston Methodist Research Institute and Bioengineering R&D Center Bioirc in Serbia, simulates the diffusion of molecules, oxygen, and the smeared capillary network in the tumor environment. The basic idea of the smeared concept consists in: 1) transformation of the 1D mass transport into the equivalent continuum form; 2) use of a standard continuum representation with the pressure and concentration fields within the particular domains of the composite finite elements; and 3) formulation of connectivity finite elements for membrane (capillary and cell walls) transport (Kojic et al. 2018; Kojic et al. 2017a; Kojic et al. 2017b; Milosevic et al. 2018). The composite smeared finite element (CSFE) includes continuum domains occupying the corresponding volume fraction and also connectivity elements at each node. This concept simplifies the model generation of complex biological media, including tumors, and still provides satisfactory accuracy, particularly investigated in (Milosevic et al. 2018).
In sections 2 we recall briefly the governing equations of the tumor growth and in section 3 the basic relations of the CSFE formulation. Section 4 deals with the coupling of both models including operational aspects. The results are reported in section 5 where two simulations are shown: the first one is a 2D example of a tumor growing within a square domain, and the second one deals with melanoma growth in an axisymmetric setting. Finally the conclusions highlight the capability of the new code achieved by the connection of two original models.
2. The tumor growth model: the governing equations
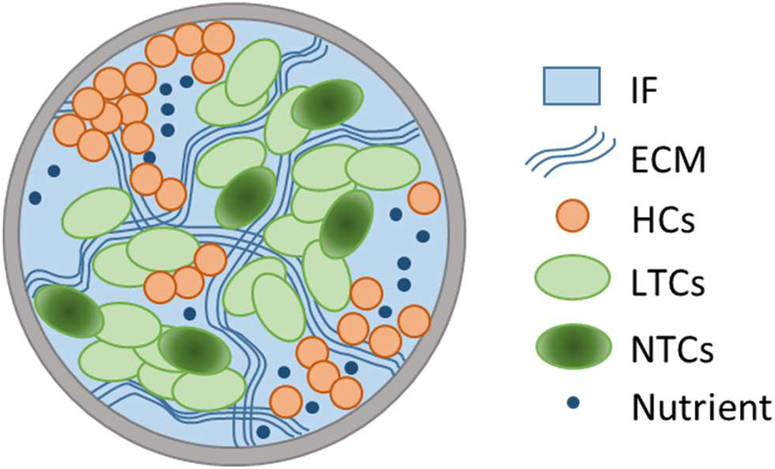
The tumor growth model is a continuum model where the TCs and HCs are presented as ”adhesive” fluids within a porous matrix (ECM). TCs may become necrotic upon exposure to low nutrient concentrations or excessive mechanical stresses. The HCs are in homeostasis. The IF is an aqueous solution of biological molecules, cell nutrients, oxygen and waste products and the Representative Elementary Volume (REV) is schematically shown in Fig. 1.
Fig. 1.
Representative Elementary Volume (REV)
As already mentioned the model is built within the TCAT framework which is used to transform known microscale relations to mathematically and physically consistent macroscale relations by using averaging theorems (Gray and Miller 2014; Gray et al. 2013). These relations are adequate and sufficient to describe tumor development while filtering out high frequency spatial variability. The governing equations of the model are closed by introducing constitutive relations in the macroscale equations.
The ECM is a deformable porous solid with porosity ε. The volume fraction of the solid phase is εs =1− ε. The other phases, tumor cells (εt), healthy cells (εh) and interstitial fluid (εl), occupy the rest of the volume. The volume fractions for all phases add up to unity
| (1) |
The saturation degree of a fluid phase α is: Sα=εα/ε. Using porosity, ε, and volume fraction, εα, (1) yields
| (2) |
The macroscopic mass and momentum balance equations of phases and species have been derived in (Sciumè et al. 2013) and their transformation to take the differential pressures as primary variables has been obtained in (Sciumè et al. 2014a). The model has been enhanced in (Santagiuliana et al. 2015) to include ECM deposition by the tumor cells through new mass exchange terms, , and lysis, .
Below the general form of the governing equations for each phase is shown. ρα is the density and vα is the velocity of the phase α, see Appendix A of (Sciumè et al. 2014a), while the v s is the velocity of the solid phase (ECM) that is the time derivative of the solid phase (ECM) displacements u s. The final form of the governing equations is then obtained from the general forms by introducing some simplifications and closure relationships such as a generalized Darcy’s equation for flow of the fluid phases (Santagiuliana et al. 2016; Sciumè et al. 2013).
The mass balance equation of the ECM is
| (3) |
The mass balance equation of TCs reads
| (4) |
where is an inter-phase exchange of mass between the phases l and t, and represents the mass of IF consumed by tumor cell growth.
The mass balance equation of HCs is
| (5) |
There are no mass exchange terms in eq. (5) because the HCs are in homeostasis.
The mass balance equation of IF reads
| (6) |
where the mass exchange terms are the opposite of those seen in previous equations.
Similar are the mass balance equations for the species, presented below. Remind that the tumor cells are a phase composed of two species, the viable tumor cells and the necrotic ones. The governing equation for necrotic cells is
| (7) |
where ωNt is the mass fraction of TCs, εtrNt is a reaction term, that is the death rate of tumor cells or rate of generation of necrotic cells. takes into account of mass exchange between the necrotic tumor cells and the IF phase due to lysis.
The mass balance equation of the nutrient, by including a Fickian type equation for the diffusion of species, reads
| (8) |
where is the effective diffusivity of the nutrient species in the extracellular space, ωnl the mass fraction of nutrient species n and is the mass of nutrient consumed by tumor cells via metabolism and growth.
The other species considered are TAF and ECs. Since we have only four phases at disposal in Castem (the code referenced below), we model the endothelial cells as a transported species in the IF (Santagiuliana et al. 2016). The respective mass balance equations are
| (9) |
and
| (10) |
where and are the effective diffusivity of the TAF and ECs in the extracellular space, ωTAF and ωEC the mass fractions of TAF and ECs.
The last governing equation is the linear momentum balance of the solid phase expressed in rate form as
| (11) |
where the interaction between the solid and the three fluid phases is accounted for through the effective stress in the sense of porous media mechanics
| (12) |
1 is the unit tensor, is the total stress tensor in the solid phase, is the Biot’s coefficient , with K the compressibility of the empty ECM. In the modeled problem, K/Ks tends to zero hence we can assume a Biot’s coefficient equal to 1. The solid pressure ps is given as in (Gray and Schrefler 2007)
| (13) |
where the Bishop parameter of each fluid phase (solid surface fraction in contact with the phase) has been taken equal to its own degree of saturation; pt, ph, pl are respectively the tumor cells pressure, the host cells pressure and the interstitial fluid pressure; phl and pth are the pressure differences between, respectively, host cells and interstitial fluid, and tumor cells and host cells. A large deformation regime is assumed for the elasto-visco-plastic ECM (solid phase).
The governing equations have been introduced in the finite elements code CAST3M or Castem (http://www-cast3m.cea.fr) of the French Atomic Energy Commission.
3. Coupling diffusion within capillary and tissue
We summarize now the methodology, which will be further used as the basis for the development of the composite smeared finite element to model diffusion within capillary network and tissue.
We write the balance equation for diffusion in a form used in our smeared formulation. Hence, according to equation (8) we have
| (14) |
where Dij are diffusion tensor coefficients ( of a nutrient in extracellular space in (8))
Considering the diffusive transport through the wall, a 1D linear approximation for radial diffusion will be used, since the vessel wall thickness is small with respect to the vessel radius. The mass balance equation has the following form,
| (15) |
where Dwall is the capillary wall diffusive coefficient; convection through the wall is neglected which in reality is small. Mass transport through capillary walls does not have a mass exchange term because we assume that consumption is present in the tissue domain but not in capillary walls. For simplicity of writing, consistent with the references related to the smeared concept, we will further use c ≡ ωnl as the nutrient (oxygen) mass fraction called also concentration.
We further assume that concentration within capillaries is uniform and given as the systemic concentration Csys(t) function of time. This assumption can be taken as a reasonable approximation when considering a small tissue domain, e.g. a tumor, because convection within capillaries is a much faster process than the convection-diffusion within tissue.
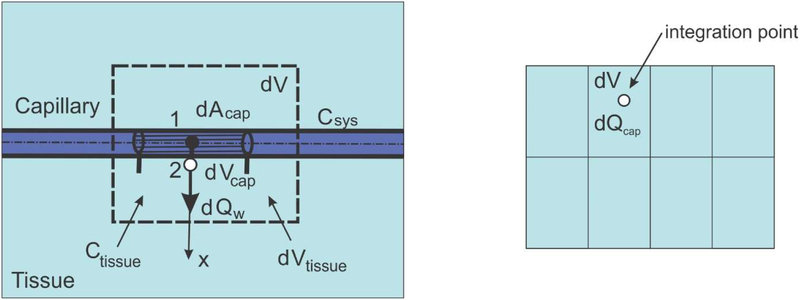
Consider diffusion through a capillary wall as schematically shown in Fig. 2. First, the elementary area of the surface of the internal wall dAcap can be related to the elementary volume dVcap and further to the elementary total volume dV, as follows:
| (16) |
where rAV is the capillary area-to volume ratio (called further surface ratio), and rV is the capillary volumetric (mass) ratio within tissue, or capillary density; the volume of tissue is (1−rv)dV. Note that in case of a straight capillary, the surface ratio is rAV=4/Dcap where Dcap is the capillary internal diameter; in case of complex geometries rAV can be different, and can be evaluated from imaging data. We emphasize that the capillary density is the ratio between the volume occupied by the fluid (blood) and total volume. The above ratios are parameters of the capillary bed. The expression (16) can be considered as the most fundamental one in our smeared models, where the discrete wall surface is smeared over the volume of the continuum.
Fig. 2.
Diffusion from capillary to tissue through elementary capillary wall surface dAcap which corresponds to the capillary volume dVcap and total volume dV; dVtissue is the volume occupied by tissue
Next, we assume that the mass concentration is linearly distributed through the wall thickness (between points 1 and 2 in Fig. 2), which is acceptable for thin capillary walls; this is in accordance with (15). Then, the flux through the wall at point 2, corresponding to the elementary surface dAcap, including partitioning P1 and P2 at the internal and external capillary surface, can be expressed as
| (17) |
where CSyS, , Ctissue, are the concentration in the lumen, and concentration within tissue at the end and start of time step, respectively, and h is the wall thickness. Note that Dwall represents the overall transport coefficient of the wall (with pores, fenestrations, etc.); it can be related to the diffusion coefficient of the wall porous material coefficient Dmaterial as Dwall = h Dmaterial. Partitioning coefficient P is used as a measure of repelling or attraction of molecules at the boundary between two media which produces a discontinuity at the common surface (P=C1/C2 where C1 and C2 are concentrations at two sides of the surface). As can be seen from Figure 2, point 1 is in lumen and point 2 in tissue domain, hence P1 is partitioning at lumen/capillary wall interface, and P2 is partitioning at capillary wall/tissue interface.
We have now the tissue continuum within which capillaries are distributed and are producing the source of mass according to (17). Therefore, the nodal fluxes of a continuum finite element are
| (18) |
where terms within the parenthesis (…) follow from (17), and NI are the continuum interpolation functions of the element with volume V. When evaluating the integral (18), concentration Ctissue is the current concentration within the tissue at an integration point. Note that the factor (1−rV) is used since the volume of tissue is reduced due to presence of capillaries.
Instead of using source terms at FE integration points, connectivity elements can be assigned at each continuum node. Then, the balance equation for the connectivity element at a continuum node I can be written as
| (19) |
where
| (20) |
and CI and are concentrations at node I at end and start of time step, respectively. Also, P1 and P2 are partitioning coefficients as in (17); D(wall)I is the wall diffusion coefficient, hI is the wall thickness at node I; and AcapI is the wall surface area belonging to the node I, which is
| (21) |
with (rV)I, (rAV)I and VI the volumetric ratio, the area coefficient and the volume of the continuum which belongs to the node, respectively. The volume VI can numerically be evaluated as
| (22) |
where summation includes all elements containing the node I. We found that convergence was improved by applying the concept of these connectivity elements at nodes instead of continuously distributed source terms.
It can be concluded from the above that diffusive transport between capillaries and tissue can be performed by discretizing the continuum (tissue) only. The parameters of the model, assigned to each continuum node I include geometrical data (the volumetric ratio of capillaries (rV)I, the surface ratio (rAV)I, the wall thickness (hI)) and material data of capillaries consisting of wall diffusion coefficient (Dwall)I and partition coefficients P1I and P2I at the capillary surfaces. Effects of partitioning are neglected in this study.
4. Coupling the models
4.1. Numerical solution and computational procedure for the tumor growth model
The weak form of the governing equations is obtained by means of the standard Galerkin procedure and is then discretized in space by means of the finite element method. Integration in the time domain is carried out by the Finite Difference Method adopting a quasi-Crank-Nicolson scheme (θ-Wilson method with θ = 0.52). Within each time step the equations are linearized by the Newton-Raphson method.
Five computational units are used in the staggered scheme: the first is for the nutrient mass fraction , the second for the TAF mass fraction , the third is for the endothelial cells mass fraction , the fourth to compute pth, phl and pl, the difference of pressure between TCs and HCs, HCs and IF respectively and the pressure of IF, and the fifth is used to obtain the displacement vector . Within each iteration the mass fraction of NTC, , is updated using (7).
The final system of equations can be expressed in matrix form as follows,
| (23) |
with
| (24) |
where . The nonlinear coefficient matrices Cij(x), Kij(x) and fi(x) are given in (Santagiuliana et al. 2016).
The endothelial cells diffusion dependence on TAF concentration has been taken into account in the code by adding a coupling matrix for the endothelial cells and the TAF as a condition on the diffusion of the endothelial cells.
4.2. Formulation of the smeared finite element to model mass transport in the capillary-tissue system
Here we summarize the basic relations in formulating the composite smeared finite element (CSFE), according to (Kojic et al. 2017a). The basic requirement of the smeared concept for modeling transport within the capillary-tissue system, is that the transport characteristics of the system should appropriately be preserved in the smeared model.
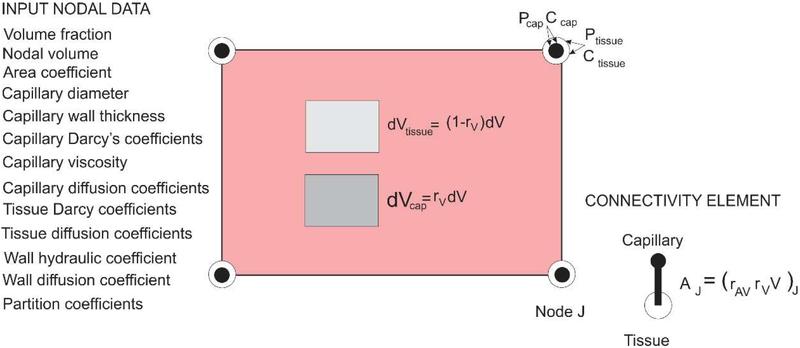
A schematic representation of this element is shown in Fig. 3. The domains and the nodal variables used here are those relevant for this tumor growth model – capillary and tissue, while extension to include different cell groups and intracellular transport with cytosol and organelles (Kojic et al. 2018) is not considered.
Fig. 3.
Composite smeared finite element (CSFE) with capillary and tissue domain and connectivity elements at each node; list of nodal parameters is given in the figure
The capillary network is represented by the fraction rV of the FE volume (mass) and the nodal variables are pressure and concentrations. The fundamental step now is to transform 1D fluid flow and diffusion to the adequate continuum form. This is achieved by introducing the corresponding Darcy and diffusion tensors. The Darcy tensor can be derived in the form (Kojic et al. 2017a)
| (25) |
where dK are capillary diameters, ℓKi are directional cosines, μ is the fluid viscosity, and Atot is the total cross-sectional area of capillaries at a considered spatial point vicinity, . Here, the Hagen-Poisseuile law is assumed for flow within capillaries. Likewise, the diffusion tensor can be expressed as
| (26) |
where DcapK are diffusion coefficients within capillaries and AK are the cross-sectional areas. Therefore, we model the capillary network by a continuum; for convenience and efficiency we first evaluate the continuum volume VJ belonging to each FE node, (22) and use the area-to-volume ratio rAV to evaluate the capillary wall surface AJ needed for nodal connectivity elements. The balance equations for connectivity elements are given by (19). The CSFE is built into our FE code PAK (Kojic et al. 2010).
4.3. Computational procedure for coupling the models
We will use three different modules to couple the models: Castem, CAD, and PAKT. Castem is the FE software for numerical simulation in structural mechanics and other types of scientific problems. CAD is indoor user interface for pre- and post-processing results for the package PAKT, and PAKT (a module of the PAK software package) is the indoor FE solver for concentration field which incorporates the smeared finite element.
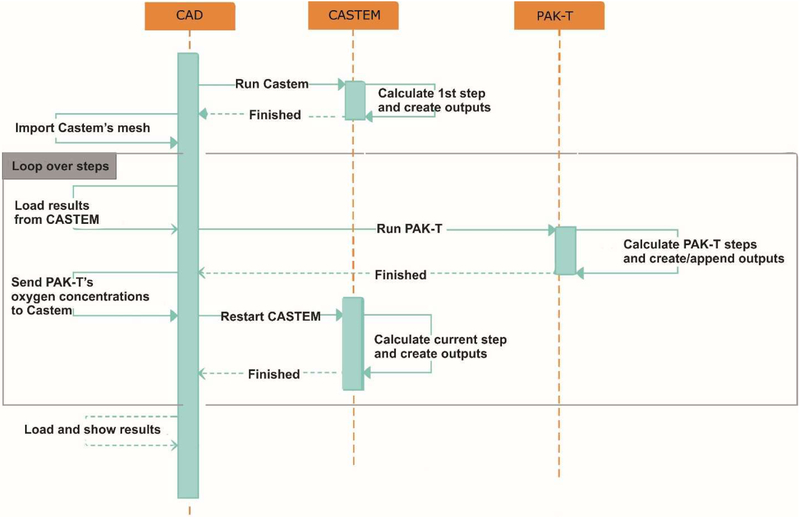
The complete process of coupling the models is shown in the sequence diagram of Fig. 4, and consist of the following steps:
Fig. 4.
Sequence diagram of automated exchange between Castem and PAKT, with using CAD user interface
Run first time step in Castem and create outputs.
Import Castem’s mesh into CAD software.
Load data from Castem into CAD and run PAKT simulation. Data loaded from Castem are: ε, εt, , , , , and pth.
Pick up PAKT oxygen nodal mass fractions (concentrations) and send them to Castem.
If there are no more time steps to calculate go to step 6, otherwise go back to step 3.
Load results into CAD for post-processing.
5. Results
In the next paragraphs two examples of simulations are shown. The first one is a 2D example with an initial circular tumor growing within a squared domain with a blood vessel on a side. The second one is an example of the cutaneous melanoma growth in axial-symmetric conditions. Both simulations are performed with the coupled codes above described CAST3M and PAKT, and are compared with results of the simulations achieved with the code CAST3M only, i.e. just with the tumor growth model.
5.1. Simulation of a 2D example
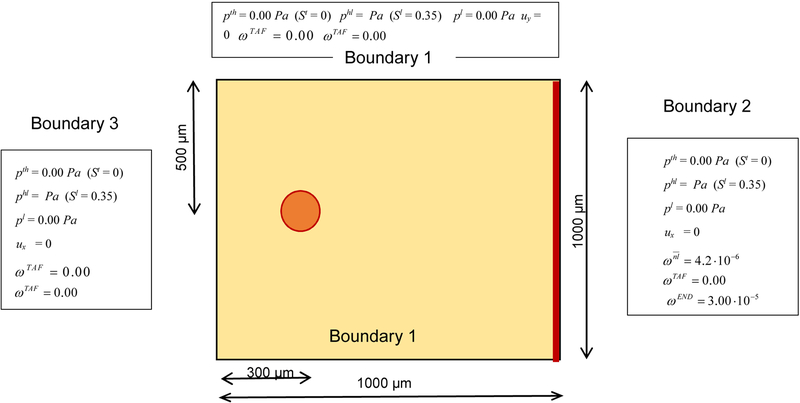
A circular tumor with diameter 50 μm is situated in a square domain 1000 × 1000 μm2 with a blood vessel on the right side, see Fig. 5. HCs, ECM and IF are present in the whole domain. The oxygen diffuses in the IF. As initial conditions the oxygen mass fraction is fixed at 4.2 10−6 in the whole domain, the ECM volume fraction is 0.2, the TCs volume fraction is 0.02, the HCs volume fraction is 0.45. The endothelial cells are present on the blood vessel on the right side of the domain, with initial mass fraction 3 10−5. The boundary conditions are imposed on all the sides of the square for oxygen and TAF; for the endothelial cells zero concentration is prescribed in the upper, bottom and left sides. The parameters for the growth of tumor cells, for the ECM, for the HCs and for the diffusion of oxygen are listed in Tables 1, 2, 3 (Sciumè et al. 2014b). The whole domain is discretized with triangular elements.
Fig. 5.
Geometry of the problem with boundary conditions
Table 1.
Parameters
| Parameter | Symbol | Value | Unit |
|---|---|---|---|
| Density of the three fluid phases (α = h, t and l) | ρα | 1000 | kg/m3 |
| Dynamic viscosity of IF (Sciumè et al. 2014b) | μl | 1·10−2 | Pa·sec |
| Dynamic viscosity of TC (Sciumè et al. 2014b) | μt | 20 | Pa·sec |
| Dynamic viscosity of HC (Sciumè et al. 2014b) | μh | 20 | Pa·sec |
| Critical mass fraction of oxygen | 2.0·10−6 | — | |
| Growth coefficient of tumor cells (Sciumè et al. 2013)(Sciumè et al. 2014a) | 4·10−2 | kg/(m3·s) | |
| Necrosis coefficient (Sciumè et al. 2013)(Sciumè et al. 2014a) | 1·10−2 | kg/(m3·s) | |
| Consumption related to growth in eqn (Sciumè et al. 2013)(Sciumè et al. 2014a) | 2·10−4 | kg/(m3·s) | |
| Consumption related to metabolism in eqn (Sciumè et al. 2013)(Sciumè et al. 2014a) | 3·10−4 | kg/(m3·s) | |
| HC-IF interfacial tension (Sciumè et al. 2014b) | σhl | 72 | mN/m |
| TC-HC interfacial tension (Sciumè et al. 2014b) | σth | 36 | mN/m |
| TC-IF interfacial tension (Sciumè et al. 2014b) | σtl | 108 | mN/m |
Table 2.
Parameters related to oxygen diffusion, including those for the smeared model
| Parameter | Symbol | Value | Unit |
|---|---|---|---|
| Diffusion coefficient of oxygen in interstitial fluid (Sciumè et al. 2013)(Sciumè et al. 2014a) | 3.2·10−9 | m2/sec | |
| Coefficient δ (Sciumè et al. 2013)(Sciumè et al. 2014a) | δ | 2 | — |
| Normal mass fraction of oxygen in tissue (Sciumè et al. 2013)(Sciumè et al. 2014a) | 4.2·10−6 | — | |
| Mean capillary diameter | Dcap | 10 | μm |
| Thickness of the endothelial layer | δEC | 1 | μm |
| Diffusion coefficient of oxygen through endothelial layer | Dwall | 8.73·10−10 | m2/s |
| Mass fraction of oxygen in capillaries | ωsys | 0.2451·10−3 | — |
Table 3.
Parameters depending for ECM taken from (Sciumè et al. 2014b)
| Parameter | Symbol | Value | Unit |
|---|---|---|---|
| Density of the solid phase | ρs | 1·103 | kg/m3 |
| Poisson’s ratio of the ECM | ν | 0.4 | — |
| Young’s modulus of the ECM | Efin | 2.0·102 | Pa |
| Volume fraction of ECM (initial) | εs | 0.0 | — |
| Coefficient a | a | 590 | Pa |
| Intrinsic permeability | k | 1.8·10−15 | m2 |
| Yield effective stress limit | 0.5·101 | Pa | |
| Viscosity | η | 5 | Pa·sec |
| Hardening modulus | H | 1.0·102 | Pa |
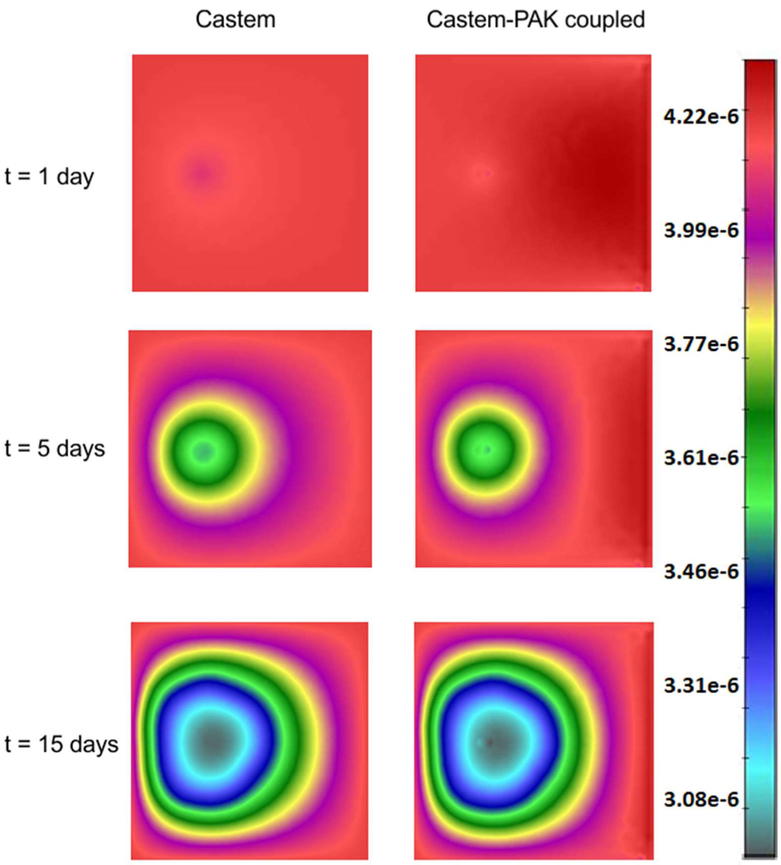
The fields for the oxygen mass fraction, obtained by the Castem and Castem-PAK solvers are shown in Fig. 6. A higher consumption of oxygen appears in the first analysis (Castem). In the coupled analysis (Castem-PAK) the oxygen mass is larger because the supply from the capillary network is taken into account. The capillary domain in the smeared model is only present at FE nodes where the endothelial cell mass fraction (determined by the Castem) is different from zero. The nodal mass fraction of capillaries (capillary density) is determined as
| (27) |
where Dcap and δEC are capillary diameter and thickness of the endothelial layer (see Table 2).
Fig. 6.
Oxygen concentration (mass fraction) field obtained by using Castem and Castem-PAK, for t = 1, 5, 15 days
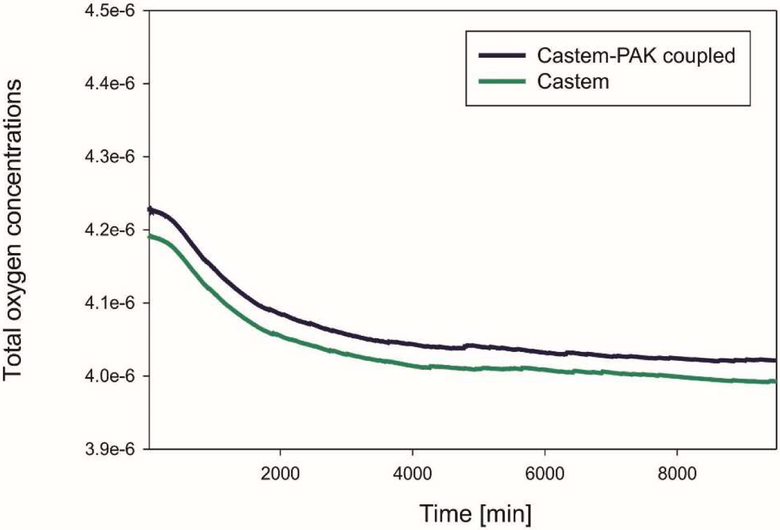
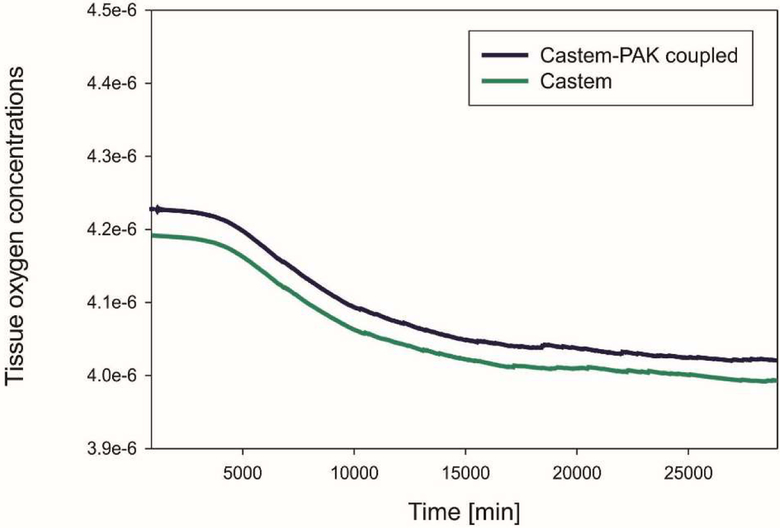
The graphs in Fig. 7, 8, 9 show differences in oxygen concentration over time for the total oxygen mass fraction, in the tissue, and in tumor, respectively, obtained by using Castem and Castem-PAK software. It can be seen from Fig. 7 and 8 that the difference between the oxygen mass fraction of the two analyses remains almost constant in time, but the coupled solution curve is above that obtained by the Castem only. In the zone of the tumor (Fig. 9) this difference tends to zero as time progresses because the oxygen consumption increases with the tumor growth. By comparing Fig. 7 and 8 it appears that most of the oxygen is in the tissue.
Fig. 7.
Mean oxygen concentrations in whole domain as function of time, Castem and Castem-PAK solutions
Fig. 8.
Mean oxygen concentrations in tissue as function of time, Castem and Castem-PAK solutions
Fig. 9.
Mean oxygen concentration in tumor as function of time, Castem and Castem-PAK solutions
When the oxygen concentration is lower than a fixed threshold, the living tumor cells produce the tumor angiogenic factor (TAF) that diffuses from the tumor into the IF. Solutions for the TAF concentration obtained by Castem and Castem-PAK, for three different time stations, are shown in Fig. 10 and 11. It can be seen that lower concentration in the Castem solution produces larger TAF concentrations.
Fig. 10.
TAF concentrations using CASTEM and CASTEM-PAK, for t = 1, 5 and 15 days
Fig. 11.
Mean TAF concentration as function of time, Castem and Castem-PAK solutions
As response to the TAF the endothelial cells start moving from the vessel based on the right side of the domain towards the tumor as shown in Fig. 12 after 5 days for the coupled analysis Castem-PAK. Note that PAK doesn’t change endothelial cells mass fraction, hence in fact only Castem results are shown.
Fig. 12.
Endothelial cells mass fraction, after 5 days
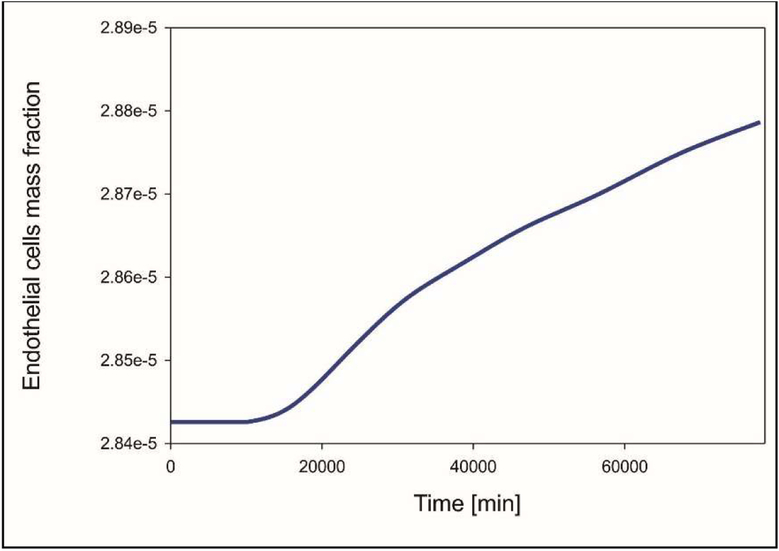
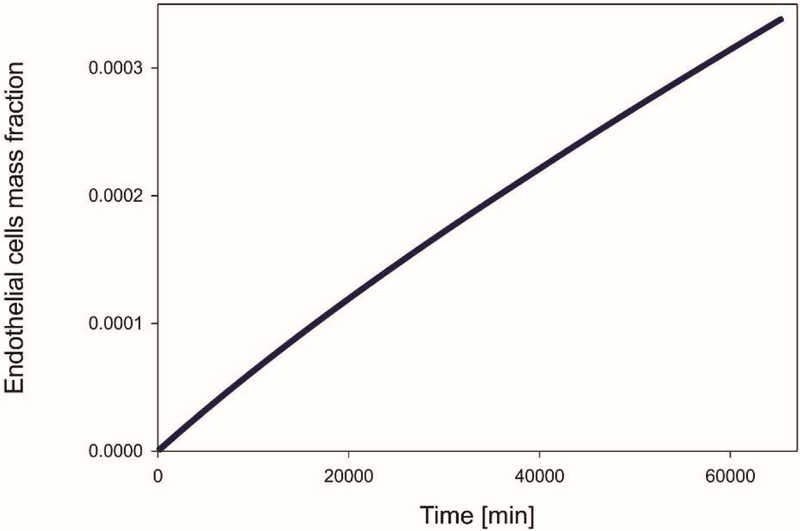
In Fig. 13 the graph for the endothelial cells mass fraction over time is depicted. After the initial response to the TAF where endothelial cells concentration remains constant, there is an almost linear increase as time progresses.
Fig. 13.
Mean mass fraction of endothelial cells as a function of time
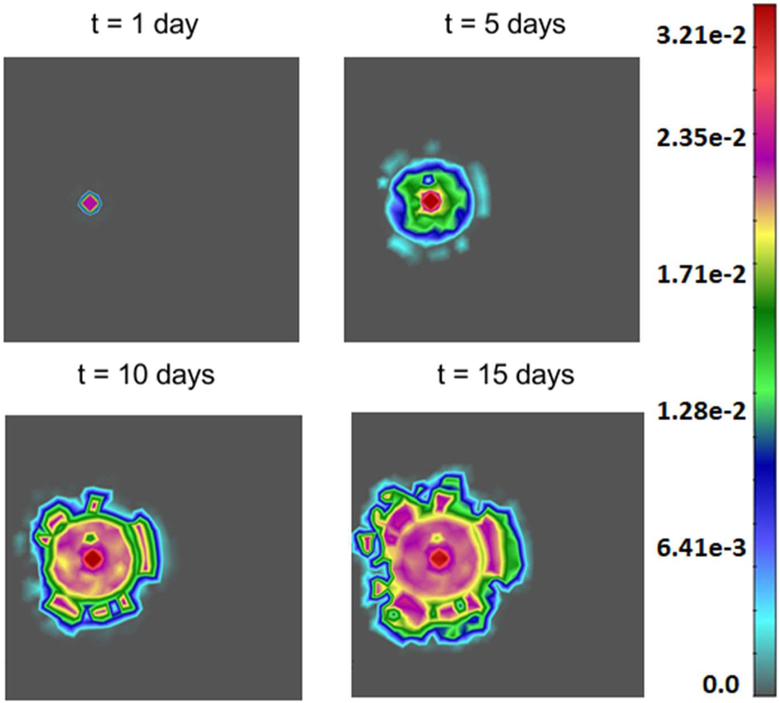
Fig. 14 shows tumor growth after 1 day, 5, 10 and 15 days. Note how the tumor rim becomes irregular as the tumor grows. For this example, Castem and Castem-PAK produce very similar results of the tumor size and shape (this also can be seen in Fig. 15). Hence only Castem results are shown.
Fig. 14.
Tumor growth for t = 1, 5, 10 and 15 days. Results are almost the same for Castem and Castem-PAK model
Fig. 15.
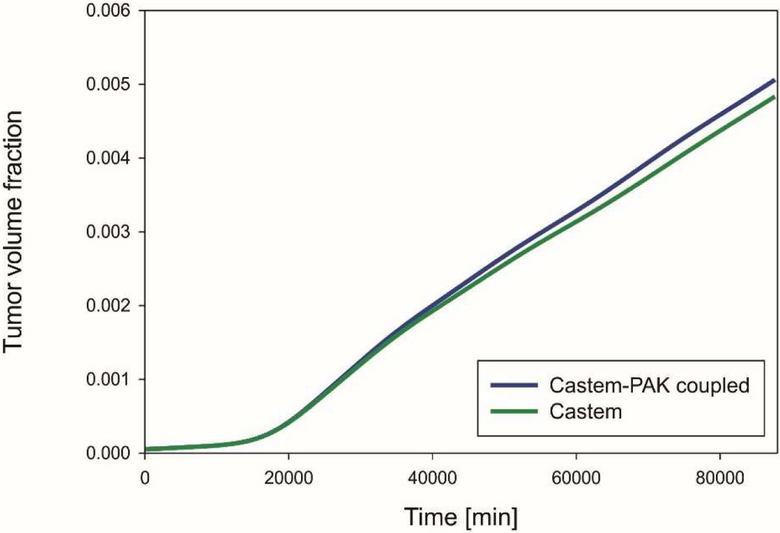
Mean volume fraction of tumor as function of time, for Castem and Castem-PAK
Fig. 15 shows the tumor growth according to the two analyses. With the coupled codes the final tumor growth is larger because of the higher oxygen concentration due to supply. The difference between the two models is not significant because angiogenesis is low (small endothelial mass fraction, Fig. 13).
5.2. Simulation of melanoma growth
Cutaneous melanoma growth with angiogenesis has been simulated in (Santagiuliana et al. 2016). Here the simulation is repeated by using the coupled models and results are compared. A detailed description of the physical problem can be found in (Santagiuliana et al. 2016) together with the geometry, boundary and initial conditions. We recall that the melanoma first expands radially, then a penetration through the basement membrane occurs and angiogenesis begins as described above.
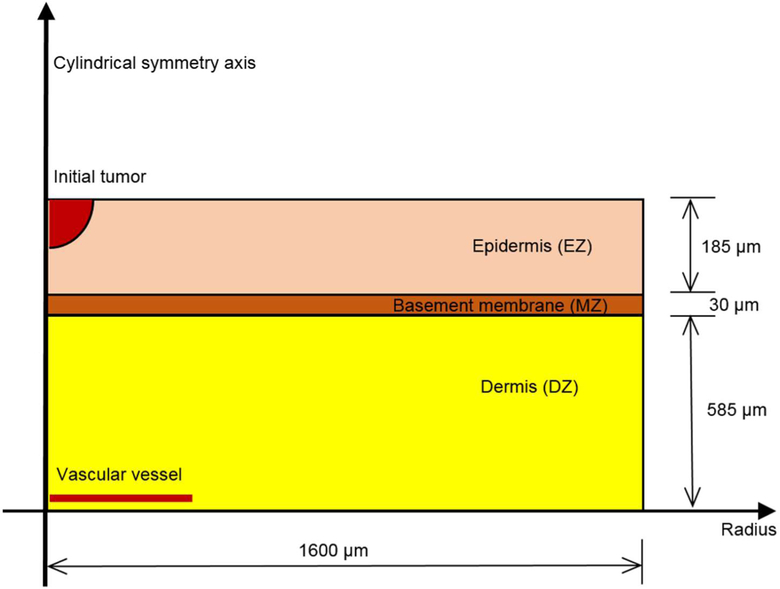
The geometry of the skin is drawn in Fig. 16.
Fig. 16.
Skin structure and geometry of the modeled case, redrawn with permission from (Santagiuliana et al. 2016)
The parameters used are indicated in Table 4.
Table 4 -.
Parameters depending on ECM type taken from (Sciumè et al. 2014b), redrawn with permission from (Santagiuliana et al. 2016)
| Parameter | Symbol | Value | Unit |
|---|---|---|---|
| Density of the solid phase | ρs | 1000 | kg/m3 |
| Poisson’ ratio of the ECM | ν | 0.4 | — |
| Young’s modulus of the ECM | |||
| EDZ | 1·102 | ||
| Volume fraction of ECM (initial) | |||
| 0.1 | — | ||
| Coefficient a in eqs (23) | |||
| aDZ | 664 | ||
| Intrinsic permeability | |||
| kDZ | 2.56·10−15 | ||
| Viscosity | η | 5 | Pa·sec |
| Hardening modulus | H | 1.0·102 | Pa |
The parameters in for the four phases and the oxygen are those of Tables 1 and 2. For the ECM, the parameters are in Table 4 (Sciumè et al. 2014b). The parameters for TAF and Endothelial cells in Table 5 stem from literature, (Anderson and Chaplain 1998; Breward et al. 2003; Eikenberry et al. 2009) and from sensitivity analysis.
Table 5.
Parameters for TAF end Endothelial cells, redrawn with permission from (Santagiuliana et al. 2016)
| Parameter | Symbol | Value | Unit |
|---|---|---|---|
| Limit mass fraction of oxygen for hypoxia | 4.0·10−6 | — | |
| Diffusion coefficient of TAF in interstitial fluid (Anderson and Chaplain 1998) | 3.5·10−4 | m2/sec | |
| Diffusion coefficient of endothelial cells in interstitial fluid (Eikenberry et al. 2009) | 1.29·10−12 | m2/sec | |
| coefficient for uptake of TAF by endothelial cells | νTAF | 1.00·10−15 | — |
| degradation rate coefficient for TAF demise | βTAF | 8.00·10−13 | — |
| coefficient for TAF and EC production | c | 1.00·10−3 | — |
| coefficient for new oxygen brought by the new capillary network | ϕ | 1.00·10−8 | — |
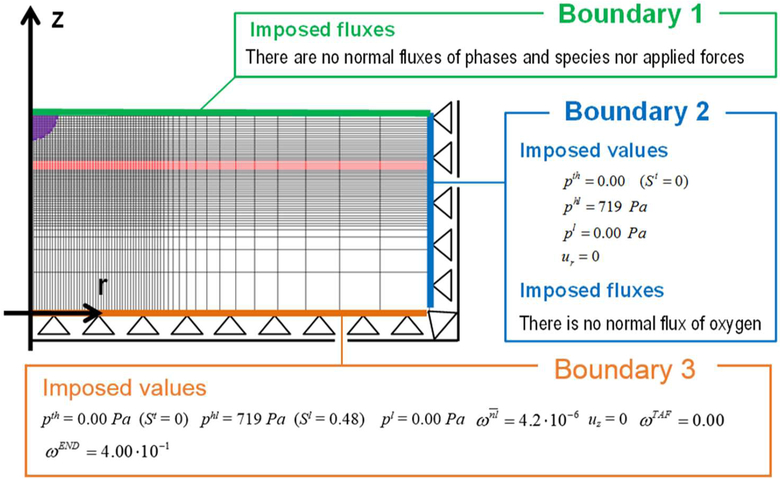
The problem of Fig. 16 is simulated in axial symmetry and the domain is discretized by 3720 plane four node elements. The boundary conditions are described in Fig. 17.
Fig. 17.
Discretization of the domain and boundary conditions, redrawn with permission from (Santagiuliana et al. 2016)
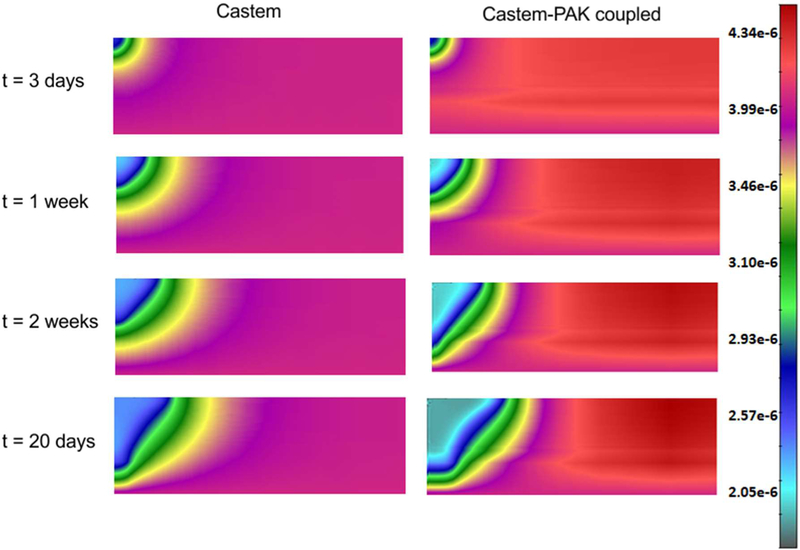
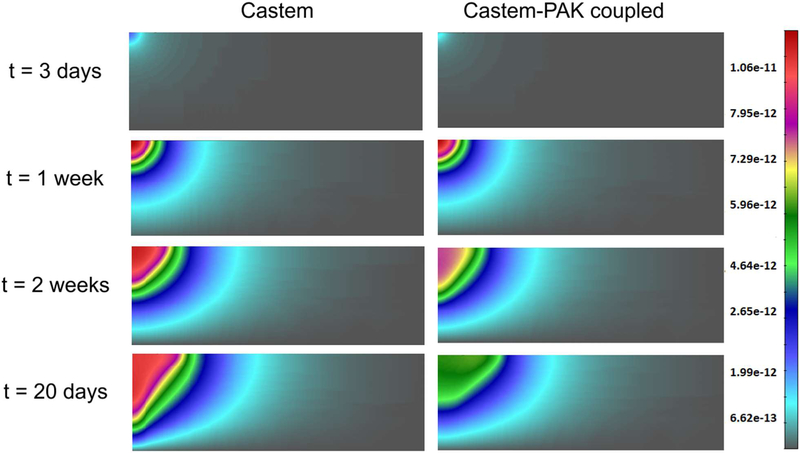
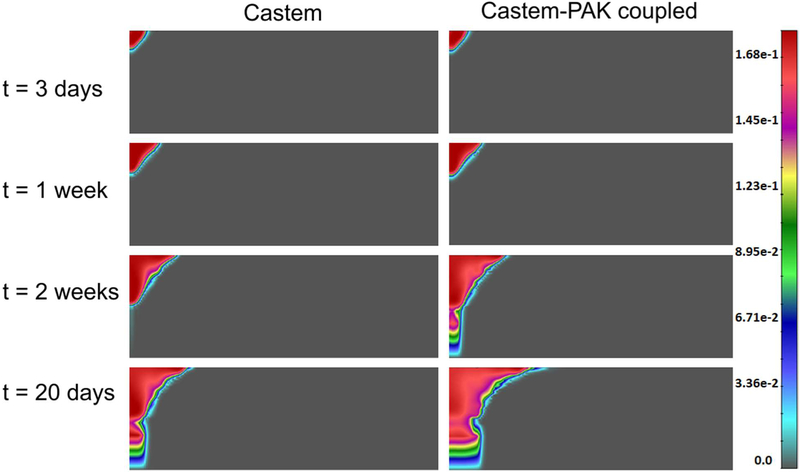
In the whole domain the initial interstitial fluid pressure (IFP), p1, is set equal to 0 Pa, while the HC-IF pressure difference, phl, is set equal to 719 Pa, which correspond to a saturation degree of IF, in EP, MZ and DZ respectively equal to 0.44, 0.40, and 0.48. At time t = 0 h, all four phases coexist in the purple region of Fig. 17 (it has a radius of 40 μm), while in the remaining regions of the domain no TCs are present. Within the purple region, the initial saturation degree of the tumor cells (TC) is set to 0.125, corresponding to pth ≈ 59 Pa. Oxygen is here the sole nutrient species, and in the whole domain its mass fraction is initially set equal to 4.2.10−6, which corresponds to the average of the dissolved oxygen in the plasma of a healthy individual. Initial TAF concentration is zero. When the oxygen is less than a critical value, fixed for this simulation as 3.0.10−6, i.e. when there is hypoxia, the living tumor cells produce TAFs that diffuse. The boundary condition for TAF is zero concentration at the base of dermis. The endothelial cells are initially present at the base of the dermis, in the blood vessel with mass fraction equal to 4.0.10−1. At the upper boundary (B1), there are no fluxes of phases and species nor applied forces. At the right boundary (B2) the primary variablesp pl, phl, pth and ur are fixed in time (Dirichlet boundary conditions) and zero flux is imposed for oxygen. At the lower boundary (B3), the primary variables pl, phl,pth and uz are fixed in time (see Fig. 17). The boundary conditions at the z axis are assumed respecting cylindrical symmetry. The results of this simulation are now shown. Fig. 18 depicts the oxygen concentration fields at four time instants, according to the tumor growth model alone and the coupled model. It can be seen that oxygen concentrations are larger when the capillary network is included within the smeared model.
Fig. 18.
Oxygen field concentrations obtained using Castem and Castem-PAK, for t = 3 days, 1 week, 2 weeks and 20 days
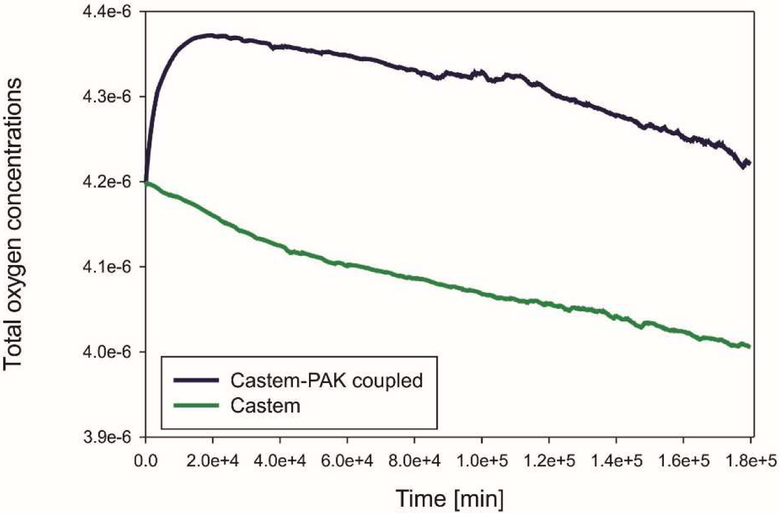
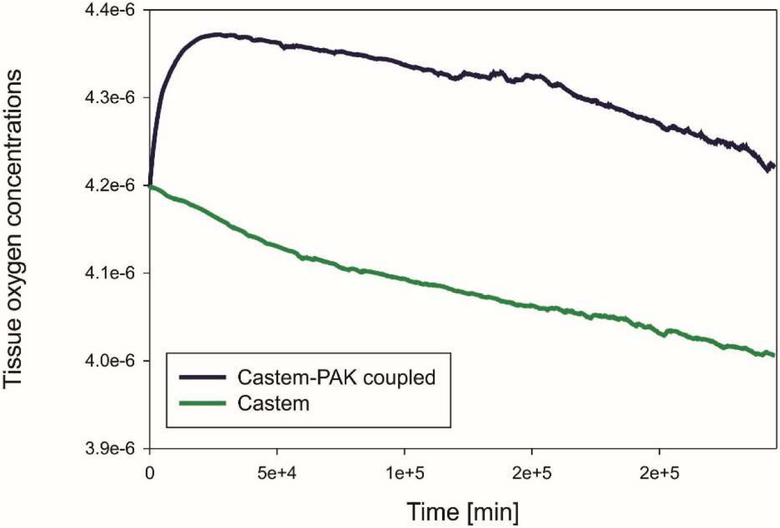
In Fig. 19 and 20 mean oxygen concentrations are shown, respectively for the total oxygen concentration in tumor and tissue, and the oxygen concentration in tissue alone. After an initial short period the evolution is quite similar and it can be seen that most of oxygen is in the tissue.
Fig. 19.
Mean oxygen concentrations in tumor and tissue as function of time, for Castem and Castem-PAK coupled model
Fig. 20.
Mean oxygen concentrations in tissue as function of time, for Castem and Castem-PAK coupled model
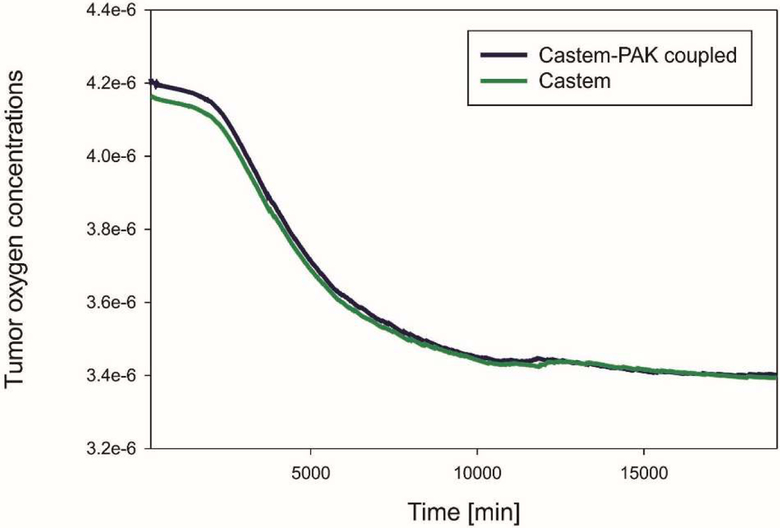
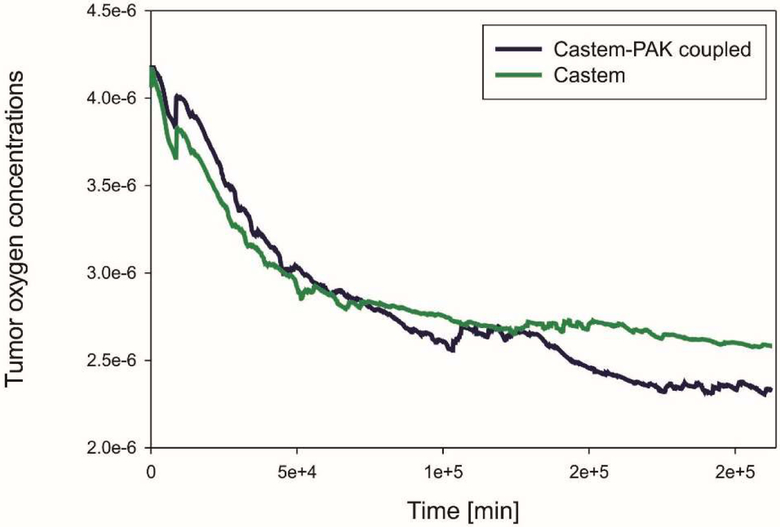
Tumor oxygen concentrations are shown in Fig. 21. As time goes on there is a bit less oxygen in the tumor when the coupled model Castem-PAK is used as compared to the Castem solution. Tumor consumes oxygen and this seems to be the predominant behavior.
Fig. 21.
Mean oxygen concentrations in tumor as function of time, for Castem and Castem-PAK
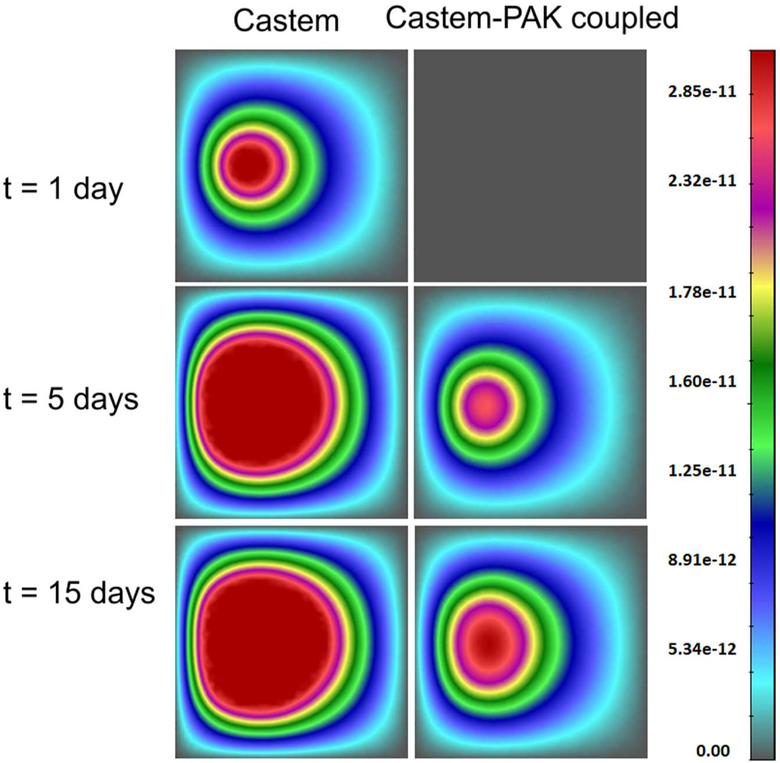
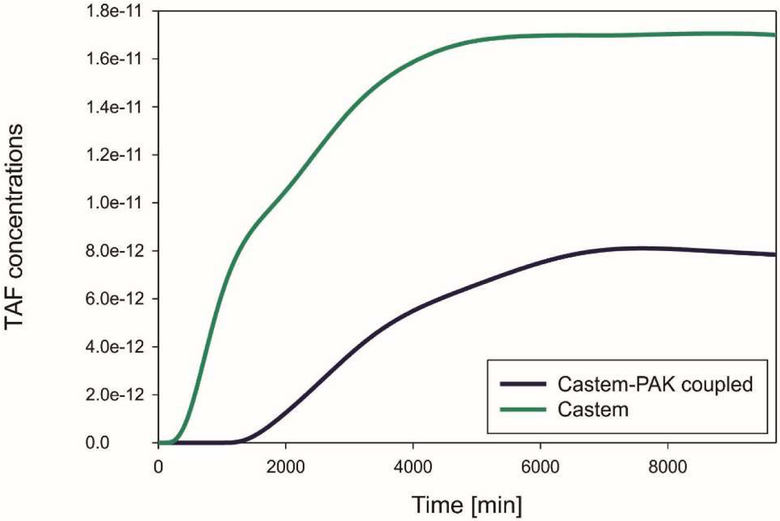
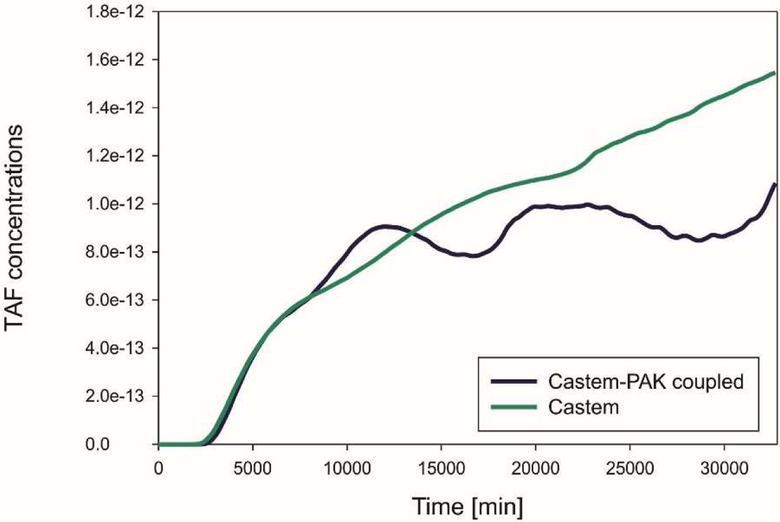
TAF concentrations from Castem and Castem-PAK are shown in Fig. 22 for four different time instants. It appears, see also Fig. 23, that lower oxygen concentration in the Castem model produces larger TAF.
Fig. 22.
TAF concentrations obtained using Castem and Castem-PAK models, for t = 3 days, 1 week, 2 weeks and 20 days
Fig. 23.
Mean TAF concentrations as function of time, Castem and Castem-PAK models
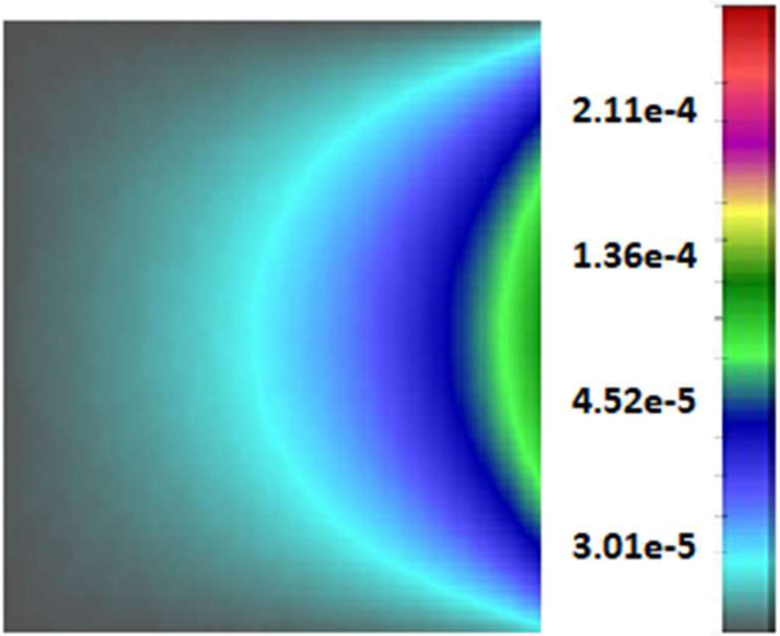
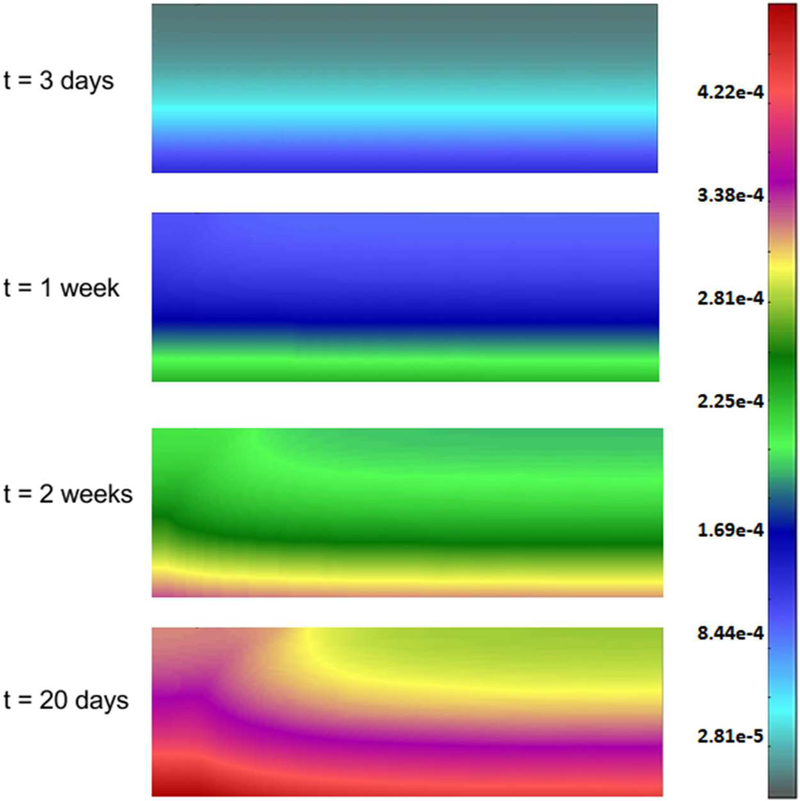
The endothelial cells mass fraction determined by the Castem model is shown in Fig. 24. Over time concentration of endothelial cells grows. It can be seen that after two weeks endothelial cells migrate towards tumor because of the gradient of the TAF. Mean mass fraction of ECs is depicted in Fig. 25. The increase of ECs is almost linear. Tumor growth, with the tumor domains progressing with time, is shown in Fig. 26 for both models and for four different time instants.
Fig. 24.
Endothelial cells mass fraction for t = 3 days, 1 week, 2 weeks and 20 days, Castem model
Fig. 25.
Mean mass fraction of endothelial cells as function of time, Castem model.
Fig. 26.
Tumor growth according to Castem and Castem-PAK models, for t = 3 days, 1 week, 2 weeks and 20 days
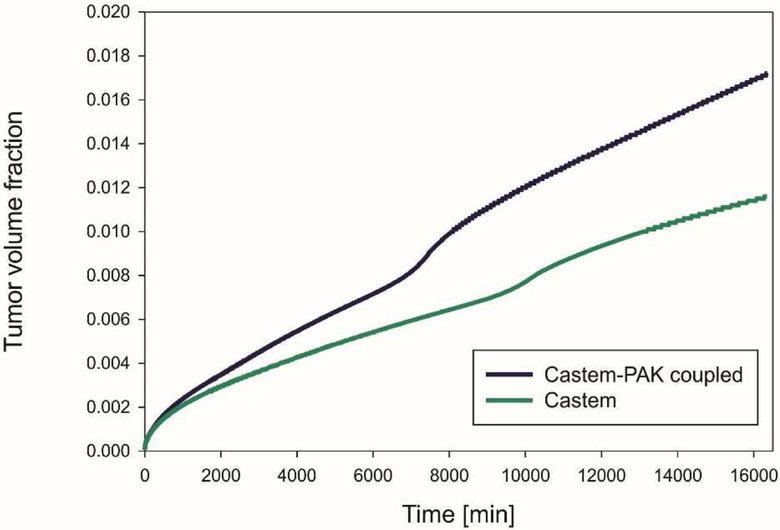
The mean volume fraction of tumor, which represents the tumor growth, is drawn against time in Fig. 27. The tumor volume is larger when using the coupled models (Castem-PAK) instead of just the tumor growth model alone (Castem). There is more oxygen available with the presence of capillaries, see Fig. 19 and 20. Comparing the tumor growth in the two examples, Fig. 15 and 27, it also appears that the effect of oxygen supply from capillaries on tumor growth is larger in the melanoma tumor; this is due to difference in the evolution rate of endothelial cells (around two order of magnitude larger in melanoma tumor, see Fig. 13 and 25) and therefore of the rate of angiogenesis.
Fig. 27.
Mean volume fraction of tumor as function of time, for Castem and Castem-PAK
6. Conclusions
A very general multiphase porous media model for tumor growth has been coupled with a bio distribution model. This coupled code allows to simulate a more realistic dynamics of molecules involved in proliferating tumors. The tumor growth model yields as a function of the available nutrient, evolution of tumor cell population, both viable and necrotic, of the differential pressure between cell populations, of porosity of ECM, of consumption of nutrients due to tumor growth, of angiogenesis and related growth factors. On the other hand the bio distribution model integrates the tumor growth model with the diffusion of molecules, oxygen and the smeared capillary network in the tumor environment. The two models and their connection have been presented in detail. The code coupling is the new aspect of this paper. Two examples have been shown: a 2D example of tumor growth in a square domain and an axisymmetric example of melanoma growth. In both cases comparison has been carried out between the new results from the coupled codes and the result from the tumor growth code alone. The model connection offers a better insight into regulation of the oxygen diffusion and of possible other molecules including therapeutic agents e.g. chemotherapeutics or molecularly targeted therapeutics such as T cells, antibodies for immunotherapy, and of nanoparticles and multistage platforms. The combined models appear as an appropriate tool for simulating the growth of a tumor in a whole organ allowing at the same time to evaluate the efficacy of the therapeutic agents.
Acknowledgements
B.A.S. gratefully acknowledges the support of the Technische Universität München - Institute for Advanced Study, funded by the German Excellence Initiative and the TUV SÜD Foundation. The authors acknowledge CITO Award, Houston Methodist Research Institute, Houston, NCI U54 CA210181. The authors affiliated to Serbian institutions also acknowledge support from Ministry of Education and Science of Serbia, grants OI 174028 and III 41007, and City of Kragujevac.
References
- Anderson AR and Chaplain MA, Bull. Math. Biol 60, 857 (1998). [DOI] [PubMed] [Google Scholar]
- Breward CJW, Byrne HM, and Lewis CE, 8240, 609 (2003). [DOI] [PubMed]
- Carotenuto AR, Cutolo A, Petrillo A, Fusco R, Arra C, Sansone M, Larobina D, Cardoso L, and Fraldi M, J. Mech. Behav. Biomed. Mater 86, 55 (2018). [DOI] [PubMed] [Google Scholar]
- Cowin SC and Cardoso L, Mech. Mater 44, 47 (2012). [DOI] [PMC free article] [PubMed] [Google Scholar]
- Dewhirst MW and Secomb TW, Nat. Rev. Cancer 17, 738 (2017). [DOI] [PMC free article] [PubMed] [Google Scholar]
- Discher DE, Janmey P, and Wang Y-L, Science 310, 1139 (2005). [DOI] [PubMed] [Google Scholar]
- Eikenberry S, Thalhauser C, and Kuang Y, PLoS Comput. Biol 5, (2009). [DOI] [PMC free article] [PubMed] [Google Scholar]
- Ferrari M, Trends Biotechnol. 28, 181 (2010). [DOI] [PMC free article] [PubMed] [Google Scholar]
- Ferrari M, Int. J. Non. Linear. Mech 56, 3 (2013). [Google Scholar]
- Fraldi M and Carotenuto AR, J. Mech. Phys. Solids 112, 345 (2018). [DOI] [PMC free article] [PubMed] [Google Scholar]
- Freyer G, Ligneau B, Tranchand B, Ardiet C, Serre-Debeauvais F, and Trillet-Lenoir V, Cancer Treat. Rev 23, 153 (1997). [DOI] [PubMed] [Google Scholar]
- Gray W and Miller C, Introduction to the Thermodynamically Constrained Averaging Theory for Porous Medium Systems. (Springer International Publinshing, Switzerland, 2014). [Google Scholar]
- Gray W and Schrefler B, Int. J. Numer. Anal. Methods Geomech 31, 541 (2007). [Google Scholar]
- Gray WG, Miller CT, and Schrefler BA, Adv. Water Resour 51, 123 (2013). [DOI] [PMC free article] [PubMed] [Google Scholar]
- Hawkins-Daarud A, Prudhomme S, van der Zee KG, and Oden JT, J. Math. Biol 67, 1457 (2013). [DOI] [PubMed] [Google Scholar]
- Koay EJ and Ferrari M, Phys. Biol 11, 60201 (2014). [DOI] [PubMed] [Google Scholar]
- Kojic M, Milosevic M, Simic V, Koay E, Kojic N, Ziemys A, and Ferrari M, Comput. Biol. Med in press (2018). [DOI] [PMC free article] [PubMed] [Google Scholar]
- Kojic M, Milosevic M, Simic V, Koay EJ, Fleming JB, Nizzero S, Kojic N, Ziemys A, and Ferrari M, Comput. Methods Appl. Mech. Eng 324, 413 (2017a). [DOI] [PMC free article] [PubMed] [Google Scholar]
- Kojic M, Milosevic M, Simic V, Koay EJ, Kojic N, Ziemys A, and Ferrari M, J. Serbian Soc. Comput. Mech 11, 108 (2017b). [DOI] [PMC free article] [PubMed] [Google Scholar]
- Kojic M, Slavkovic R, Zivkovic M, Grujovic N, Filipovic N, and Milosevic M, (2010).
- Kremheller J, Vuong AT, Yoshihara L, Wall WA, and Schrefler BA, Comput. Methods Appl. Mech. Eng 340, 657 (2018). [DOI] [PMC free article] [PubMed] [Google Scholar]
- Lima EABF, Almeida RC, and Oden JT, 31, 552 (2015). [Google Scholar]
- Lima EABF, Oden JT, Hormuth DA 2nd, Yankeelov TE, and Almeida RC, Math. Models Methods Appl. Sci 26, 2341 (2016). [DOI] [PMC free article] [PubMed] [Google Scholar]
- Michor F, Liphardt J, Ferrari M, and Widom J, 11, 657 (2011). [DOI] [PMC free article] [PubMed]
- Milosevic M, Simic V, Milicevic B, Koay E, Ferrari M, Ziemys A, and Kojic M, Comput. Meth.ods Appl. Mech. Eng 338, 97 (2018). [DOI] [PMC free article] [PubMed] [Google Scholar]
- Moore NM, Kuhn N, Hanlon SE, Lee JSH, and Nagahara LA, Phys. Biol 8, 10302 (2011). [DOI] [PubMed] [Google Scholar]
- Oden JT, Hawkins A, and Prudhomme S, Math. Model. Methods Appl. Sci 20, 477 (2010). [Google Scholar]
- Oden JT, Lima EABF, Almeida RC, Feng Y, Rylander MN, Fuentes D, Faghihi D, Rahman MM, DeWitt M, Gadde M, and Zhou JC, Arch. Comput. Methods Eng 23, 735 (2016). [Google Scholar]
- Oden JT, Prudencio EE, and Hawkins-Daarud A, Math. Model. Methods Appl. Sci 23, 1309 (2013). [Google Scholar]
- Rahman MM, Feng Y, Yankeelov T, and Oden JT, Comput. Methods Appl. Mech. Eng 320, 261 (2017). [DOI] [PMC free article] [PubMed] [Google Scholar]
- Rocha HL, Almeida RC, Lima EABF, Resende ACM, Oden JT, and Yankeelov TE, Math. Model. Methods Appl. Sci 28, 61 (2018). [DOI] [PMC free article] [PubMed] [Google Scholar]
- Santagiuliana R, Ferrari M, and Schrefler BA, Comput. Methods Appl. Mech. Eng 304, 197 (2016). [Google Scholar]
- Santagiuliana R, Stigliano C, Mascheroni P, Ferrari M, Decuzzi P, and Schrefler BA, Adv. Model. Simul. Eng. Sci 2, 19 (2015). [Google Scholar]
- Sciumè G, Gray WG, Hussain F, Ferrari M, Decuzzi P, and Schrefler B. a., Comput. Mech 53, 465 (2014a). [Google Scholar]
- Sciumè G, Santagiuliana R, Ferrari M, Decuzzi P, and Schrefler BA, Phys. Biol 11, 65004 (2014b). [DOI] [PMC free article] [PubMed] [Google Scholar]
- Sciumè G, Shelton S, Gray WG, Miller CT, Hussain F, Ferrari M, Decuzzi P, and Schrefler BA, New J. Phys 15, 15005 (2013). [DOI] [PMC free article] [PubMed] [Google Scholar]
- Vilanova G, Burés M, Colominas I, and Gomez H, J. R. Soc. Interface 15, (2018). [DOI] [PMC free article] [PubMed] [Google Scholar]


