
Figure 1.
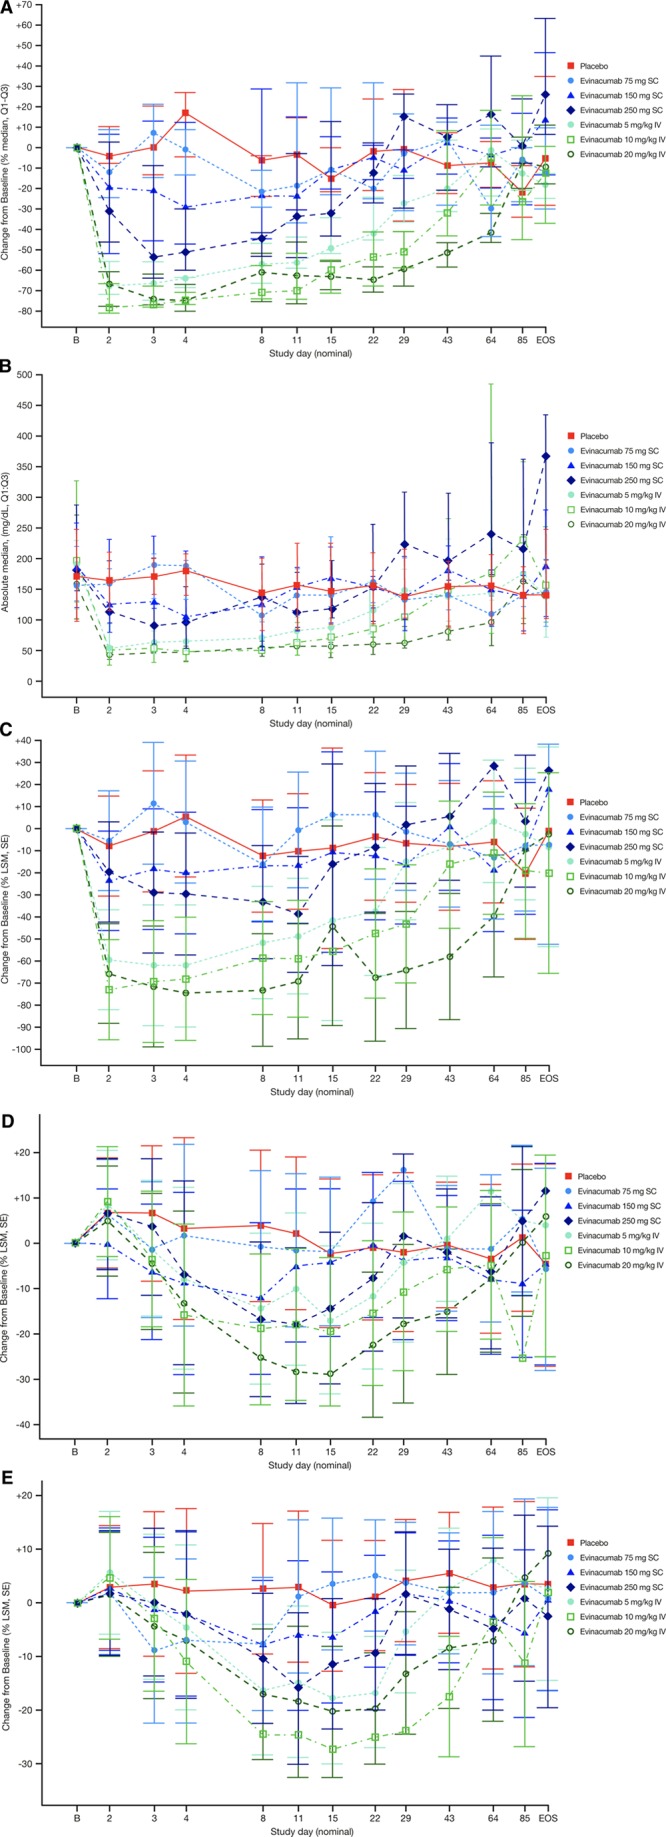
Percent median (Q1–Q3) change from baseline. Percent median (Q1–Q3) change from baseline in (A) triglycerides, (B) absolute median triglyceride levels, and percent LSM (SE) change from baseline in (C) VLDL-C, (D) LDL-C, and (E) HDL-C in subjects with multiple dyslipidemia (single ascending dose study). EOS indicates end of study; HDL-C, high-density lipoprotein cholesterol; LDL-C, low-density lipoprotein cholesterol; LSM, least-squares mean; and VLDL-C, very-low-density lipoprotein cholesterol.