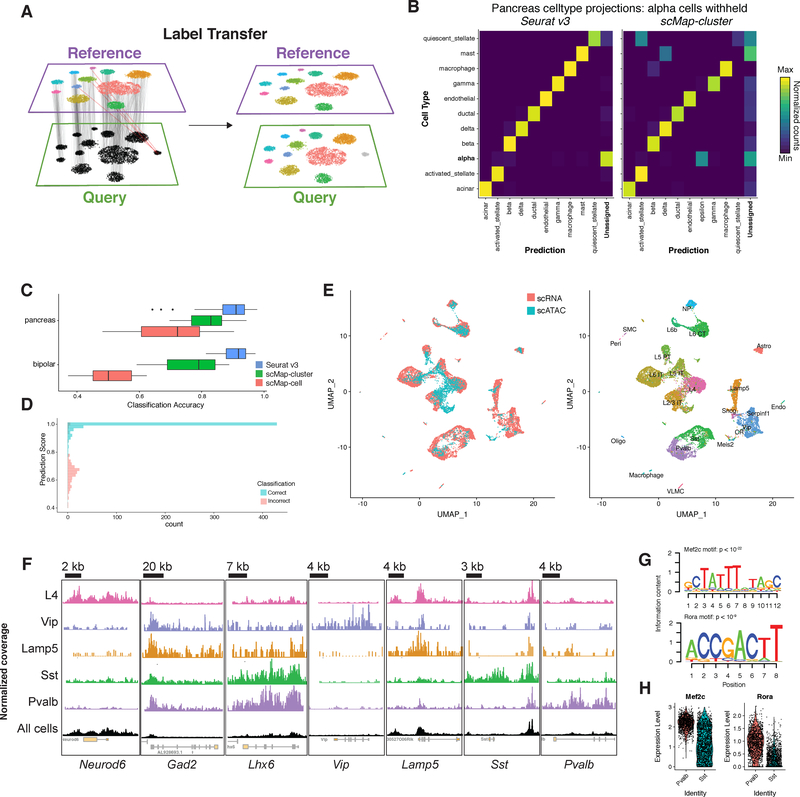
Figure 3. Transferring cell state classifications across datasets.
(A) Schematic representation where identified anchors allow for the transfer of discrete labels between a reference and query dataset. (B) Confusion matrix for one cell type hold-out evaluation where pancreatic alpha cells were removed from the reference. Cell types with fewer than two cells in the query not shown. Alpha cells in the query consistently receive the lowest classification score, and are labeled as “Unassigned”. (C) Classification benchmarking on 166 test/training datasets from human pancreatic islets and mouse retina. (D) Distribution of prediction scores for one cell type hold-out experiment (as in B). Mis-classification calls are associated with lower prediction scores. (E) Joint visualization of scRNA-seq data with classified scATAC-seq cells (left). We identified anchors between scRNA-seq data (reference) and a gene activity matrix derived from scATAC-seq (query) datasets from the mouse visual cortex, and transferred class annotations (right). (F) We created pseudo-bulk ATAC-seq profiles by pooling together cells with for each cell type. Each cell type showed enriched accessibility near canonical marker genes. Chromatin accessibility tracks are normalized to sequencing depth (RPKM normalization) in each pooled group. Y-axes for each track ranged from 0 to different maxima, due to inherent differences in the maximum read depth at different loci. For each locus, the y-axis maximum shown is: Neurod6 1,500; Gad2, Pvalb, Sst, Vip, Lamp5, and Id2 1,000; Lhx6 600. (G) We searched for overrepresented DNA motifs present in PV-specific accessibility peaks, and identified the Mef2c and Rora motifs as the most highly enriched motifs (p < 10−22 and p < 10−9). (H) Both Mef2c and Rora also exhibit upregulated expression in PV interneurons from scRNA-seq.

