Abstract
INTRODUCTION:
Modeling the flow dynamics in cerebral aneurysms after the implantation of intra-saccular devices is important for understanding the relationship between flow conditions created immediately post-treatment and the subsequent outcomes. This information, ideally available a priori based on computational modeling prior to implantation, is valuable to identify which aneurysms will occlude immediately and which aneurysms will likely remain patent and would benefit from a different procedure or device.
METHODS:
In this report a methodology for modeling the hemodynamics in intracranial aneurysms treated with intra-saccular flow diverting devices is described. This approach combines an image-guided, virtual device deployment within patient-specific vascular models with an immersed boundary method on adaptive unstructured grids. A partial mesh refinement strategy that reduces the number of mesh elements near the aneurysm dome where the flow conditions are largely stagnant was compared to the full refinement strategy that refines the mesh everywhere around the device wires.
RESULTS:
The results indicate that using the partial mesh refinement approach is adequate for analyzing the post-treatment hemodynamics, at a reduced computational cost. The results obtained on a series of four cerebral aneurysms treated with different intra-saccular devices were in good qualitative agreement with angiographic observations.
CONCLUSIONS:
Promising results were obtained relating post-treatment flow conditions and outcomes of treatments with intra-saccular devices, which need to be confirmed on larger series.
Introduction
The two main options for treating intracranial aneurysms (IA) have been surgical clipping and endovascular coiling [1]. Clipping typically requires a craniotomy, dissection until exposure of the aneurysm, and placement of the clip (or clips) across the neck. Although invasive, if the clips are properly placed, this approach is highly effective and stable (no re-treatment needed). However, some locations are difficult to access, and clipping can be difficult for some complex aneurysms with wide necks. Endovascular coiling is a less invasive procedure that requires endovascular navigation and release of metallic coils within the aneurysm cavity to provoke aneurysm thrombosis and occlusion. This procedure is highly effective if the aneurysm volume is properly filled with coils. However, coils tend to move or “compact” in large aneurysms, often requiring re-treatment. Furthermore, complex aneurysms with large necks are also difficult to treat with coils alone as the coil mass can protrude into the parent artery which may produce emboli or cause parent artery thrombosis.
For these reasons, new approaches based on the concept of flow diversion were developed [1]. The objective of this strategy is to deviate the flow away from the aneurysm, thus promoting aneurysm thrombosis and occlusion, as well as subsequent endothelialization and artery reconstruction. This has been achieved with a variety of flow diverting (FD) devices. Most FD devices are stent-like devices that are placed along the parent artery and across the aneurysm orifice [2]. Hemodynamically, the most important design parameters are the porosity and pore size or pore density. The higher the pore density or the smaller the pore size, the easier it is to provoke aneurysm occlusion. However, if the porosity is too small, it is possible to occlude side branches or perforators that may be jailed by the FD device. The development of FD devices has provided a feasible alternative for many wide necked complex aneurysms that were previously considered untreatable. The main drawbacks of this approach are that: a) the aneurysms are not immediately occluded, b) it requires antiplatelet therapy to prevent thrombus formation within the device, c) FD devices are difficult to use in bifurcation aneurysms as one branch will be jailed.
Thus, in recent years, new intra-saccular flow diverting devices have been developed [3,4]. These devices which look like cylindrical or spherical wire meshes are implanted within the aneurysm cavity with the aim of disrupting the inflow jet and induce aneurysm thrombosis and occlusion. They have been specifically designed for bifurcation aneurysms [5] and since they are deployed within the aneurysm, do not require antiplatelet therapy [2]. No antiplatelet therapy not only implies reduced risks of complications for the patient, but also that unlike endoluminal flow diverters, ruptured aneurysms can also be treated with this approach. Initial studies showed the feasibility [3,4] and more recently the efficacy and safety of intra-saccular devices [6,7]. However, these studies also indicated that not all aneurysms were adequately occluded, and that favorable results depend on the aneurysm location [3,6,8].
Similarly to endoluminal FD devices, intra-saccular devices do not always produce an immediate occlusion of the aneurysm, and some aneurysms remain patent for a long time and require re-treatment with other device. Computational fluid dynamics (CFD) has been used to analyze the effects of FD devices on the aneurysm hemodynamics [9–12] and to relate them to long term outcomes of FD procedures [13,14]. These studies suggest that the intra-aneurysmal hemodynamic conditions created immediately after FD implantation could be used to understand and assess the future outcome of the procedures. Similarly, we hypothesize that flow conditions after implantation of intra-saccular devices could help understanding which aneurysms will immediately thrombose and which ones will remain patent for a long time and may eventually need re-treatment. To the best of our knowledge, only one previous study has used CFD to analyze IA treatment with intra-saccular devices [15]. In that previous study the authors performed CFD simulations without the devices (i.e. pre-treatment configuration) and suggested an association between the aneurysm inflow ratio (pre-treatment) to compression of the intra-saccular device.
The simulation of blood flows in cerebral aneurysms in the presence of endovascular (both endoluminal or intra-saccular) devices is challenging because it requires: a) realistic deployment of devices within patient-specific vascular models, and b) meshing and resolving the thin device wires and gaps between the devices and the vascular wall. Several studies have reported on methods and techniques for deployment and CFD modeling of endoluminal FD devices [15–17], but we could not find studies describing methods for modeling intra-saccular devices. The purpose of this article is to describe techniques and tools recently developed to model IA hemodynamics after implantation of intra-saccular devices.
Methods
Patient-Specific Image-Based Vascular Modeling
Patient-specific vascular models are reconstructed from 3D rotational angiography (3DRA) images acquired prior to aneurysm treatment. Images were obtained with a Philips Bi-Plane 3DRA Scanner and reconstructed with isotropic voxel size of 0.25mm. Previously described methods are used to build geometric models of the aneurysm and connected vessels from the 3D images [18]. For subsequent application of inflow boundary conditions, the entire portion of the parent artery visible in the 3DRA images is reconstructed, typically extending proximally to the cavernous internal carotid artery (ICA) in the anterior circulation or the vertebral arteries (VA) in the posterior circulation. Vessels are truncated perpendicularly to their axis and the surface triangulations are smoothed using a non-shrinking algorithm to eliminate noise [19]. Using an advancing front method, unstructured isotropic grids composed of tetrahedral elements are generated with a maximum element size of 0.2 mm, and at least 10 points across any vessel diameter. These meshes contain typically between 2 and 5 million elements and represent the vascular domain before treatment with endovascular devices.
Image-Guided Virtual Deployment of Intrasaccular Devices
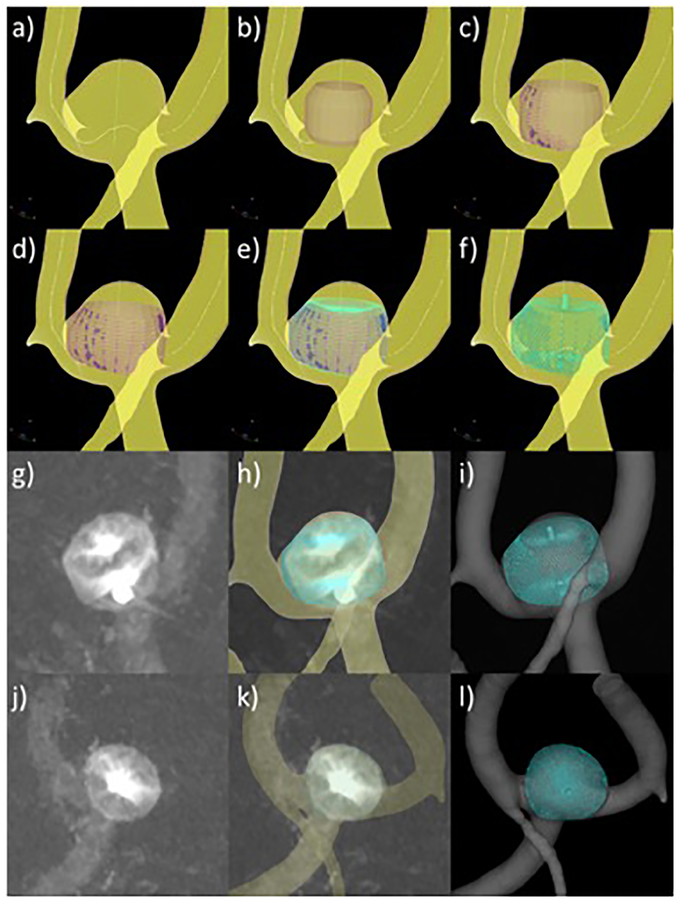
A new tool called cheDeploy has been created for deploying models of intra-saccular devices within a reconstructed vascular model. This new tool is an adaptation of a previously developed tool for virtual deployment of intra-vascular devices within reconstructed vascular models [20]. As before, this tool does not simulate the deployment procedure but it allows the user the generation and manual placement of intra-saccular flow diverting devices within reconstructed vascular models (generation of testing scenarios). The virtual deployment procedure is composed of the following steps (see Figure 1). First, the vascular model and vessel skeleton (obtained via VMTK Centerlines) are loaded into the software (a). Second, a cylindrical surface triangulation is created from the parent artery skeleton towards the interior of the aneurysm (b). The modeler, then interactively rotates and translates this cylindrical surface to the desired orientation. Next, the cylindrical surface is expanded radially under the influence of radial forces and contact forces with the vascular model (c), until it comes in contact with the vascular walls or reaches the specified device dimension (d). Radial forces are computed as spring-like forces between the cylinder’s centerline and points of the cylindrical surface such that the force is zero when the distance is equal to the specified device dimension (radius). Contact forces are applied when points of the cylindrical surface come in contact (penetration distance greater than zero) with the vascular wall, in which case they are fixed to the wall to prevent tangential displacements that can cause distortions of the cylindrical surface. The radial expansion step finishes when all the points of the cylindrical surface are either fixed to the vasculature wall or they have reach the specified device dimension. Next, a model of the device is created as a series of wires modeled as a mesh of two dimensional segment elements and mapped onto the expanded cylindrical surface (e). The device wire segments are then discretized as a series of overlapping spheres with diameter equal to the wire thickness. Virtual markers, again modeled as a series of overlapping spheres, are then added to the device model mimicking the actual markers of the intra-saccular devices (f). The modeler then loads one or more 2D angiography images showing the implanted device from different projection views (g, j). The vascular and the device models are then rendered together with the angiography image using transparency. The vascular model is then interactively aligned and oriented with the aneurysm and vessels visible in the angiography images (h, k). Then, the modeler interactively rotates and translates the device model until the virtual markers coincide with the markers visible in the angiographies from all loaded views. Once the virtual device is placed at the desired location, the device model is re-generated by re-running steps (c) through (f). Matching markers in two independent 2D projections ensures the correct positioning and orientation of the device in its final configuration in 3D (i, l).
Figure 1:
Intrasaccular flow diverter deployment process: a) vessel skeleton extraction, b) cylindrical surface initialization and orientation, c) cylindrical surface expansion, d) expanded cylindrical surface, e) device mapping on cylindrical surface, f) virtually deployed device with markers, g) DSA image of actual device after deployment – view 1, h) superposition of virtual device and DSA image, matching markers – view 1, i) final device model after deployment – view 1, j) DSA image of actual device after deployment – view 2, k) superposition of virtual device and DSA image, matching markers – view 2, l) final device model after deployment – view 2.
In order to illustrate and evaluate the methodology, four patients with intracranial aneurysms treated with three different types of intra-saccular devices were selected for study. The devices used were three different designs of the Woven EndoBridge Aneurysm Embolization Device (WEB, Sequent Medical, CA). The different designs were: a) single layer (SL): 144 wires, 80° braid angle, 25μm wire thickness; b) dual layer (DL): 2× 144 wires, 80° braid angle, 19μm wire thickness outer layer, 38μm wire thickness inner layer; and c) single layer spherical (SLS): 144 wires, 80° braid angle, 25μm wire thickness. In the case of the DL, for device diameters smaller than 8mm the number of wires in each layer is 108 instead of 144.
Pre-Treatment Hemodynamics Modeling
Blood flow was modeled with the unsteady incompressible Navier-Stokes equations, which were solved numerically using finite elements and a fully implicit formulation [18]. Pulsatile flow conditions were prescribed at the ICA inlet using the Womersley velocity profile and flow waveforms derived from phase-contrast MR measurements in normal subjects and scaled with a power of the inflow vessel area [21,22]. Blood was approximated as a Newtonian fluid and vessel walls were approximated as rigid. Outflow boundary conditions consistent with Murray’s principle of minimum work were prescribed at the model outlets [23].
Simulations were carried out for two cardiac cycles using a constant time-step size and 100 time-steps per cycle and results from the second cycle were saved for flow analysis [24]. To characterize the intra-aneurysmal hemodynamic environment, the aneurysm neck was interactively delineated by selecting points along the neck and connecting them along a closed geodesic path. The orifice of the aneurysm was triangulated using this path as boundaries. The orifice triangulation was then used to label elements in the aneurysm and vessel regions. The following quantities were then computed by integration over the aneurysm region and averaging over time [25]: a) mean inflow rate into the aneurysm (Q), b) mean aneurysm kinetic energy (KE), c) mean aneurysm shear rate (SR), d) mean aneurysm velocity (VE), e) mean aneurysm vorticity (VO), f) mean aneurysm viscous dissipation, and g) mean aneurysm wall shear stress (WSS). Of these computed quantities, mean inflow rate into the aneurysm and mean aneurysm velocity were previously associated with occlusion rates in aneurysms treated with endoluminal flow diverters [26], as well as in studies connecting changes in the mean aneurysm flow amplitude (MAFA) and occlusion after treatment [27]. Therefore in this study we focused the analysis primarily on these two variables.
Post-Treatment Hemodynamics Modeling
In order to solve the Navier-Stokes equations in the presence of endovascular devices, an immersed boundary strategy based on unstructured grids was used. This approach was previously developed for modeling endoluminal flow diverting (FD) devices, i.e. stents [28]. In this approach, the edges of mesh elements cut by the surface of the endovascular device are identified and new zero-velocity boundary conditions are introduced at the intersection points. The use of overlapping spheres to model the device wires makes this step particularly simple as the intersection between a segment and a sphere is quite easy to calculate. The main advantage of an immersed boundary approach is that it is able to deal with any complex device geometry which may be in contact with or form very small gaps with the vascular walls without the need to generate a new body-conforming mesh. However, it does require local mesh refinement to adequately resolve the device wires. In previous studies [28] analyzing the flow modification due to endoluminal devices, we determined that because of the low Reynolds number based on the wire diameter and aneurysm inflow velocity, most of the flow modification effects of these devices were captured by locally refining the meshes to obtain approximately between 3–5 mesh points across the diameter of the device wire. Although this process is entirely automatic, the resulting meshes are quite large and the computational cost is high. Typical meshes for post-treatment simulation of intra-saccular devices contain approximately between 100 and 200 million elements. Nevertheless, it is our preferred choice of method because it allows us to conduct many runs with minimal user intervention.
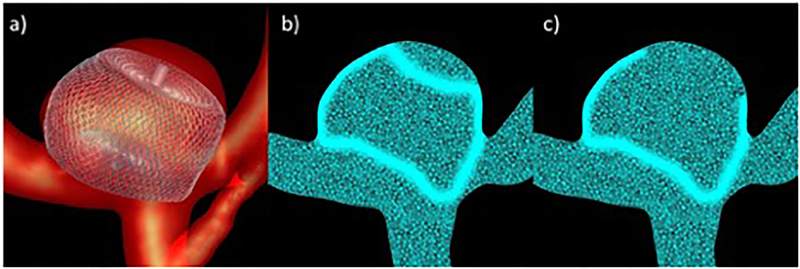
Because of the large grids generated by local refinement of elements crossed by the device wires, a second refinement strategy was explored. Specifically, the mesh was only refined around the wires near the aneurysm orifice and side walls, but not towards the dome of the aneurysm, where the flow is expected to be very low and not affect substantially the inflow and intrasaccular hemodynamic characteristics. The “full” and “partial” mesh refinement strategies are illustrated in Figure 2. This figure shows the vascular model with the implanted device (a), a cut-plane of the mesh obtained with the “full” mesh refinement strategy (b), and a cut-plane of the mesh obtained with the “partial” mesh refinement approach (c). Thus, the post-treatment hemodynamics of each case was simulated twice, using the full and partial mesh refinement strategies, and the corresponding results were compared to determine whether the partial refinement approach yields adequate results at a lower computational cost.
Figure 2:
Adaptive mesh refinement strategies: a) device model deployed within vascular model, b) mesh refinement around entire device, c) partial mesh refinement.
Results
Virtual Deployment Methodology
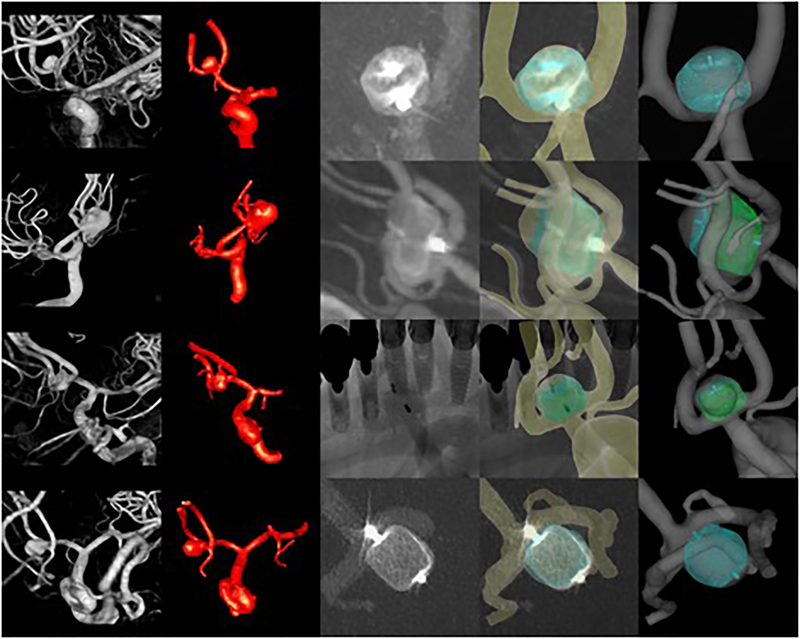
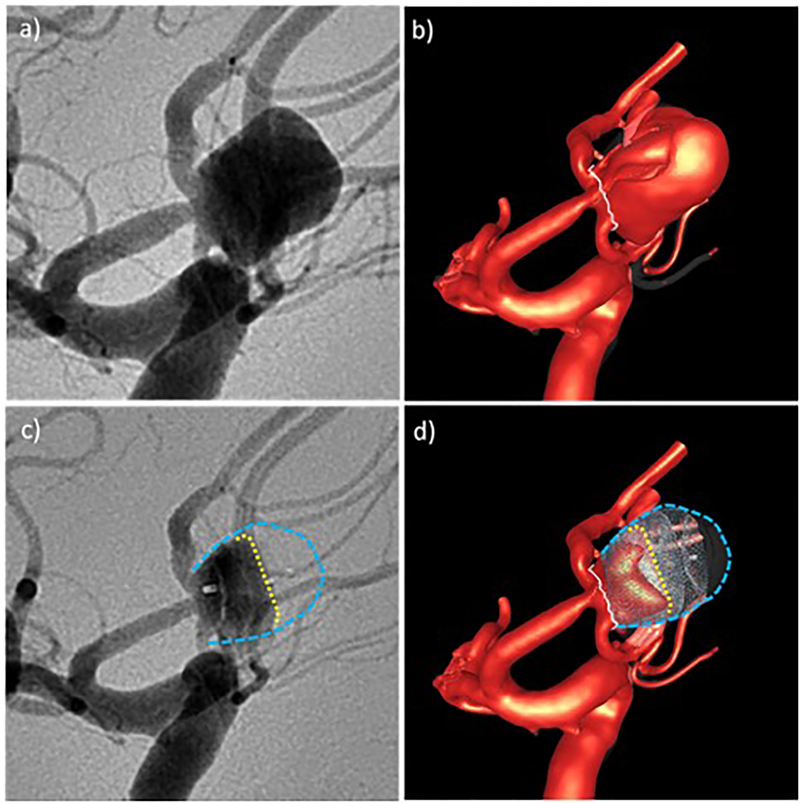
The methodology for modeling IA hemodynamics after implantation of intra-saccular devices is illustrated with data from four patients treated with different intra-saccular devices. Patient, aneurysm and device characteristics along with follow-up information are presented in Table 1. The corresponding vascular and device models are shown in Figure 3. This figure shows from left to right the 3D rotational images used to build the vascular models, the reconstructed vascular models including the aneurysm and connected vessels, the 2D angiography images used for image-guided virtual device deployment, the vascular and device models superposed to the 2D angiography images showing in general good matching between the real and virtual markers and the contours of the devices, and the final device model deployed within the vascular model. In aneurysm 4 (bottom row), the shape of the virtual device and the actual device do not perfectly coincide. The virtually deployed device has a more rounded shape whereas the real device looks more cylindrical in the DSA image. This difference may be related to the details of the single-layer-spherical device used in this case which corresponds to a truncated sphere.
Table 1.
Patient, aneurysm and device characteristics. ACOM=anterior communicating artery, SL=single layer, DL=double layer, SLS=single layer spherical. Outcomes: A=complete occlusion, C=incomplete occlusion with filling of first chamber, D=incomplete occlusion with filling of first and second chamber. Aneurysms and devices sizes are given as Length times Width (LxW) in millimeters.
| patient | aneurysm | device | follow up | ||||||
|---|---|---|---|---|---|---|---|---|---|
| n | id | sex | age | location | size [LxW] | type | size [LxW] | time | outcome |
| 1 | eweb007 | M | 55 | ACOM | 6×4 [mm] | SL | 6×3 [mm] | 6mo | A |
| 2 | eweb029 | F | 71 | ACOM | 9×8 [mm] | DL | 9×7 [mm] | 15mo | D |
| 3 | eweb034 | F | 68 | ACOM | 7×4 [mm] | DL | 6×3 [mm] | 6mo | C |
| 4 | eweb036 | F | 79 | ACOM | 5.5×5 [mm] | SLS | 6×4.6 [mm] | N/A | N/A |
Figure 3:
Four cases (rows) treated with different intrasaccular devices. From left to right columns show: 3D angiography images, reconstructed vascular models, 2D angiographic images after deployment of the devices, superposition of virtual devices and vascular model on 2D angiographic images, vascular model and deployed device model.
Full and Partial Mesh Refinement Strategies
Quantitative results of pre- and post-treatment simulations are presented in Table 2. For the post-treatment configuration results obtained with the full and partial mesh refinement strategies are presented, along with their relative difference. The partial mesh refinement strategy was able to produce post-treatment results consistent with the full refinement approach with differences below 5% for most variables, most importantly inflow rate (Q) and mean velocity (VE). For some variables such as mean wall shear stress (WSS), vorticity (VO), and shear rate (SR), the differences were larger, reaching values around 20%.
Table 2.
Hemodynamic variables before (pre) and after (post) device deployment and difference between post-treatment values obtained with full and partial mesh refinement strategies.
| case | run | Q | KE | SR | VE | VO | VD | WSS |
|---|---|---|---|---|---|---|---|---|
| (ml/s) | (erg) | (1/s) | (cm/s) | (1/s) | () | (dyne/cm2) | ||
| eweb007 | pre | 0.818 | 119.70 | 161.23 | 8.53 | 229.27 | 418.83 | 16.05 |
| post-full | 0.125 | 1.75 | 35.20 | 0.80 | 39.10 | 133.10 | 2.21 | |
| post-partial | 0.126 | 1.83 | 32.57 | 0.81 | 37.16 | 140.28 | 2.76 | |
| difference | 0.6% | 4.5% | 7.5% | 1.5% | 5.0% | 5.4% | 25.3% | |
| eweb029 | pre | 1.930 | 470.61 | 231.33 | 14.19 | 332.65 | 1393.21 | 28.28 |
| post-full | 1.705 | 30.47 | 54.33 | 1.56 | 67.20 | 746.25 | 4.48 | |
| post-partial | 1.706 | 30.87 | 44.66 | 1.52 | 55.57 | 722.94 | 4.37 | |
| difference | 0.0% | 1.3% | 17.8% | 3.0% | 17.3% | 3.1% | 2.3% | |
| eweb034 | pre | 3.328 | 1620.76 | 586.58 | 33.99 | 844.93 | 5678.32 | 81.06 |
| post-full | 0.817 | 40.92 | 106.32 | 2.75 | 128.35 | 1537.34 | 10.15 | |
| post-partial | 0.815 | 42.37 | 92.77 | 2.65 | 111.85 | 1500.84 | 9.82 | |
| difference | 0.2% | 3.6% | 12.7% | 3.8% | 12.9% | 2.4% | 3.2% | |
| eweb036 | pre | 1.116 | 292.82 | 216.46 | 12.70 | 325.33 | 1107.48 | 29.24 |
| post-full | 0.588 | 56.26 | 99.70 | 5.07 | 138.62 | 443.81 | 7.76 | |
| post-partial | 0.589 | 55.75 | 108.21 | 5.08 | 148.76 | 542.86 | 9.40 | |
| difference | 0.2% | 0.9% | 8.5% | 0.1% | 7.3% | 22.3% | 21.1% |
The relative changes (reductions) from the pre- to the post-treatment configurations obtained with both refinement strategies and their differences are presented in Table 3. It can be seen that the differences in the changes from the pre-treatment configuration between the two refinement strategies is quite small, with typical values below 5% (except for VD and WSS in the last aneurysm). Furthermore, the changes in inflow rate and mean velocity computed by both strategies were in very good agreement, with a difference below 1%.
Table 3.
Reductions (Δ) of hemodynamic variables with respect to their pre-treatment value, obtained with full and partial mesh refinement strategies, and their difference.
| case | run | ΔQ | ΔKE | ΔSR | ΔVE | ΔVO | ΔVD | ΔWSS |
|---|---|---|---|---|---|---|---|---|
| eweb007 | full | 84.7% | 98.5% | 78.2% | 90.6% | 82.9% | 68.2% | 86.3% |
| partial | 84.6% | 98.5% | 79.8% | 90.5% | 83.8% | 66.5% | 82.8% | |
| difference | 0.1% | 0.1% | 1.6% | 0.1% | 0.8% | 1.7% | 3.5% | |
| eweb029 | full | 11.6% | 93.5% | 76.5% | 89.0% | 79.8% | 46.4% | 84.2% |
| partial | 11.6% | 93.4% | 80.7% | 89.3% | 83.3% | 48.1% | 84.5% | |
| difference | 0.0% | 0.1% | 4.2% | 0.3% | 3.5% | 1.7% | 0.4% | |
| eweb034 | full | 75.5% | 97.5% | 81.9% | 91.9% | 84.8% | 72.9% | 87.5% |
| partial | 75.5% | 97.4% | 84.2% | 92.2% | 86.8% | 73.6% | 87.9% | |
| difference | 0.0% | 0.1% | 2.3% | 0.3% | 2.0% | 0.6% | 0.4% | |
| eweb036 | full | 47.3% | 80.8% | 53.9% | 60.1% | 57.4% | 59.9% | 73.5% |
| partial | 47.3% | 81.0% | 50.0% | 60.0% | 54.3% | 51.0% | 67.8% | |
| difference | 0.1% | 0.2% | 3.9% | 0.1% | 3.1% | 8.9% | 5.6% |
The mesh sizes and timings of the post-treatment CFD simulations corresponding to the full and partial mesh refinement strategies are presented in Table 4. These results illustrate the CPU savings obtained with the partial refinement approach.
Table 4.
Mesh sizes (Nelem=number of elements) and running times for the post-treatment simulations using the full and partial mesh refinement strategies. Nproc=number of processors used in the parallel calculations using OpenMP in shared memory computers.
| case | refinement | Nelem | Nproc | time |
|---|---|---|---|---|
| eweb007 | full | 124 M | 18 | 16d22h |
| partial | 81 M | 12 | 11d16h | |
| eweb029 | full | 153 M | 18 | 18d15h |
| partial | 94 M | 10 | 11d21h | |
| eweb034 | full | 183 M | 10 | 20d9h |
| partial | 101 M | 10 | 8d23h | |
| eweb036 | full | 167 M | 10 | 20d5h |
| partial | 129 M | 20 | 15d3h |
Hemodynamics before and after Treatment
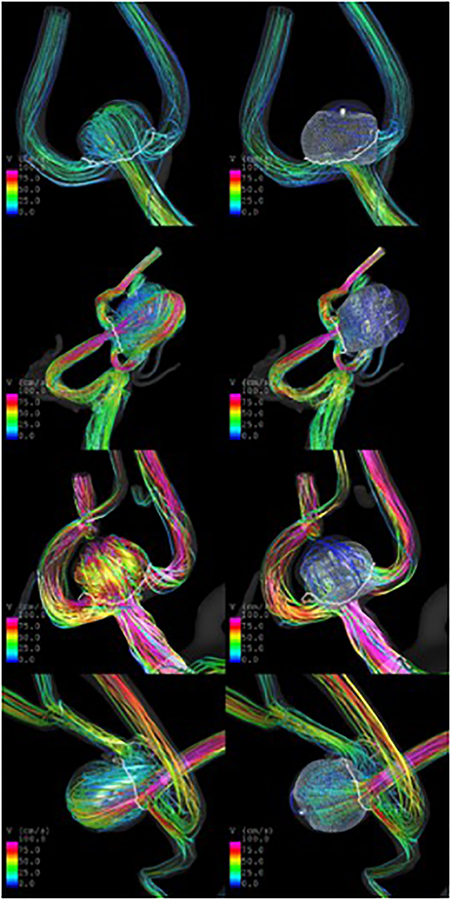
Visualizations of the pre- and post-treatment flow patterns at peak systole are presented in Figure 4. Qualitatively, aneurysm 1 (eweb007) had a diffuse inflow jet before treatment, that was substantially disrupted by the implantation of a SL device. In contrast, aneurysms 2 and 3 (eweb029 and eweb034) had much stronger and concentrated inflow jets before treatment, which although disturbed by the implantation of DL devices, resulted in persistent intra-aneurysmal flow after treatment. Similarly, aneurysm 4 (eweb036) had a strong inflow jet before treatment, which persisted although with reduced velocity, after implantation of a SLS device.
Figure 4:
Flows before (left column) and after (right column) implantation of intrasaccular flow diverters in four aneurysms treated with different intrasaccular devices.
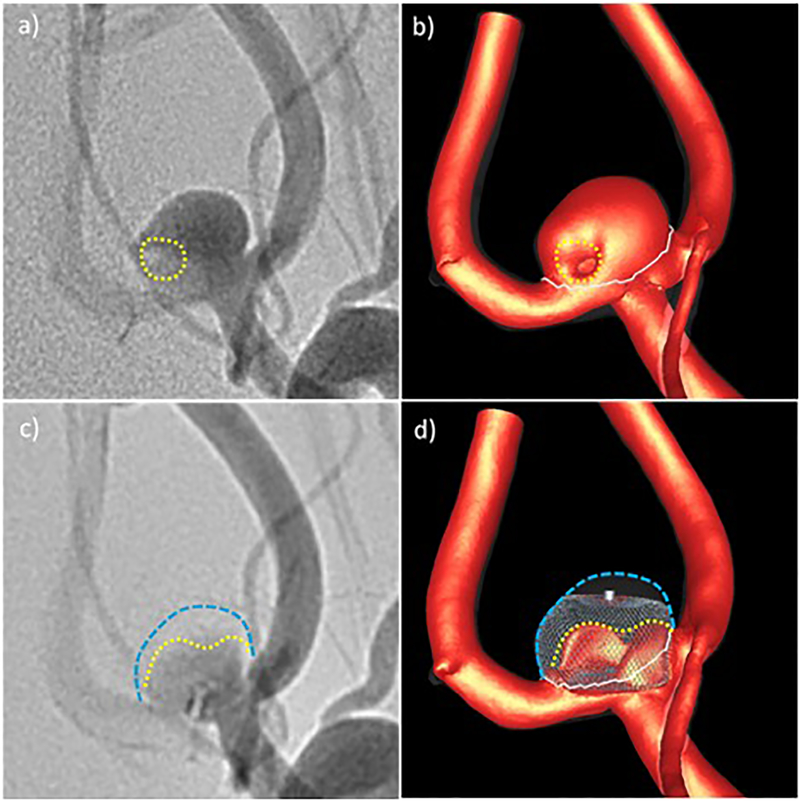
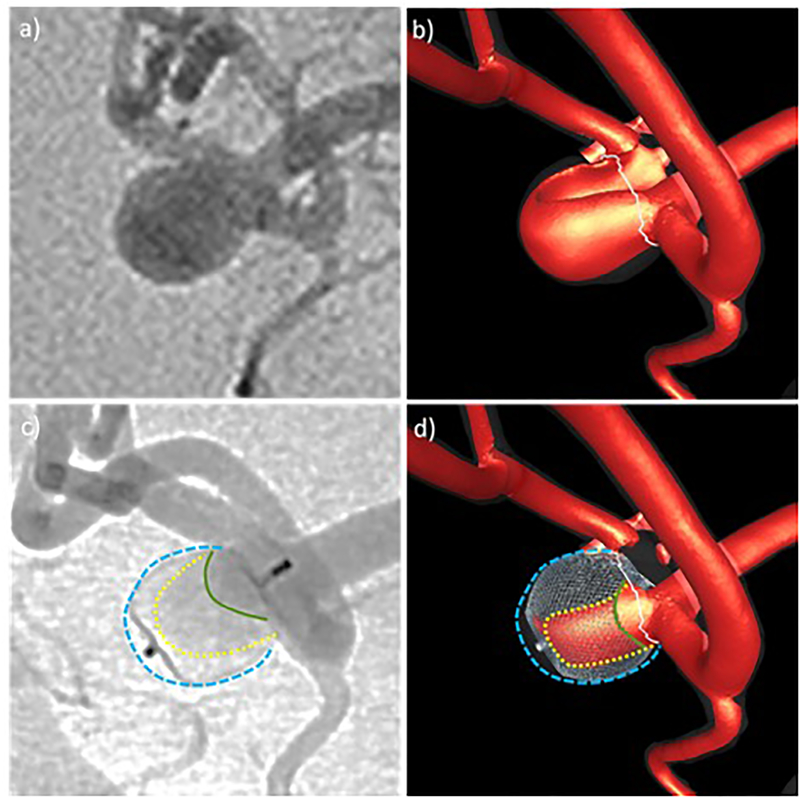
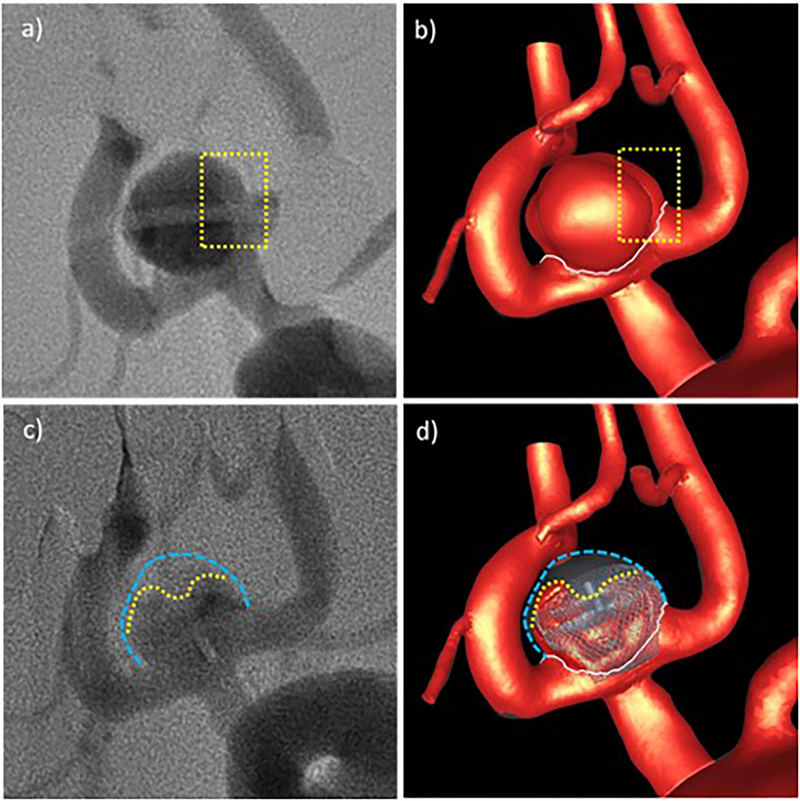
Visualizations of the inflow jets (at peak systole) before and after treatment as well as pre- and immediately post-implantation digital subtraction angiography (DSA) images are presented in Figure 5–8. The silhouettes of the aneurysms are delineated with blue dotted lines, and the intra-aneurysmal regions with relatively high-speed flow after treatment and the corresponding regions of the angiogram with increased contrast opacity are indicated with yellow dotted lines in the corresponding images, highlighting some of the observed similarities in the flow patterns. In general these results show good qualitative agreement between the CFD simulations and the in vivo flow structures observed in DSA.
Figure 5:
Qualitative comparison of CFD results and in vivo DSA angiograms before and after treatment for aneurysm 1: a) pre-treatment DSA – dotted line indicates region of low contrast, b) high speed flow before treatment – dotted line indicates region of low flow speed, c) post-treatment DSA – yellow line indicates region of higher contrast agent concentration towards the aneurysm inflow zone, d) high speed flow after treatment – yellow line indicates region of persistent high speed flow. Blue lines delineate the aneurysm wall.
Figure 8:
Qualitative comparison of CFD results and in vivo DSA angiograms before and after treatment for aneurysm 4: a) pre-treatment DSA, b) high speed flow before treatment, c) post-treatment DSA – yellow line indicates region of higher contrast agent concentration extending towards the aneurysm dome, green line shows region of even higher contrast agent concentration near the inflow zone, d) high speed flow after treatment – yellow line indicates region of persistent high speed flow, green line shows region of high speed flow towards the inflow zone. Blue lines delineate the aneurysm wall.
Hemodynamics and Treatment Outcomes
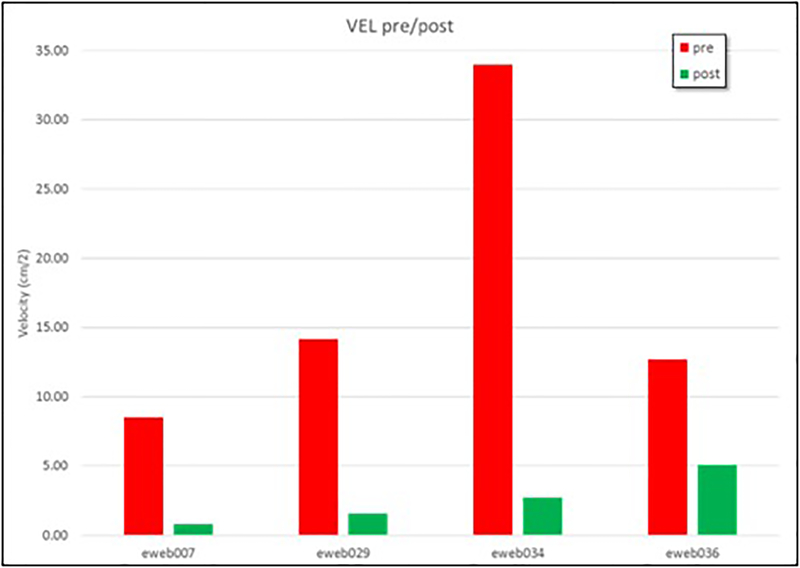
The treatment outcomes of the cases included in this study are presented in Table 1. Aneurysm 1 was completely occluded at 6 months, while aneurysms 2 and 3 were incompletely occluded at 6 months (aneurysm 2 continued to be incompletely occluded 15 months after treatment). Unfortunately, no follow up data was available for aneurysm 4. Mean aneurysm flow velocities before and after treatment are shown for all four aneurysms in Figure 9 (see also Table 2). Aneurysm 1, the one that was completely occluded at follow up, had the slowest flow before as well as after treatment. The other three aneurysms had larger aneurysm flow velocities both before and after treatment.
Figure 9:
Mean velocity before (red bars) and after (green bars) implantation of the intrasaccular devices in 4 intracranial aneurysms.
Discussion
Modeling the flow dynamics in cerebral aneurysms after the implantation of intra-saccular devices is important for understanding the relationship between flow conditions created immediately post-treatment and the subsequent outcomes. This information is valuable to identify which aneurysms will occlude immediately and which aneurysms will likely remain patent and would benefit from a different procedure or device. The current paper described methods and tools developed for the CFD modeling of hemodynamics in aneurysms treated with intra-saccular devices. No previous approaches were found in the literature.
Predicting the final configuration of an intra-saccular device within an aneurysm is extremely difficult because of all the subjective and uncontrolled maneuvers done by the interventionalist during the deployment of these devices. Therefore, we focused on simulating “scenarios” that mimic what was done by the physicians to treat aneurysms. Our virtual deployment process intends to match the location and orientation of the device using image-guidance and matching the device markers visible in DSA images acquired in one or two projections. This approach does not intend to exactly reproduce the final positioning of individual wires. This is equivalent to the virtual stent deployment approaches that do not intend to match the exact wire positions but rather to only mimic the device location and design characteristics. Analyzing these “scenarios” is thus useful to understand the outcomes of procedures or to predict the flow dynamics under different simulated conditions and device positioning.
To deal with complex device geometries with numerous thin wires and gaps between the wires and the vascular walls, our approach uses an immersed boundary method for unstructured grids. This approach is quite robust since it does not require the generation of a body-conforming mesh around the device wires and their contacts with the walls. However, it does require adaptive mesh refinement around the device wires, which is done automatically but typically results in very large meshes and a long calculation times.
Results obtained with the full and partial mesh refinement strategies were in good agreement for all devices, especially for inflow rate and mean aneurysm velocity, and their changes from the pre- to the post-treatment configurations. These results indicate that using the partial mesh refinement approach proposed here yields adequate results at a reduced the compute time. This is important for future studies based on CFD simulation of hemodynamics after intra-saccular device implantation in larger series of IAs.
Results from the CFD simulations and in vivo flow structures observed with angiography were in good qualitative agreement. This indicates that the described methodology is able to realistically represent the aneurysm hemodynamic environment both before and after implantation of intra-saccular devices of different kinds.
The aneurysm with a complete occlusion at follow up had a post-treatment mean velocity of 0.8 cm/s, while the two incompletely occluded at follow up had larger post-treatment mean velocities of 1.56 cm/s and 2.75 cm/s, respectively (see Table 2). These results are consistent with a previous analysis of intra-arterial flow diverting (FD) devices where a threshold of approximately 1.3 cm/s was identified as a discriminator between fast and slow occlusion after FD treatment [26]. This is an encouraging result that suggests that CFD may be useful to predict or understand the outcomes of intra-saccular treatments and different devices. This observations should be confirmed with larger sample sizes.
Interestingly, the mean velocity changes were similar for the three cases with known outcomes, approximately 90% reduction, even though aneurysm 1 was treated with a SL device while aneurysms 2 and 3 with DL devices. The reason why the DL devices produced similar changes to a SL device seems to be the fact that the DL devices were implanted in aneurysms with stronger flows. This suggest that the final hemodynamic environment created immediately after implantation of the devices may be more important to assess the likelihood of subsequent complete occlusion, not the change or reduction from the pre-treatment values. The final velocity values depend not only on the device characteristics but also on the pre-treatment conditions, which in turn depends on the parent artery and aneurysm geometry and location.
One limitation of this approach is that the positioning of the device within the vascular model is done interactively (and thus subjectively) by the operator. However, to minimize the variability of the results, in-vivo post-treatment images are used for guidance. A variability study should be considered in the future. In this paper we quantified the flow from the second simulated cardiac cycle. Previous studies [24] showed that when using Womersley inflow conditions with the implicit solver and timestep size used, averaged aneurysm flow variables such as mean velocity, inflow rate, WSS, etc. were already roughly unchanged between the second and third cycle in aneurysm cases with no endovascular devices implanted. However, it would be worth exploring further, if this remains the case for post-implantation simulations.
Conclusions
A new methodology for modeling the hemodynamics in intracranial aneurysms treated with intra-saccular flow diverting devices has been developed. This approach combines an image-guided virtual device deployment within patient-specific vascular models with an immersed boundary method on adaptive unstructured grids. The results obtained on a series of four cerebral aneurysms treated with different intra-saccular devices were in good qualitative agreement with angiographic observations. Promising results were obtained relating post-treatment flow conditions and outcomes of treatments with intra-saccular devices, which need to be confirmed on larger series.
Figure 6:
Qualitative comparison of CFD results and in vivo DSA angiograms before and after treatment for aneurysm 2: a) pre-treatment DSA, b) high speed flow before treatment, c) post-treatment DSA – yellow line indicates region of higher contrast agent concentration towards the aneurysm inflow zone, d) high speed flow after treatment – yellow line indicates region of persistent high speed flow. Blue lines delineate the aneurysm wall.
Figure 7:
Qualitative comparison of CFD results and in vivo DSA angiograms before and after treatment for aneurysm 3: a) pre-treatment DSA – yellow rectangle shows region with decreased contrast towards the right, b) high speed flow before treatment – yellow rectangle shows iso-velocity surface features that coincide with pre DSA contrast differences, c) post-treatment DSA – yellow line indicates region of higher contrast agent concentration towards the aneurysm inflow zone, d) high speed flow after treatment – yellow line indicates region of persistent high speed flow. Blue lines delineate the aneurysm wall.
Acknowledgements
This work was supported by NIH grant R01NS076491.
References
- 1.Jiang B, Paff M, Colby GP, Coon AL, Lin L-M. Cerebral aneurysm treatment: modern neurovascular techniques. Stroke and Vascular Neurology 2016; 1(3):93–100. doi: 10.1136/svn-2016-000027. [DOI] [PMC free article] [PubMed] [Google Scholar]
- 2.Rajah G, Narayanan S, Rangel-Castilla L. Update on flow diverters for the endovascular management of cerebral aneurysms. Neurosurgical Focus 2017; 42(6):E2. doi: 10.3171/2017.3.FOCUS16427. [DOI] [PubMed] [Google Scholar]
- 3.Ding YH, Lewis DA, Kadirvel R, Dai D, Kallmes DF. The Woven EndoBridge: a new aneurysm occlusion device. AJNR. American journal of neuroradiology 2011; 32(3):607–611. doi: 10.3174/ajnr.A2399. [DOI] [PMC free article] [PubMed] [Google Scholar]
- 4.Klisch J, Sychra V, Strasilla C, Liebig T, Fiorella D. The Woven EndoBridge cerebral aneurysm embolization device (WEB II): initial clinical experience. Neuroradiology 2011; 53(8):599–607. doi: 10.1007/s00234-011-0891-x. [DOI] [PubMed] [Google Scholar]
- 5.Pierot L, Biondi A. Endovascular techniques for the management of wide-neck intracranial bifurcation aneurysms: A critical review of the literature. Journal of Neuroradiology. Journal De Neuroradiologie 2016; 43(3):167–175. doi: 10.1016/j.neurad.2016.02.001. [DOI] [PubMed] [Google Scholar]
- 6.Behme D, Berlis A, Weber W. Woven EndoBridge Intrasaccular Flow Disrupter for the Treatment of Ruptured and Unruptured Wide-Neck Cerebral Aneurysms: Report of 55 Cases. AJNR. American journal of neuroradiology 2015; 36(8):1501–1506. doi: 10.3174/ajnr.A4323. [DOI] [PMC free article] [PubMed] [Google Scholar]
- 7.Muskens IS, Senders JT, Dasenbrock HH, Smith TRS, Broekman MLD. The Woven Endobridge Device for Treatment of Intracranial Aneurysms: A Systematic Review. World Neurosurgery 2017; 98:809–817.e1. doi: 10.1016/j.wneu.2016.11.020. [DOI] [PubMed] [Google Scholar]
- 8.Limbucci N, Leone G, Rosi A, et al. Endovascular Treatment of Unruptured Intracranial Aneurysms by the Woven EndoBridge Device (WEB): Are There Any Aspects Influencing Aneurysm Occlusion? World Neurosurgery 2018; 109:e183–e193. doi: 10.1016/j.wneu.2017.09.136. [DOI] [PubMed] [Google Scholar]
- 9.Augsburger L, Farhat M, Reymond P, et al. Effect of Flow Diverter Porosity on Intraaneurysmal Blood Flow. Clinical Neuroradiology 2009; 19:204–214. [DOI] [PubMed] [Google Scholar]
- 10.Ma D, Dargush GF, Natarajan SK, Levy EI, Siddiqui AH, Meng H. Computer modeling of deployment and mechanical expansion of neurovascular flow diverter in patient-specific intracranial aneurysms. Journal of Biomechanics 2012; 45:2256–63. doi: 10.1016/j.jbiomech.2012.06.013. [DOI] [PubMed] [Google Scholar]
- 11.Chong W, Zhang Y, Qian Y, Lai L, Parker G, Mitchell K. Computational Hemodynamics Analysis of Intracranial Aneurysms Treated with Flow Diverters: Correlation with Clinical Outcomes. AJNR Am J Neuroradiol 2013. doi: 10.3174/ajnr.A3790. [DOI] [PMC free article] [PubMed] [Google Scholar]
- 12.Huang Q, Xu J, Cheng J, Wang S, Wang K, Liu JM. Hemodynamic Changes by Flow Diverters in Rabbit Aneurysm Models: A Computational Fluid Dynamic Study Based on Micro-Computed Tomography Reconstruction. Stroke 2013. doi: 10.1161/strokeaha.113.001202. [DOI] [PubMed] [Google Scholar]
- 13.Cebral JR, Mut F, Raschi M, et al. Analysis of hemodynamics and aneurysm occlusion after flow-diverting treatment in rabbit models. AJNR Am J Neuroradiol 2014; 35:1567–73. doi: 10.3174/ajnr.A3913. [DOI] [PMC free article] [PubMed] [Google Scholar]
- 14.Karmonik C, Chintalapani G, Redel T, et al. Hemodynamics at the ostium of cerebral aneurysms with relation to post-treatment changes by a virtual flow diverter: A computational fluid dynamics study. Conf Proc IEEE Eng Med Biol Soc 2013; 2013:1895–8. doi: 10.1109/embc.2013.6609895. [DOI] [PubMed] [Google Scholar]
- 15.Caroff J, Mihalea C, Da Ros V, et al. A computational fluid dynamics (CFD) study of WEB-treated aneurysms: Can CFD predict WEB “compression” during follow-up? Journal of Neuroradiology. Journal De Neuroradiologie 2017; 44(4):262–268. doi: 10.1016/j.neurad.2017.03.005. [DOI] [PubMed] [Google Scholar]
- 16.Cito S, Geers AJ, Arroyo MP, et al. Accuracy and reproducibility of patient-specific hemodynamic models of stented intracranial aneurysms: report on the Virtual Intracranial Stenting Challenge 2011. Annals of Biomedical Engineering 2015; 43(1):154–167. doi: 10.1007/s10439-014-1082-9. [DOI] [PubMed] [Google Scholar]
- 17.Oeltze S, Lehmann DJ, Kuhn A, Janiga G, Theisel H, Preim B. Blood Flow Clustering and Applications in Virtual Stenting of Intracranial Aneurysms. IEEE transactions on visualization and computer graphics 2014; 20(5):686–701. doi: 10.1109/TVCG.2013.2297914. [DOI] [PubMed] [Google Scholar]
- 18.Cebral JR, Castro MA, Appanaboyina S, Putman CM, Millan D, Frangi AF. Efficient pipeline for image-based patient-specific analysis of cerebral aneurysm hemodynamics: Technique and sensitivity. IEEE Trans Med Imag 2005; 24:457–467. [DOI] [PubMed] [Google Scholar]
- 19.Taubin G A signal processing approach to fair surface design. In: 1995:351–358. [Google Scholar]
- 20.Mut F, Löhner R, Putman CM, Cebral JR. Effects of foreshortening and oversizing of flow diverting stents for intracranial aneurysms. 2010. [Google Scholar]
- 21.Taylor CA, Hughes TJR, Zarins CK. Finite element modeling of blood flow in arteries. Comp Meth App Mech Eng 1998; 158:155–196. [Google Scholar]
- 22.Cebral JR, Castro MA, Putman CM, Alperin N. Flow-area relationship in internal carotid and vertebral arteries. Physiol Meas 2008; 29:585–594. [DOI] [PMC free article] [PubMed] [Google Scholar]
- 23.Painter PR, Eden P, Bengtsson HU. Pulsatile blood flow, shear force, energy dissipation and Murray’s Law. Theor Biol Med Model 2006; 3:31. doi: 10.1186/1742-4682-3-31. [DOI] [PMC free article] [PubMed] [Google Scholar]
- 24.Cebral JR, Duan X, Gade PS, et al. Regional Mapping of Flow and Wall Characteristics of Intracranial Aneurysms. Annals of Biomedical Engineering 2016; DOI 10.1007/s10439-016-1682-7. doi: 10.1007/s10439-016-1682-7. [DOI] [PMC free article] [PubMed] [Google Scholar]
- 25.Mut F, Löhner R, Chien A, et al. Computational hemodynamics framework for the analysis of cerebral aneurysms. Int J Num Meth Biomed Eng 2011; 27:822–839. [DOI] [PMC free article] [PubMed] [Google Scholar]
- 26.Mut F, Raschi M, Scrivano E, et al. Association between hemodynamic conditions and occlusion times after flow diversion in cerebral aneurysms. J Neurointerv Surg 2015; 7:286–90. doi: 10.1136/neurintsurg-2013-011080. [DOI] [PubMed] [Google Scholar]
- 27.Pereira VM, Bonnefous O, Ouared R, et al. A DSA-Based Method Using Contrast-Motion Estimation for the Assessment of the Intra-Aneurysmal Flow Changes Induced by Flow-Diverter Stents. AJNR Am J Neuroradiol 2013; 34(3):805–815. doi: 10.3174/ajnr.A3322. [DOI] [PMC free article] [PubMed] [Google Scholar]
- 28.Appanaboyina S, Mut F, Löhner R, Putman CM, Cebral JR. Computational Fluid Dynamics of Stented Intracranial Aneurysms using Adaptive Embedded Unstructured Grids. Int J Num Meth Fluids 2008; 57:457–493. [Google Scholar]


