

Abstract
Efficient and timely delivery of vaccine antigens to the secondary lymphoid tissue is crucial to induce protective immune responses by vaccination. However, determining the longitudinal biodistribution of injected vaccines in the body has been a challenge. Here, we report that near-infrared (NIR) fluorescence imaging can efficiently enable the trafficking and biodistribution of vaccines in real time. We conjugated zwitterionic NIR fluorophores on the surface of model vaccines and tracked the fate of bioconjugated vaccines after intradermal administration. Using a NIR fluorescence imaging system, we were able to carry out time-course imaging of vaccine trafficking through the lymphatics, observing notable uptake in lymph nodes with minimal nonspecific tissue interactions. Flow cytometry analysis confirmed that the uptake in lymph nodes by antigen presenting cells was highly dependent on the hydrodynamic diameter of the vaccines. These results demonstrate that the combination of a real-time NIR fluorescence imaging system and zwitterionic fluorophores is a powerful tool to determine the fate of vaccine antigens. Since such nonspecific vaccine uptake causes serious adverse reactions, this method is not only useful for optimization of vaccine design, but also for safety evaluation of clinical vaccine candidates.
Keywords: Near-infrared imaging, zwitterionic fluorophore, biodistribution, vaccine, hydrodynamic diameter
Graphical Abstract
Biodistribution of vaccines is reliably monitored using a renal clearable zwitterionic near-infrared fluorophore with a high signal-to-background ratio in vivo. The size-dependent transportation of vaccine from injection sites to the secondary lymphoid tissues is reproducibly described using a multispectral near-infrared imaging platform, showing the applicability of this approach to optimize formulation and evaluate the safety of vaccines.
1. Introduction
Vaccination is one of the most successful medical interventions for preventing pandemic infectious diseases.[1] Efficient and timely delivery of vaccine antigens to the secondary lymphoid tissue is critical to induce a protective immune response against pathogens with vaccine.[2]. However, a critical piece of information on biodistribution and dynamics of the injected vaccine antigen upon various routes of administration, which dictates the successful delivery of vaccine antigens to the secondary lymphoid tissue,[3] are not fully characterized due to the lack of an optimal imaging tool.[4] Establishment of such a reliable and reproducible trafficking method with quantitative assessment of vaccine antigen is therefore desirable optimize the formulation of clinical vaccines. However, there are insufficient methodologies that determine the longitudinal biodistribution of injected vaccine antigens in vivo, as most studies focus on monitoring only immune cell behavior[5].
In addition, the physicochemical properties of vaccine including size and surface charges changes the mode of delivery, which strongly influence on the subsequent adaptive immune responses, especially with skin-resident antigen presenting cells (APCs).[6] For example, fluorescent polystyrene beads ranging from 500 to 2,000 nm have been mostly associated with migratory dendritic cells (migDCs), whereas small particles ranging from 20 to 200 nm were associated with classical DCs (cDCs) and macrophages in lymph nodes (LNs),[7] suggesting that smaller particles are freely drained into the lymphatics. Kang et al. further optimized the size of a model vaccine for induction of CD8+ T cell responses using a series of ovalbumin (OVA) conjugates sized between 10 and 33 nm in hydrodynamic diameter (HD).[8] Considering that the actual size of pathogens ranges from 10 nm to several micrometers in diameter[9] with various physicochemical properties into account, a robust model system to faithfully replicate a clinical vaccine is desired.
To tackle this challenge, we have developed a near-infrared (NIR), zwitterionic fluorophore that has shown great promise and potential in monitoring the in vivo behavior of biomolecules when combined with tissue-specific NIR fluorophores.[10]. Since NIR light penetrates into biological tissues with reduced scattering and absorption compared to visible light, it offers high resolution imaging of deep tissue structures.[11] NIR fluorophores including commercially available indocyanine green (ICG) have previously been used for intraoperative visualization of sentinel LNs under the multispectral fluorescence imaging systems.[12] Particularly, zwitterionic (ZW) ultrasmall fluorophores including ZW700–1[13] and ZW800–1[14] have a number of advantages over the classical organic dyes. First, zwitterionic molecules minimally interact with biological tissues and therefore offer high signal-background ratio (SBR) with ultralow background.[15] Second, the polymethine structure permits further conjugation with biomolecules via conventional N-hydroxysuccinimide (NHS) ester chemistry[16]. Lastly, the small size of ZW fluorophores do not interfere with cell mobility or other biological activities significantly, resulting in rapid renal clearance and low toxicity.[11a] Because of these advantages, ZW fluorophores can be used to monitor biodistribution and clearance of chemotherapeutic drugs and cytokines.[16c, 17]
Here we report a new imaging strategy to monitor the fate of model vaccines noninvasively after conjugation with ZW fluorophores using an intraoperative NIR fluorescence imaging system. We performed image analysis of vaccine trafficking along with flow cytometry study to validate the quantitative biodistribution of NIR fluorescence images and assess biological interactions between the vaccine and immune cells.
2. Results
2.1. Conjugation of ZW800–1C on model vaccines
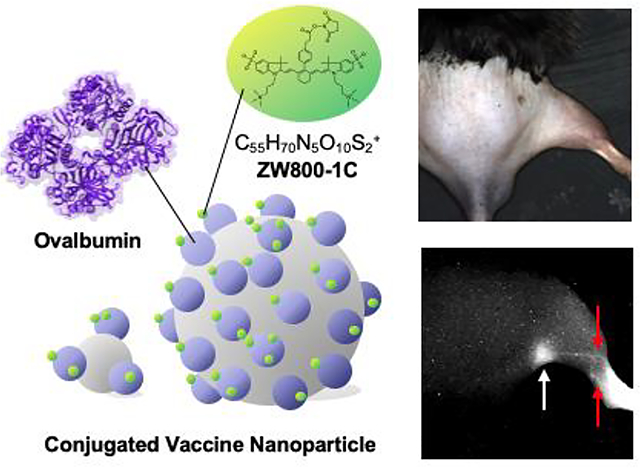
To visualize the biodistribution and trafficking of vaccine, we first chose the zwitterionic fluorophore ZW800–1C to label on a widely-used model vaccine, OVA protein. ZW800–1C is an NIR fluorophore with an excitation peak at 753 nm and an emission peak at 772 nm, respectively[18] and features minimal fluorophore-tissue interactions.[14, 16a] These characteristics allow the conjugated vaccine to distribute independently from the fluorophore. As shown in Figure. 1A, the NHS ester form of ZW800–1C (ZW800–1C NHS) was prepared and conjugated with OVA to yield the bioconjugated OVA-ZW800–1C (OVA-ZW). Next, we further conjugated OVA-ZW on two differently sized silica nanoparticles (SiNP-20 nm and SiNP-100 nm) because it is known that the size of vaccine is one of the key factors to determine its movement from skin into draining LNs after intradermal injection.[2c] After purification using membrane filtration columns, the average HD of SiNP-conjugated with OVA-ZW (ONP) was measured by dynamic light scattering, which was found to be 183.1 ± 2.1 nm and 277.2 ± 1.6 nm for ONP1 and ONP2, respectively (Figure 1B,C). The average dye-labeling ratio on each NP was determined to be 4.7 and 205 for ONP1 and ONP2, respectively, calculated by using UV-Vis spectrophotometer (Figure. S1A,B, Supporting Information).
Figure 1.

Preparation of model vaccines using NIR fluorescent ZW800–1C. a) A schematic drawing of bioconjugation. ZW800–1 NHS ester (ZW) was conjugated on OVA (OVA-ZW) in PBS, pH 8.0, followed by further conjugation on SiNPs in DIW. b,c) The average HD of each ONP before and after conjugation was measured by DLS. d) Time-course SBR in serum-containing media confirms the physicochemical and optical stability of ONPs. The fluorescence signal was measured by the FLARE NIR fluorescence imaging system (n = 3, mean ± SEM.). A P value of less than 0.05 was considered significant: N.S., not significant by one-way ANOVA. SEM, the standard error of the mean; ANOVA, analysis of variance.
To determine the dynamic range of fluorescence signals, a serial dilution of OVA-ZW solution was prepared in serum-containing media and imaged under the dual-channel (FLARE™) imaging system.[12a],[12b] A linear relationship was observed between the fluorescence emission of ONPs and their concentrations from 20 nM to 50 μM, indicating that a wide range of vaccine concentrations can be evaluated quantitatively and accurately on the FLARE system (Figure. S1C, Supporting Information). Images of the ONPs captured by transmission electron microscope (TEM) also revealed that the ONPs were homogenous in size after the conjugation and evenly distributed in the solution without significant aggregation (Figure S1D,E, Supporting Information).
We further assessed the stability of OVA-ZW in a biological setting. We incubated OVA-ZW in PBS containing 10% serum over 72 h at pH 7.4 and 37 °C. The fluorescence signal was stable over the entire period of incubation (Figure. 1D). This result demonstrates that the conjugated vaccine has stable optical properties in a physiological condition.
2.2. Size-dependent accumulation of vaccines in LNs
Small vaccine antigens directly enter the lymphatics and reach the draining LNs within 30 min,[2a] while larger antigens taken up by DCs arrive in the draining LNs slowly over 24 h after skin vaccination.[2a] We therefore hypothesized that the accumulation of fluorescence signals would be dependent on the size of ONPs. We chose to use an intradermal injection model in the footpad because the lymphatic flow is well characterized and this model is suitable for time-course monitoring of vaccine trafficking[7]. To test our hypothesis, we measured the fluorescence signal in real-time upon the intradermal injection of different sized model vaccines in the footpad of mice (Figure. S2, Supporting Information). The signal in the popliteal LN injected with OVA-ZW showed a rapid increase in 1 h post-intradermal injection and retained a high level until 6 h post-injection, followed by gradual decrease (Figure. 2). In contrast, ONP1 and ONP2 accumulated into the draining LNs steadily over 72 h post-injection. The fluorescence signal intensity at early time points was significantly higher in the OVA-ZW group compared to ONP1 or ONP2 at 1–6 h post-injection (Figure. 2A,B P < 0.0001). Since the brightness of each model vaccine was variable despite the same injection dose, the SBR values were converted to concentrations based on the labeling ratio (Figure. 2C). The concentration of OVA-ZW in the popliteal LN was significantly higher than that of ONP1 or ONP2 over 72 h (P < 0.01). Interestingly, the largest ONP2 (277 nm) showed lowest concentrations at the LN over the time course, representing that the concentration in the draining LNs is inversely proportional to the HD of model vaccines after intradermal injection (Figure. 2C).
Figure 2.

Quantitative image analysis of vaccine trafficking in the draining LNs. Trafficking of the model vaccines into draining LNs was monitored on the FLARE system and evaluated by image analysis. a) Representative images of mice 0, 1, 6, 24, 48 and 72 h post-injection with model vaccines. Insets show magnified pseudocolor images of popliteal LNs. b) The SBR of popliteal LNs was calculated by comparing with background skin signals (n = 4, mean ± SEM.). c) Quantitative tissue concentrations of model vaccines in the popliteal LNs. SBRs was converted to concentrations based on the labeling ratio (n = 4, mean ± SEM.). d) The SBR of LNs and injection site was compared (n = 5–6, mean ± SEM.). e) Representative LN images injected with model vaccines 1 min and 60 min prior to imaging. b-d) A P value of less than 0.05 was considered significant: *P < 0.05; **P < 0.01; ***P < 0.001; ****P < 0.0001 by one-way ANOVA followed by Tukey’s multiple comparisons test. FLARE, Fluorescence-Assisted Resection and Exploration; SBR, signal-to-background ratio.
We further compared the SBR in the LNs and injection site because strong residual signals were observed in the footpad even at 72 h post-injection (Figure. 2D). The SBR in the footpad was significantly higher than that of LNs in any expreimental groups (LN vs. the injection site: P < 0.0001 for OVA-ZW, P < 0.0016 for ONP1, P < 0.0298 for ONP2 at 72 h), suggesting that a significant fraction of the injected vaccine remained in the injection site regardless of the size. Interestingly, the level of remained dose at the injection site was signifiantly lower in the OVA-ZW group compared to the ONP1 or ONP2 group (OVA-ZW vs. ONP1: P = 0.0029, OVA-ZW vs. ONP2: P =0.0160). This result corresponds with the literature that vaccines smaller than 100–200 nm can enter the lymphatics directly and transport to the draining LNs.[2c, 7, 19] We consistently observed that, upon injection, OVA-ZW rapidly trafficked to lymphatics close to the injection site and accumulated into the popliteal LN shortly, while mimum to no signals were observed in the lympatics from ONP2-injected mice in 60 min post-injection (Figure. 2E).
We further examined advantages of the renal clearable ZW800–1C over the conventional organic dyes in monitoring biodistribution of vaccine. To this end, we performed the intradermal injection of OVA-ZW or OVA conjugated to the dye Cy5 (OVA-Cy5) on the footpad of mice (Figure. S5, Supporting Information). The signal in the popliteal LN injected with OVA-ZW or OVA-Cy5 showed a comparable increase in 1 h post-intradermal injection (Figure. S5B, Supporting Information). However, the OVA-Cy5 group gradually lost fluorescence signals with a concomitant increase in the background (Figure. S5A, Supporting Information), resulting in poor SBR beyond 24 h after injection (Figure. S5B, Supporting Information). Consistently, we observed higher fluorescence signals across multiple organs but lower in LNs in the OVA-Cy5 group compared to those in the OVA-ZW group at 72 h (Figure. S5C–D, Supporting Information).
Taken together, these results indicate that the zwitterionic ZW800–1C is a reliable tool to track down the fate of injected antigen and that the NIR fluorescence signals derived from ZW800–1C faithfully represents the in vivo behavior of model vaccines under the real-time intraoperative imaging system.
Biodistribution of model vaccines
To evaluate the biodistribution and clearance of model vaccines, we compared id versus intravenous injection (iv) in CD-1 mice and sacrificed them 72 h post-injection LN (Figure. 3). The mice injected with OVA-ZW intravenously through tail vein showed major fluorescence signals in the liver and spleen, while no signal was found in LNs (Figure. 3A,B). These results are consistent with the literature in showing that bloodborne antigens are rapidly scavenged by the liver[20] and spleen.[21] In contrast, mice injected with model vaccines intradermally showed faint signals in the major organs including lungs, liver, pancreas, and kidneys, while high fluorescence signals were observed in the popliteal LNs regardless of the size of model vaccines (Figure. 3A,B). These results confirm that the fluorescence signal from ZW800–1C represents the biodistribution and clearance of model vaccine under the NIR fluorescence imaging system.
Figure 3.

Quantitative biodistribution analysis of model vaccines. a) Major organs including heart (He), lungs (Lu), liver (Li), pancreas (Pa), spleen (Sp), kidneys (Ki), duodenum (Du), intestine (In), muscle (Mu), and lymph node (LN) were resected and imaged 72 h post-intradermal injection of model vaccines. For comparison, a group of mice was injected with 10 nmol of OVA-ZW intravenously (iv) through tail vain. b) The SBR of major organs and LNs are compared with the fluorescence signal of muscle and normalized (n = 4, mean ± SEM.). A P value of less than 0.05 was considered significant: ****P < 0.0001 by two-way ANOVA followed by Tukey’s multiple comparisons test.
2.3. Size-dependent uptake of model vaccine by APCs
Intradermally injected vaccines are known to be recognized by APCs, including skin-resident migDCs and cDCs within LNs or macrophages.[2a, 22] Size is one of the key factors affecting the kinetics of vaccine delivery to the secondary lymphoid tissue and its subsequent uptake by the subpopulations of APCs.[2a, 2c] To further validate such immunologic events in LNs, we analyzed the uptake of model vaccines using flow cytometry by characterizing DCs and DC subsets in the skin-draining LN at 72 h post-injection as described previously.[22] Distinct subsets of DCs, which are identified by surface markers and their anatomical locations, have been known to be responsible for specialized immune functions.[23] The migDC and cDC populations were evaluated as defined by their varying MHC class II and CD11c expression and their surface markers including Langerin, CD11b and CD103 as previously described.[22] migDCs migrating into LNs from the peripheral tissues are defined by MHC class IIhiCD11cint expression and further divided into Langerin−CD11b−, Langerin−CD11b+, Langerin+CD103+CD11b−, and Langerin+CD103−CD11b+ Langerhans cells.[24] cDCs are bone-marrow derived, LN-resident population and characterized by MHC-IIintCD11chi expression containing CD11b+ (CD8α−) and CD103+ (CD8α+) subsets.[22, 25] The number of cDCs and their subpopulations positive for the smaller model vaccines (OVA-ZW and ONP1) was larger than those for the larger vaccine (ONP2) (Figure. 4A–C, cDC: OVA-ZW vs. ONP2, P = 0.0109; ONP1 vs. ONP2, P = 0.0354; CD103+ cDC, OVA-ZW vs. ONP2, P = 0.0024; ONP1 vs. ONP2, P = 0.0439), which reflects the fact that smaller vaccines directly enter the lymphatics and are taken up by cDCs.[2c, 7, 19, 26] On the other hand, the number of migDCs and their subpopulations positive for OVA-ZW and ONP1 showed a statistically marginal increase compared to those for ONP2 (Figure. 4B,D, Figure. S4, Supporting Information), migDC: OVA-ZW vs. ONP2, P = 0.0450; ONP1 vs. ONP2, P = 0.0182; CD11b+Lang− migDC: ONP1 vs. ONP2, P = 0.0654), which confirm our hypothesis that larger vaccines are mainly carried by migDCs only and slowly delivered to LNs[2a, 27]. Interestingly, the number of cDC populations positive for ONP1 at 72 h was larger than that of ONP2 (Figure. 4B,C), suggesting that vaccines smaller than 200 nm directly entered the lymphatics and subsequently interact with cDCs in the LNs. These results are consistent with the literature showing that smaller particles directly flow into LNs, while nanoparticles larger than 200 nm are transported by the cellular mechanisms.[2c, 7, 19, 26] The number of macrophages and monocytes positive for the vaccine at 72 h was not significantly different across the experimental groups (Figure. S3, S4, Supporting Information). These results suggest that model vaccines are associate with immune cells depending on the size, and that the conjugation of the ultrasmall ZW fluorophores does not significantly alter the behavior of model vaccines and their immunological events in LNs.
Figure 4.

Flow cytometry analysis of vaccine uptake by DCs. Uptake of the model vaccines in DCs in the drainage LNs was assessed by flow cytometry 72 h post-intradermal injection of model vaccines (n = 4, median ± 95% confidence interval). a) Gating schematic to identify DC subsets within LNs. b) Cell counts of OVA-ZW positive classical LN resident DCs (cDCs) and migatory DCs (migDCs). c) Cell counts of cDC subsets. d) migDC subsets in the draining LNs. b-d) A P value of less than 0.05 was considered significant: *P < 0.05; **P < 0.01, N.S.: not significant by one-way ANOVA followed by Tukey’s multiple comparison test.
2.4. Size-dependent distribution of model vaccines in LNs
Since APCs actively interreact with the model vaccines depending on the size, we further performed histological analysis of LNs to evaluate the spatial distribution of model vaccines. The OVA-ZW fluorescence was associated with cells and predominantly distributed along in the subcapsular sinus in the periphery of popliteal LNs (Figure. 5A,B,G), which suggests that the small antigen arrived through afferent lymphatic vessels via lymphatic drainage and were captured by APCs along the subcapsular sinus.[7, 28] The fluorescence associated with ONP1 was detected in the cells located in both the subcapsular sinus and outer cortex areas, while the signal from ONP2 was detected only in the outer cortex areas (Figure. 5C–G). This result confirms that larger vaccines (ONP2) are transported by migDCs from skin, while smaller vaccines (OVA-ZW and ONP1) are associated by both lymphatic drainage and cellular mechanisms. This size-dependent distribution of model vaccines in the draining LN further confirms that the conjugation of the ZW fluorophore does not significantly alter the interactions between immune cells and vaccines, and that the fluorescence signals from ZW reflect the biodistribution of model vaccines.
Figure 5.

Histological analysis of vaccine uptake by APCs in the draining LNs. Uptake of the model vaccines in APCs was assessed by histology 72 h post-intradermal injection. a–c) Representative fluorescence images. d–f) binarized images of LNs: (a,b) OVA-ZW, (c,d) ONP1, (e,f) ONP2. Dotted lines depict capsule and subcapsular sinus (SCS) of LNs. Scale bar = 100 μm. g) Quantitative analysis of areas positive for fluorescence in SCS and cortex of LNs injection (n = 6, mean ± SEM.). A P value of less than 0.05 was considered significant: *P < 0.05; **P < 0.01; ****P < 0.0001; N.S., not significant by two-way ANOVA followed by Tukey’s multiple comparison test.
3. Discussion
Although most clinical vaccines are given intramuscularly, evidence suggests that intradermal delivery is more effective for some vaccines,[29] as the skin is enriched with immune cells and considered as an attractive site for vaccine administration.[30] However, this vaccination route is not fully explored, and consequently only one clinical intradermal vaccine has been licensed to date.[31] The main mode of action proposed for trafficking of intradermally administered vaccine antigen are: 1) the injected vaccine antigen is recognized and transported by immune cells including APCs, followed by migrating from the injection site to LNs.[32] 2) Alternatively, lymphatics in the skin is able to transport the intradermally injected vaccine antigen into skin-draining LNs.[2a, 2c] The difficulty of understanding pharmacokinetics of vaccine is mainly because of the complex interactions among these factors.
In this study, we have, for the first time, successfully established a reliable platform for the quantitative assessment of biodistribution and kinetics using NIR fluorescence imaging after intradermal injection of model vaccines. Compared to the conventional methodology of using radioisotopes, optical imaging represents a simple, straightforward, and reliable tool to determine the biodistribution of vaccines in real time. The bioconjugation of NIR fluorophores with vaccine proteins can be completed within a few hours via NHS ester chemistry under physiological conditions, which does not pose a risk to denature proteins to be conjugated. This technology can be therefore applied for labeling a wide range of biologics without specific requirements for conjugation. In addition, the use of zwitterionic NIR fluorophores offers unique features that improve imaging performance over the conventional visible fluorophores. First, zwitterionic NIR fluorophores show minimal interactions with biological tissues and do not alter the vaccine’s interactions with immune cells or other tissues. Second, since zwitterionic NIR fluorophores can achieve ultralow background with high SBR, the injection dose to visualize conjugated molecules in the body is significantly lower than other conventional fluorophores. The conventional organic dyes within the visual wavelength tend to have high background signals due to tissue autofluorescence and nonspecific binding, resulting in a low SBR. Third, chemical conjugation generally alters the physicochemical property of the bioconjugate because of the size, charges, and hydrophobicity of fluorophores, which affects its immunogenicity, function, and biological interactions with surrounding tissues and immune cells.[33] For example, it has been well established that fluorescence tagging on antibodies can affect the targeting affinity of an antibody to the specific epitopes[33b],[33c] and that the surface charge of fluorophores impacts on the interactions between the labeled protein and cells.[33a] In our study, the size-dependent uptake of model vaccines in migDC and cDC proved by flow cytometry and histology is consistent with the literature, representing that the chemical conjugation did not affect antigen recognition of model vaccines by APCs and that use of a small amount of ZW800–1C would minimize the confounding impacts by a fluorophore on the function of the biomolecule to be conjugated.
4. Conclusions
NIR fluorescence imaging combined with zwitterionic fluorophores represents a feasible and reliable methodology to determine the biodistribution and kinetics of vaccine in vivo. Such a platform would offer a powerful tool for optimizing the dose, formulation, and injection route of clinical vaccines. Furthermore, this finding built upon the mechanistic knowledge of vaccine trafficking would allow further use of this imaging technology in the efficacy and safety evaluation of vaccines and immunotherapeutics.
5. Experimental Section
Bioconjugation of ZW800–1C on model vaccines:
The NHS ester form of ZW800–1C (extinction coefficient: 111,000, quantum yield: 23.9% at 754 nm)[10a, 16c, 18] was conjugated with chicken egg ovalbumin protein (OVA, PDB:1OVA, MP Biomedicals, CA) as previously described.[16a] Briefly, 400 nmol of ZW800–1C NHS ester was incubated with 20 nmol OVA in 240 μL of PBS, pH 8.0 at room temperature (RT) for 3 h. The OVA-ZW800–1C (OVA-ZW) conjugates were purified by using Bio-Gel P-6 columns (Bio-Rad, Hercules, CA) and membrane filtration columns (Sartorius Stedim Lab, UK). Then the purified OVA-ZW was further conjugated with two different sizes (20 nm and 100 nm) of aminated silica nanoparticles (SiNP, NanoComposix, CA) in the presence of 4-(4,6-dimethoxy-1,3,5-triazin-2-yl)-4-methylmorpholinium chloride (DMTMM, Sigma Aldrich, Saint Luis, MO) at RT in distilled water (DIW).
The size of each SiNP, which was determined by electron microscopy by the manufacturer, was 22.6 ± 2.7 and 97.5 ± 5.0 nm, respectively. The average HD before conjugation measured by DLS was 71.1 ± 0.2 or 127.1 ± 1.5 nm. The reaction ratio of OVA-ZW to SiNPs was 10:1 and 360:1 in molar equivalent for ONP1 and ONP2, respectively. The concentration of DMTMM was adjusted to be the same as OVA-ZW. After a gentle reaction for 3 h, non-conjugated OVA-ZW was eliminated by centrifuge. The average HD of ONP1 and ONP2 was measured by dynamic light scattering (DLS; Zetasizer Nano ZS, Malvern, UK).
The labeling ratio of ZW800–1C on SiNPs was calculated based on the Beer-Lambert’s law by determining the concentration of each compound using UV-Vis-NIR spectrophotometer (USB-ISS-UV/VIS, Ocean Optics, FL). Extinction coefficients for OVA, ZW800–1C, 20 nm SiNP, and 100 nm SiNP were 30,590 M−1cm−1, 67,500 M−1cm−1, 249,700 M−1cm−1, and 188,249,400 M−1cm−1 measured at 280 nm, 753 nm, and 350 nm, respectively. 350 nm is chosen for calculating the extinction coefficient of SiNPs, where the interference of absorbance from albumin and fluorophore is minimal. Measurement of unconjugated SiNP solution was performed for a reference to determine the amount of conjugated ZW and OVA on SiNPs. The NHS ester form of Cy5 (Cyanine-5, extinction coefficient: 250,000, quantum yield: 30% at 649 nm, GE Amersham) was conjugated with OVA using the same procedures as for OVA-ZW.
Animal models and vaccine administration:
Six-week-old male C57BL/6J mice (stock #000664) were purchased from Jackson Laboratories (Bar Harbor, ME) and acclimated for at least 2 wk at Massachusetts General Hospital (MGH). Mouse hair was removed 1 d prior to injection using a commercial depilatory cream (Nair, Church & Dwight Co., Ewing, NJ). For imaging and flow cytometry study, three different sizes of model vaccines, OVA-ZW, ONP1, and ONP2 were intradermally (id) injected into the mouse leg footpad, respectively (n = 4). The injection volume was fixed to be 5 μL at a concentration of 20 μM ZW fluorophore. For a control biodistribution study, we injected 100 μL of 20 μM OVA-ZW intravenously (iv) into CD-1 mice (n = 4). All animal procedures were approved by the MGH IACUC (protocol #2017N000067 and 2009N000103) and performed under the Public Health Service Policy on Humane Care of Laboratory Animals.
Real-time intravital fluorescence imaging:
For real-time NIR fluorescence imaging, the multispectral FLARE imaging system was used[12a, 12b]. Briefly, 660 nm (excitation for Cy5) and 760 nm (for ZW800–1C) multimode laser diodes (RPMC Lasers, O’Fallon, MO) were coupled with a 1 to 4 breakout glass optical fiber (NA=0.55, Leoni AG, Germany) for an excitation light source. The irradiance at a focal plane was adjusted to be 7 mW/cm2 over a 10 cm diameter field-of-view (FOV). Mice were anesthetized with isoflurane and laid prone under a prism based multispectral CCD camera (JAI A/S, Denmark). Color and NIR images were simultaneously captured by the camera with multiple exposure times between 100 and 2,000 msec. The FOV includes injection site, popliteal and sciatic LNs. The images were acquired before and immediately after injection, and 1, 6, 24, 48, 72 h post-injection. After 72 h, each major organ was dissected, and the fluorescence image was captured.
Quantitation and statistical analysis:
Image processing and analysis was carried out using ImageJ software (National Institutes of Health). Approximately 50×50 pixels around the injection site and LNs were cropped from original NIR grayscale images, and noise was removed by a 3×3 pixels median filter. Next, a region of interest (ROI) was defined automatically and quantitatively by means of iterative selection method which determines a threshold between signal and background on a filtered image (Figure. S2). The average intensity of a resulting ROI on the original image yielded the level of signal. The dye-free skin intensity (auto) was also measured on each image and defined as background. The SBR was calculated as follows:
| (1) |
, where IROI denotes the average intensity of an ROI and IAuto represents the intensity of the mouse dye-free skin. SBR at different time points was normalized based on the initial intensity in the footpad and LNs at t = 0. For the analysis of LNs, a series of images with an exposure time of 2,000 msec were used, while 100 msec was used for footpad images. All NIR fluorescence images were normalized identically for all conditions of an experiment. Animal results were presented as mean (n ≥ 3) ± standard errors (SEM) and curve fitting was performed using Prism ver. 8 software (GraphPad, San Diego, CA). One-way ANOVA followed by Tukey’s test was performed for the statistical analysis. A P value of less than 0.05 was considered significant: *P < 0.05, **P < 0.01, ***P < 0.001, ****P < 0.0001.
Stability test of model vaccines:
OVA-ZW was dissolved in PBS, pH 7.4 containing 10% serum at a concentration of 0.1 or 1.0 μM ZW800–1C. The OVA-ZW solutions were sealed into glass capillary tubes (Fisher Scientific, Waltham, MA) and then incubated for 0, 1, 6, 24, 48, and 72 h at 37˚C in a 5% CO2 incubator. After incubation, the fluorescence signal of each sample in a capillary tube was captured using the FLARE imaging system, and an SBR for each capillary tube was calculated as described above.
Flow cytometry analysis of LN:
For the analysis of immune cells by flow cytometry with limited filter sets, ZW700–1C was used in place of ZW800–1C because both fluorophores have identically same chemical structures except for the length of polymethine backbone, thus showing an excitation peak at 643 nm and an emission peak at 663 nm, respectively.[13] The NHS ester form of ZW700–1C was conjugated on the model vaccines using the same conjugation procedures as for ZW800–1C.[16a] Three days after intradermal injection, popliteal LNs were isolated from each mouse. LNs were dissociated with collagenase D/DNase solution (2.5 mg mL−1 collagenase and 100 unit mL−1 DNase, Roche, Netherland) for 25 min followed by incubating with ethylenediaminetetraacetic acid (EDTA) solution (10 mM, Invitrogen, CA) for 5 min at 37˚C,[22] We labeled the isolated cells for F4/80 (BM8, BioLegend), I-A/I-E (M5/114.15.2, BioLegend), CD11c (N418, BioLegend), CD103(2E7, BioLegend), CD11b (M1/70, BioLegend), Langerin (4C7, BioLegend), Ly6C (AL-21, BioLegend), Ly6G (1A8, BioLegend), and Live/Dead Fixable Aqua (Life Technologies) to identify specific receptors against APC subsets.[22] The fluorescence data were acquired using a 640 nm excitation laser on a Fortessa flow cytometer (BD Biosciences, Franklin Lakes, NJ) and analyzed with FlowJo software ver. 10 (FlowJo Co., Ashland, OR). cDCs were identified based on CD11chi and I-A/I-E intermediate expression, whereas migDCs were classified as CD11c intermediate and I-A/I-Ehi expression group. For further classification, cDCs were divided into two groups: CD103+ and CD103−, while migDCs were into four groups based on the CD11b and Langerin (Lang) expressions: CD11b+ Lang+; CD11b+ Lang−; CD11b− Lang+; and CD11b− Lang− subsets. Macrophages and monocytes were identified based on CD11b+ I-A/I-E− expression. F4/80+ CD11c− cells were then identified as macrophages, while CD11c− Ly6G− population was further divided into Ly6C− and Ly6C+ monocyte (inflammatory monocyte) groups.[22] To evaluate the transportation of each model vaccine to the LNs, the number of ZW700–1C positive cells was measured for each subpopulation, of which signal thresholds were determined by fluorescence minus one control (FMO) groups.
Histological analysis of LNs:
Mouse LNs were isolated 72 h post-intradermal injection of model vaccines. LNs were fixed with 4% paraformaldehyde (Thermo Scientific, Rockford, IL) and incubated in 30% sucrose solution (Merck, Germany) overnight. Ten-μm thickness of frozen sections were cut by a cryostat (Leica, Germany). Images were acquired on a 4-channel NIR fluorescence microscope (TE2000U, Nikon, Japan) and CCD camera (C4742–80-12AG, Hamamatsu Photonics, Japan). All the images were binarized by means of iterative selection method to define areas positive for fluorescence signals. To analyze the spatial relationship between fluorescent cells and their locations in the LN, areas within 15 μm of the edge of LNs were defined as subcapsular sinus (SCS) and the others were considered as cortex.[34] The portion of areas positive for fluorescence was measured and calculated for each ROI using ImageJ.
Transmission electron microscopy (TEM) of nanoparticles:
Freshly prepared ONP1 and ONP2 in ultra-pure water were dropped onto a carbon-coated copper grid (200 mesh, Ted Pella, Redding, CA) and dried in a vacuum chamber overnight. TEM images were obtained using Tecnai G2 Spirit Bio TWIN (FEI Company, OR).
Statistical Analysis:
We performed an ANOVA followed by Tukey’s multiple comparison tests or Student’s unpaired two-tailed t test using Prism 8. The mean ± SEM (standard errors) were shown for all the image analyses on the FLARE system and fluorescence microscopy. The results of flow cytometry data analysis were presented in box-and-whisker plots with the median ± 95% confidence interval.
Supplementary Material
Acknowledgements
We thank Ivey Choi for manuscript editing. This work was supported by the US NIH grant numbers NIAID R01AI105131 (S.K.), R21AI144103 (S.K.), NIBIB R01EB022230 (H.S.C.) and NCI R35CA197605 (S.J.), C.L.E. and S.J. were supported by the Ludwig Center at Harvard, Japan Society for the Promotion of Science Overseas Challenge Program for Young Researchers (W.K.), Global Scholarship of the Japan Business Federation (W.K.), Grant-in-Aid to the Program for Leading Graduate School for “Science for Development of Super Mature Society” from the Ministry of Education, Culture, Sport, Science and Technology in Japan (W.K.), the Research Grant of Keio Leading-edge Laboratory of Science and Technology (W.K.). The contents of this paper are solely the responsibility of the authors and do not necessarily reflect the official views of the National Institutes of Health.
Footnotes
Supporting Information
Supporting Information is available from the Wiley Online Library or from the author.
Conflict of Interest
The authors declare no conflict of interest.
Contributor Information
Wataru Katagiri, Gordon Center for Medical Imaging, Department of Radiology, Massachusetts General Hospital, 149 13th Street, Charlestown, MA 02129, USA; Graduate School of Science and Technology, Keio University, 3-14-1 Hiyoshi, Yokohama, Kanagawa 223-8522, Japan.
Jeong Heong Lee, Gordon Center for Medical Imaging, Department of Radiology, Massachusetts General Hospital, 149 13th Street, Charlestown, MA 02129, USA.
Marc-André Tétrault, Gordon Center for Medical Imaging, Department of Radiology, Massachusetts General Hospital, 149 13th Street, Charlestown, MA 02129, USA.
Homan Kang, Gordon Center for Medical Imaging, Department of Radiology, Massachusetts General Hospital, 149 13th Street, Charlestown, MA 02129, USA.
Shinya Yokomizo, Gordon Center for Medical Imaging, Department of Radiology, Massachusetts General Hospital, 149 13th Street, Charlestown, MA 02129, USA.
Sheena Santos, Gordon Center for Medical Imaging, Department of Radiology, Massachusetts General Hospital, 149 13th Street, Charlestown, MA 02129, USA.
Catherine Jones, Gordon Center for Medical Imaging, Department of Radiology, Massachusetts General Hospital, 149 13th Street, Charlestown, MA 02129, USA.
Shuang Hu, Gordon Center for Medical Imaging, Department of Radiology, Massachusetts General Hospital, 149 13th Street, Charlestown, MA 02129, USA.
Georges El Fakhri, Gordon Center for Medical Imaging, Department of Radiology, Massachusetts General Hospital, 149 13th Street, Charlestown, MA 02129, USA.
Hak Soo Choi, Gordon Center for Medical Imaging, Department of Radiology, Massachusetts General Hospital, 149 13th Street, Charlestown, MA 02129, USA.
Satoshi Kashiwagi, Gordon Center for Medical Imaging, Department of Radiology, Massachusetts General Hospital, 149 13th Street, Charlestown, MA 02129, USA.
Kosuke Tsukada, Graduate School of Science and Technology, Keio University, 3-14-1 Hiyoshi, Yokohama, Kanagawa 223-8522, Japan.
Sinyoung Jeong, Wellman Center for Photomedicine, Department of Dermatology, Massachusetts General Hospital, 149 13th Street, Charlestown, MA 02129, USA.
Conor Evans, Wellman Center for Photomedicine, Department of Dermatology, Massachusetts General Hospital, 149 13th Street, Charlestown, MA 02129, USA.
Shinya Yokomizo, Department of Radiological Sciences, Tokyo Metropolitan University, 7-2-10 Higashi-Ogu, Arakawa, Tokyo 116-8551, Japan.
References
- [1].Rappuoli R, Pizza M, Del Giudice G, De Gregorio E, Proc Natl Acad Sci U S A 2014, 111, 12288. [DOI] [PMC free article] [PubMed] [Google Scholar]
- [2].a) Tozuka M, Oka T, Jounai N, Egawa G, Ishii KJ, Kabashima K, Takeshita F, J Dermatol Sci 2016, 82, 38; [DOI] [PubMed] [Google Scholar]; b) Rappuoli R, Mandl CW, Black S, De Gregorio E, Nat Rev Immunol 2011, 11, 865; [DOI] [PMC free article] [PubMed] [Google Scholar]; c) Moyer TJ, Zmolek AC, Irvine DJ, J Clin Invest 2016, 126, 799. [DOI] [PMC free article] [PubMed] [Google Scholar]
- [3].Johansen P, Mohanan D, Martinez-Gomez JM, Kundig TM, Gander B, J Control Release 2010, 148, 56. [DOI] [PubMed] [Google Scholar]
- [4].d’Onofrio A, Manfredi P, Salinelli E, Theor Popul Biol 2007, 71, 301. [DOI] [PubMed] [Google Scholar]
- [5].Arakane R, Annaka R, Takahama A, Ishida K, Yoshiike M, Nakayama T, Takeshita F, Vaccine 2015, 33, 6650. [DOI] [PubMed] [Google Scholar]
- [6].a) Yue ZG, Wei W, Lv PP, Yue H, Wang LY, Su ZG, Ma GH, Biomacromolecules 2011, 12, 2440; [DOI] [PubMed] [Google Scholar]; b) Fromen CA, Rahhal TB, Robbins GR, Kai MP, Shen TW, Luft JC, DeSimone JM, Nanomedicine 2016, 12, 677; [DOI] [PMC free article] [PubMed] [Google Scholar]; c) Joshi VB, Geary SM, Salem AK, Hum Vaccin Immunother 2013, 9, 2584. [DOI] [PMC free article] [PubMed] [Google Scholar]
- [7].Manolova V, Flace A, Bauer M, Schwarz K, Saudan P, Bachmann MF, Eur J Immunol 2008, 38, 1404. [DOI] [PubMed] [Google Scholar]
- [8].Kang S, Ahn S, Lee J, Kim JY, Choi M, Gujrati V, Kim H, Kim J, Shin EC, Jon S, J Control Release 2017, 256, 56. [DOI] [PubMed] [Google Scholar]
- [9].Bachmann MF, Jennings GT, Nat Rev Immunol 2010, 10, 787. [DOI] [PubMed] [Google Scholar]
- [10].a) Hyun H, Owens EA, Wada H, Levitz A, Park G, Park MH, Frangioni JV, Henary M, Choi HS, Angew Chem Int Ed Engl 2015, 54, 8648; [DOI] [PMC free article] [PubMed] [Google Scholar]; b) Hyun H, Park MH, Owens EA, Wada H, Henary M, Handgraaf HJ, Vahrmeijer AL, Frangioni JV, Choi HS, Nat Med 2015, 21, 192; [DOI] [PMC free article] [PubMed] [Google Scholar]; c) Hyun H, Wada H, Bao K, Gravier J, Yadav Y, Laramie M, Henary M, Frangioni JV, Choi HS, Angew Chem Int Ed Engl 2014, 53, 10668; [DOI] [PMC free article] [PubMed] [Google Scholar]; d) Park MH, Hyun H, Ashitate Y, Wada H, Park G, Lee JH, Njiojob C, Henary M, Frangioni JV, Choi HS, Theranostics 2014, 4, 823. [DOI] [PMC free article] [PubMed] [Google Scholar]
- [11].a) Lee JH, Park G, Hong GH, Choi J, Choi HS, Quant Imaging Med Surg 2012, 2, 266; [DOI] [PMC free article] [PubMed] [Google Scholar]; b) Owens EA, Henary M, El Fakhri G, Choi HS, Acc Chem Res 2016, 49, 1731; [DOI] [PMC free article] [PubMed] [Google Scholar]; c) Owens EA, Hyun H, Dost TL, Lee JH, Park G, Pham DH, Park MH, Choi HS, Henary M, J Med Chem 2016, 59, 5311; [DOI] [PMC free article] [PubMed] [Google Scholar]; d) Hu S, Kang H, Baek Y, El Fakhri G, Kuang A, Choi HS, Adv Healthc Mater 2018, 7, e1800066. [DOI] [PMC free article] [PubMed] [Google Scholar]
- [12].a) Hutteman M, Choi HS, Mieog JS, van der Vorst JR, Ashitate Y, Kuppen PJ, van Groningen MC, Lowik CW, Smit VT, van de Velde CJ, Frangioni JV, Vahrmeijer AL, Ann Surg Oncol 2011, 18, 1006; [DOI] [PMC free article] [PubMed] [Google Scholar]; b) Tanaka E, Choi HS, Fujii H, Bawendi MG, Frangioni JV, Ann Surg Oncol 2006, 13, 1671; [DOI] [PMC free article] [PubMed] [Google Scholar]; c) Wada H, Hyun H, Vargas C, Genega EM, Gravier J, Gioux S, Frangioni JV, Choi HS, Ann Surg Oncol 2015, 22 Suppl 3, S1147; [DOI] [PMC free article] [PubMed] [Google Scholar]; d) Mieog JS, Troyan SL, Hutteman M, Donohoe KJ, van der Vorst JR, Stockdale A, Liefers GJ, Choi HS, Gibbs-Strauss SL, Putter H, Gioux S, Kuppen PJ, Ashitate Y, Lowik CW, Smit VT, Oketokoun R, Ngo LH, van de Velde CJ, Frangioni JV, Vahrmeijer AL, Ann Surg Oncol 2011, 18, 2483. [DOI] [PMC free article] [PubMed] [Google Scholar]
- [13].Hyun H, Henary M, Gao T, Narayana L, Owens EA, Lee JH, Park G, Wada H, Ashitate Y, Frangioni JV, Choi HS, Mol Imaging Biol 2016, 18, 52. [DOI] [PMC free article] [PubMed] [Google Scholar]
- [14].Choi HS, Nasr K, Alyabyev S, Feith D, Lee JH, Kim SH, Ashitate Y, Hyun H, Patonay G, Strekowski L, Henary M, Frangioni JV, Angew Chem Int Ed Engl 2011, 50, 6258. [DOI] [PMC free article] [PubMed] [Google Scholar]
- [15].a) Choi HS, Liu W, Misra P, Tanaka E, Zimmer JP, Itty Ipe B, Bawendi MG, Frangioni JV, Nat Biotechnol 2007, 25, 1165; [DOI] [PMC free article] [PubMed] [Google Scholar]; b) Choi HS, Liu W, Liu F, Nasr K, Misra P, Bawendi MG, Frangioni JV, Nat Nanotechnol 2010, 5, 42; [DOI] [PMC free article] [PubMed] [Google Scholar]; c) Njiojob CN, Owens EA, Narayana L, Hyun H, Choi HS, Henary M, J Med Chem 2015, 58, 2845. [DOI] [PMC free article] [PubMed] [Google Scholar]
- [16].a) Choi HS, Gibbs SL, Lee JH, Kim SH, Ashitate Y, Liu F, Hyun H, Park G, Xie Y, Bae S, Henary M, Frangioni JV, Nat Biotechnol 2013, 31, 148; [DOI] [PMC free article] [PubMed] [Google Scholar]; b) Bao K, Nasr KA, Hyun H, Lee JH, Gravier J, Gibbs SL, Choi HS, Theranostics 2015, 5, 609; [DOI] [PMC free article] [PubMed] [Google Scholar]; c) Kang H, Gravier J, Bao K, Wada H, Lee JH, Baek Y, El Fakhri G, Gioux S, Rubin BP, Coll JL, Choi HS, Adv Mater 2016, 28, 8162. [DOI] [PMC free article] [PubMed] [Google Scholar]
- [17].a) Kim KS, Hyun H, Yang JA, Lee MY, Kim H, Yun SH, Choi HS, Hahn SK, Biomacromolecules 2015, 16, 3054; [DOI] [PMC free article] [PubMed] [Google Scholar]; b) Chung JE, Tan S, Gao SJ, Yongvongsoontorn N, Kim SH, Lee JH, Choi HS, Yano H, Zhuo L, Kurisawa M, Ying JY, Nat Nanotechnol 2014, 9, 907. [DOI] [PMC free article] [PubMed] [Google Scholar]
- [18].Hyun H, Owens EA, Narayana L, Wada H, Gravier J, Bao K, Frangioni JV, Choi HS, Henary M, RSC Adv 2014, 4, 58762. [DOI] [PMC free article] [PubMed] [Google Scholar]
- [19].Reddy ST, Rehor A, Schmoekel HG, Hubbell JA, Swartz MA, J Control Release 2006, 112, 26. [DOI] [PubMed] [Google Scholar]
- [20].Schurich A, Bottcher JP, Burgdorf S, Penzler P, Hegenbarth S, Kern M, Dolf A, Endl E, Schultze J, Wiertz E, Stabenow D, Kurts C, Knolle P, Hepatology 2009, 50, 909. [DOI] [PubMed] [Google Scholar]
- [21].Pooley JL, Heath WR, Shortman K, J Immunol 2001, 166, 5327. [DOI] [PubMed] [Google Scholar]
- [22].Morse K, Kimizuka Y, Chan MPK, Shibata M, Shimaoka Y, Takeuchi S, Forbes B, Nirschl C, Li B, Zeng Y, Bronson RT, Katagiri W, Shigeta A, Sirbulescu RF, Chen H, Tan RYY, Tsukada K, Brauns T, Gelfand J, Sluder A, Locascio JJ, Poznansky MC, Anandasabapathy N, Kashiwagi S, J Immunol 2017, 199, 1319. [DOI] [PMC free article] [PubMed] [Google Scholar]
- [23].a) Merad M, Sathe P, Helft J, Miller J, Mortha A, Annu Rev Immunol 2013, 31, 563; [DOI] [PMC free article] [PubMed] [Google Scholar]; b) Schlitzer A, McGovern N, Ginhoux F, Semin Cell Dev Biol 2015, 41, 9. [DOI] [PubMed] [Google Scholar]
- [24].a) Henri S, Guilliams M, Poulin LF, Tamoutounour S, Ardouin L, Dalod M, Malissen B, Immunol Cell Biol 2010, 88, 366; [DOI] [PubMed] [Google Scholar]; b) Malissen B, Tamoutounour S, Henri S, Nat Rev Immunol 2014, 14, 417. [DOI] [PubMed] [Google Scholar]
- [25].Kimizuka Y, Katagiri W, Locascio JJ, Shigeta A, Sasaki Y, Shibata M, Morse K, Sirbulescu RF, Miyatake M, Reeves P, Suematsu M, Gelfand J, Brauns T, Poznansky MC, Tsukada K, Kashiwagi S, J Immunol 2018, 201, 3587. [DOI] [PMC free article] [PubMed] [Google Scholar]
- [26].Fifis T, Gamvrellis A, Crimeen-Irwin B, Pietersz GA, Li J, Mottram PL, McKenzie IF, Plebanski M, J Immunol 2004, 173, 3148. [DOI] [PubMed] [Google Scholar]
- [27].Itano AA, McSorley SJ, Reinhardt RL, Ehst BD, Ingulli E, Rudensky AY, Jenkins MK, Immunity 2003, 19, 47. [DOI] [PubMed] [Google Scholar]
- [28].Cubas R, Zhang S, Kwon S, Sevick-Muraca EM, Li M, Chen C, Yao Q, J Immunother 2009, 32, 118. [DOI] [PMC free article] [PubMed] [Google Scholar]
- [29].a) Teunissen MB, Zehrung D, Vaccine 2015, 33, 4659; [DOI] [PubMed] [Google Scholar]; b) Sticchi L, Alberti M, Alicino C, Crovari P, J Prev Med Hyg 2010, 51, 7; [PubMed] [Google Scholar]; c) Fehres CM, Garcia-Vallejo JJ, Unger WW, van Kooyk Y, Front Immunol 2013, 4, 157; [DOI] [PMC free article] [PubMed] [Google Scholar]; d) Combadiere B, Liard C, Hum Vaccin 2011, 7, 811; [DOI] [PubMed] [Google Scholar]; e) Lambert PH, Laurent PE, Vaccine 2008, 26, 3197. [DOI] [PubMed] [Google Scholar]
- [30].Nestle FO, Di Meglio P, Qin JZ, Nickoloff BJ, Nat Rev Immunol 2009, 9, 679. [DOI] [PMC free article] [PubMed] [Google Scholar]
- [31].Ansaldi F, de Florentiis D, Durando P, Icardi G, Expert Rev Vaccines 2012, 11, 17. [DOI] [PubMed] [Google Scholar]
- [32].a) Worbs T, Hammerschmidt SI, Forster R, Nat Rev Immunol 2017, 17, 30; [DOI] [PubMed] [Google Scholar]; b) Salomon B, Cohen JL, Masurier C, Klatzmann D, J Immunol 1998, 160, 708. [PubMed] [Google Scholar]
- [33].a) Yin L, Wang W, Wang S, Zhang F, Zhang S, Tao N, Biosensors & bioelectronics 2015, 66, 412; [DOI] [PMC free article] [PubMed] [Google Scholar]; b) Szabo A, Szendi-Szatmari T, Ujlaky-Nagy L, Radi I, Vereb G, Szollosi J, Nagy P, Biophys J 2018, 114, 688; [DOI] [PMC free article] [PubMed] [Google Scholar]; c) Vira S, Mekhedov E, Humphrey G, Blank PS, Anal Biochem 2010, 402, 146; [DOI] [PMC free article] [PubMed] [Google Scholar]; d) Hayashi-Takanaka Y, Stasevich TJ, Kurumizaka H, Nozaki N, Kimura H, PLoS One 2014, 9, e106271. [DOI] [PMC free article] [PubMed] [Google Scholar]
- [34].Turner VM, Mabbott NA, Immunology 2017, 151, 239. [DOI] [PMC free article] [PubMed] [Google Scholar]
Associated Data
This section collects any data citations, data availability statements, or supplementary materials included in this article.