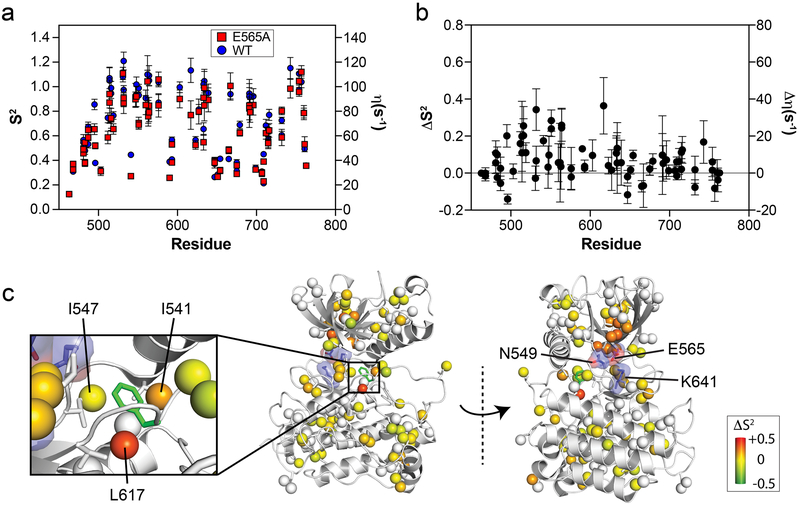
Figure 2. The E565A mutation increases localized conformational dynamics and induces allosteric changes to residues surrounding the phenylalanine within the DFG motif.
(a) Comparison of generalized order parameters (S2; left axis) and 1H-1H cross-correlated relaxation rates (η; right axis) for wild-type (blue circles) and E565A (red squares). Error bars denote the error of fitted η values used to calculate S2. (b) Difference plot of S2 values (ΔS2) from panel (a) calculated by subtracting E565A values from those of wild-type FGFR2K. Note that compared to the C-lobe, several N-lobe residues display ΔS2 values significantly greater than zero. (c) ΔS2 values are mapped on corresponding methyl carbon atoms as spheres onto the inhibited structure of FGFRK (PDB ID:3KY2) represented in gray cartoon. The inset shows a zoomed-in view of the DFG latch. The range of ΔS2 is denoted by a colored boxed bar. Note the decrease in order for the methyl groups of I541 and L617 in E565E which are directly surrounding the phenylalanine from the DFG latch motif.

