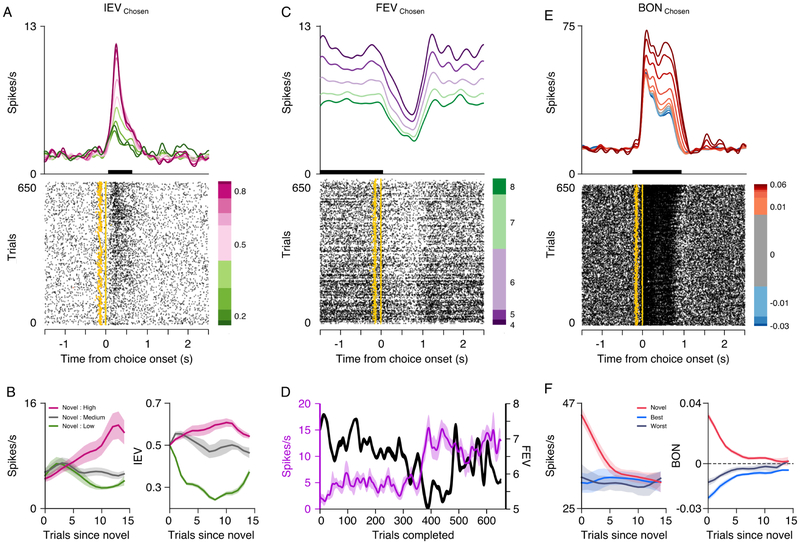
Figure 3. Single cell examples of POMDP derived value encoding.
(A) Spike density function and raster plot depicting the activity of a neuron in ventral striatum encoding the IEV of the chosen option. The amber line indicates choice onset and the amber dots indicate visual onset of the cues. (B) The left panel shows the mean activity of the neuron when the monkey chose novel options assigned different values. Mean responses were averaged over the epoch when the neuron showed significant IEV encoding (black bar in A) and based on a moving average of 3 trials. The right panel shows the corresponding mean IEV of each option derived from the POMDP model. (C) Spike density function and raster plot depicting the activity of a neuron in the amygdala encoding the FEV of the chosen option. (D) Trial to trial changes in the mean activity of the neuron during the baseline epoch when the neuron showed significant FEV encoding (black bar in C) and based on a moving average of three trials. The secondary axis shows the corresponding FEV of the chosen option. (E and F) Same as A and B, for a neuron in the amygdala that encoded the exploration BONUS for the chosen option.

