Abstract
Plexiform neurofibroma (PN) tumors are a hallmark manifestation of neurofibromatosis type 1 (NF1) that arise in the Schwann cell (SC) lineage. NF1 is a common heritable cancer predisposition syndrome caused by germline mutations in the NF1 tumor suppressor, which encodes a GTPase-activating protein called neurofibromin that negatively regulates Ras proteins. Whereas most PN are clinically indolent, a subset progress to atypical neurofibromatous neoplasms of uncertain biologic potential (ANNUBP) and/or to malignant peripheral nerve sheath tumors (MPNSTs). In small clinical series, loss of 9p21.3, which includes the CDKN2A locus, has been associated with the genesis of ANNUBP. Here we show that the Cdkn2a alternate reading frame (Arf) serves as a gatekeeper tumor suppressor in mice that prevents PN progression by inducing senescence-mediated growth arrest in aberrantly proliferating Nf1−/− SC. Conditional ablation of Nf1 and Arf in the neural crest-derived SC lineage allows escape from senescence, resulting in tumors that accurately phenocopy human ANNUBP and progress to MPNST with high penetrance. This animal model will serve as a platform to study the clonal development of ANNUBP and MPNST and to identify new therapies to treat existing tumors and to prevent disease progression.
Introduction
Neurofibromatosis type 1 (NF1) is one of the most common heritable cancer predisposition syndromes, affecting 1 in 3000 individuals in all populations throughout the world (1). Plexiform neurofibromas (PNs), which are a hallmark manifestation of NF1, are benign nerve and soft tissue tumors that manifest within the nerve fascicles driven by biallelic loss of NF1/Nf1 in the embryonic and early neonatal Schwann lineage (SC) in human tumors and in genetically engineered murine models (2,3). PN have a 15% lifetime incidence of transformation to highly aggressive sarcomas called malignant peripheral nerve sheath tumors (MPNSTs) (4), which are the leading cause of mortality in NF1 patients. Current MPNST therapies, including surgery and chemoradiotherapy, are both debilitating and largely ineffective. Understanding why some PN progress to MPNST while others remain indolent is paramount to developing effective treatment strategies for preventing disease progression and for early therapeutic intervention.
Beyond early childhood and adolescence, most PN grow slowly at a median growth rate of 3.7% per year (5). Further, some PN stop growing entirely despite persistent Ras activation. We hypothesized that PN growth arrest results from activation of a senescence program in response to chronic Ras hyperactivation. Subsequent escape from this growth arrest may ultimately drive progression of PN toward MPNST. The alternate reading frame of CDKN2A (ARF) encodes a tumor suppressor gene that induces senescence-like cell cycle arrest through the stabilization of p53 (6). Intriguingly, a number of other benign, slow-growing neoplasms harboring oncogenic RAS mutations including nevi and colonic adenomas overexpress CDKN2A/ARF and are characterized by a signature of senescence prior to tumor progression (7,8).
Longitudinal imaging studies of NF1 patients with PN have identified a subset of distinct nodular lesions that emerge after childhood within existing PN, grow rapidly relative to the surrounding tumor and are fluorodeoxyglucose positron emission tomography (FDG-PET) avid (9). Biopsies often reveal atypical neurofibromatous neoplasms of uncertain biologic potential (ANNUBP), which share some overlapping histopathological features with MPNST and have been implicated as potential MPNST precursors (10). Intriguingly, karyotyping and microarray analysis identified chromosome 9p21.3 deletions, encoding the entire CDKN2A/B locus, as a solitary and highly recurrent genetic aberration in human ANNUBP (94%, n = 15/16) that were not present in PN (11). Further, haploinsufficient or homozygous loss of CDKN2A (p16INK4A) and its alternative reading frame p14ARF was identified in 60–80% of MPNSTs in two recent independent studies (12,13).
Here we provide genetic evidence that the Arf tumor suppressor restrains the proliferation of Nf1−/− SCs. Our postulate that this phenomenon is due to the activation of a senescence program, invoked by Ras hyperactivation, was supported by a broad signature of senescence in both murine and human PN. Further, we show that mice harboring conditional ablation of Nf1 and Arf in embryonic neural crest develop tumors that are histopathologically indistinguishable from human ANNUBP and subsequently progress to MPNST with high penetrance. Whereas germline mouse models where p53 (14), p16 (15) or p19Arf (16) are lost in addition to Nf1 develop MPNST and other sarcomas in the absence of apparent premalignant changes, the tissue lineage-specific model outlined here is the first to recapitulate the malignant transformation of pre-existing PN and ANNUBP precursor lesions. Thus, this model provides a tractable platform to study the clonal development of ANNUBP and MPNSTs and evaluate novel therapeutic strategies.
Results
Nf1−/− SCs undergo senescence-induced growth arrest, driven by Ras-dependent induction of p19Arf expression
To test the hypothesis that the outgrowth of Nf1−/− SCs is limited by senescence, we genetically ablated Nf1 in embryonic SC progenitors. As anticipated, this resulted in loss of neurofibromin protein expression and elevated levels of active Ras-guanosine triphosphate (GTP) (Fig. 1A). This hyperactivation of Ras was associated with an initial burst of increased proliferation in Nf1−/− SCs, which was not sustained (Fig. 1B). Growth arrest was accompanied by robust β-galactosidase expression (Fig. 1C), an established marker of cellular senescence. Correlating with the increase in β-galactosidase staining, the expression of the senescence-associated transcripts, Cdkn2a(Arf) and Cdkn2b were upregulated 5–6-fold in Nf1−/− SCs relative to control wild-type (WT) SCs (Fig. 1D). Consistent with these data, we observed robust induction of p19Arf, p53 and p16Ink4a protein expression in Nf1−/− cells by western blot (Fig. 1E).
Figure 1.
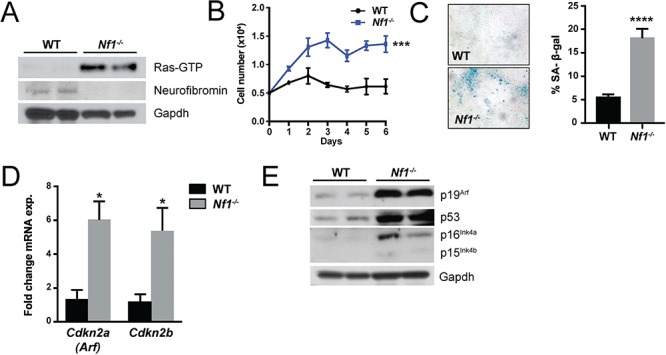
Loss of neurofibromin drives Schwann cell senescence. (A) Ras-GTP activity, neurofibromin and Gapdh (loading control) were detected in WT and Nf1−/− SC progenitors by western blot. (B) Proliferation of WT and Nf1−/− SCs was assessed by manual cell counting. n = 3 biological replicates per genotype at each time point. ***P < 0.001 WT versus Nf1−/− by two-way ANOVA. (C) Representative photomicrographs of β-galactosidase stained WT and Nf1−/− primary SCs. The percentage of β-galactosidase positive staining cells was quantified. n = 3 biological replicates per genotype. ****P < 0.0001 WT versus Nf1−/− by Student’s t-test. (D) Expression of senescence associated transcripts, Cdkn2a(Arf) and Cdkn2b in WT and Nf1−/− SCs. n = 3 biological replicates per genotype. *P < 0.05 WT versus Nf1−/− by Student’s t-test. (E) Western blot of p19Arf, p53, p16Ink4a, p15Ink4b and Gapdh (loading control) in WT and Nf1−/− SCs.
Human and murine PN exhibit senescence signature
We next evaluated human and murine PN for in vivo evidence of a senescence signature. Human PN tumors strongly expressed senescence markers. In immunohistochemical (IHC) assays, marked increases in the expression of p16INK4A/p15INK4B (Fig. 2A) and the CDKN2A alternative reading frame homologue p14ARF (Fig. 2B) were observed in human PN as compared to control nerve tissues. Similar results were obtained when murine PN were assayed. Nf1flox/flox;PostnCre(+) mice harboring conditional biallelic loss of Nf1 in primitive neural crest derived progenitor SCs (the tumorigenic cell of origin for PN) driven by Cre-recombinase expressed under the control of a 3.9 kb segment of the Periostin promoter (PostnCre) (17) develop tumors that are histopathologically indistinguishable from human PN. Peripheral nerve tissues and PN arising in Nf1flox/flox;PostnCre(+) mice exhibited significantly increased p16Ink4a/p19Arf expression relative to WT controls by IHC staining (Fig. 2C and D). Consistent with these results, p19Arf expression was also significantly elevated in the trigeminal nerve of Nf1flox/flox;PostnCre(+) mice, a cranial nerve that frequently develops PN in mice and humans (Fig. 2E; Supplementary Material, Fig. S1). Immunofluorescence (IF) staining for S100 to identify neural crest derived progenitors and p16Ink4a/p19Arf to identify senescence revealed a high degree of coexpression. Additionally, S100-negative cells were observed as part of the tumor microenvironment (Fig. 2F). Together with studies of cultures in primary SCs, these data indicate that murine and human PN induce known markers of cellular senescence in vivo.
Figure 2.
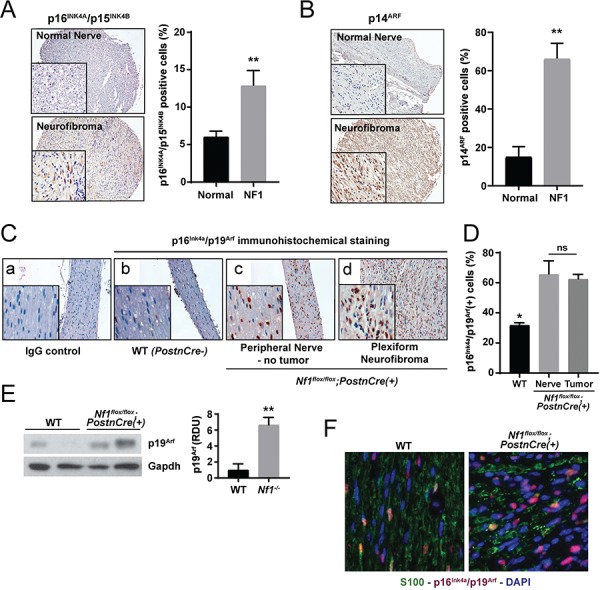
Murine and human PN exhibit a senescence signature. (A) IHC staining for p16INK4A/p15INK4B was performed on human PN and healthy control nerve tissues. The percentage of p16INK4 positive staining cells was quantified. n = 8 biological replicates for PN and n = 7 biological replicates for control nerve tissue. **P < 0.01 PN versus normal nerve control by Student’s t-test. (B) IHC for p14ARF in human PN and healthy control nerve tissues. The percentage of p14ARF positive staining cells was quantified. n = 8 biological replicates for PN and n = 4 biological replicates for control nerve tissue. **P < 0.01 PN versus normal nerve control by Student’s t-test. (C) IHC staining of p16Ink4a/p19Arf expression in peripheral nerve tissue from WT and PN bearing Nf1flox/flox;PostnCre(+) mice. (D) The percentage of p16Ink4a/p19Arf-positive staining cells was quantified. n = 3 biological replicates per group. *P < 0.05 for WT versus Nf1flox/flox;PostnCre nerve and tumor tissue. No statistically significant difference (ns) comparing Nf1flox/flox;PostnCre nerve and tumor bearing tissue. (E) Western blot of p19Arf and Gapdh in the trigeminal nerve tissues of WT and Nf1flox/flox;PostnCre(+) mice. Expression was normalized to Gapdh and quantified in relative densitometry units. **P < 0.01 WT versus Nf1flox/flox;PostnCre(+) by one-way ANOVA followed by Tukey’s multiple comparisons test. n = 5 biological replicates per genotype as shown on expanded panel in Supplementary Material, Figure S1. (F) IF with anti-S100 (GFP), anti-p16Ink4a/p19Arf (RFP) and nuclear (DAPI) markers. Representative merged photomicrographs are shown at 20× magnification.
These data led us to postulate in PN, indolence and tumor growth arrest may be controlled by p19Arf tumor suppressor activity. We therefore bred Nf1 floxed mice with mice harboring a loxP site flanking the first coding exon (exon-1β) of the Arf gene, facilitating Cre-mediated excision of Arf but leaving the linked Ink4a (Cdkn2a) gene intact (18). Embryonic dorsal root ganglion (DRG)/nerve root neurosphere cells (DNSCs) were isolated from the resulting Nf1flox/flox, Nf1flox/flox;Arfflox/+ and Nf1flox/flox;Arfflox/flox genotypes and infected with Cre recombinase expressing adenovirus or empty vector control. These cells contain the neural crest derived tumorigenic cell of origin for PNs (2). Efficient Cre-mediated excision of floxed Nf1 and Arf alleles and corresponding loss of protein expression were confirmed by polymerase chain reaction (PCR) (Supplementary Material, Fig. S2A) and western blot, respectively (Supplementary Material, Fig. S2B). Nf1-Arf double knockout (DKO, Nf1−/−; Arf −/−) DNSCs demonstrated increased proliferation compared to WT and Nf1−/− DNSCs in a gene dosage-dependent fashion (Fig. 3A). Proliferation was confirmed via increased cell-cycle entry into S-phase (Fig. 3B) of the Nf1−/−;Arf −/− DNSCs. Unlike Nf1−/− DNSCS that exhibited increased senescence, Nf1−/−;Arf +/− and Nf1−/−;Arf −/− DNSCs cultures were devoid of senescent cells (Fig. 3C and D). However, the percentage of S-phase cells was significantly higher in homozygous Arf-mutant DNSCs (Fig. 3B). These data indicate that Arf inactivation increases the proliferation of Nf1 mutant DNSCs in a dose-dependent manner with loss of a single Arf allele overcoming the cellular program invoked by loss of Nf1.
Figure 3.
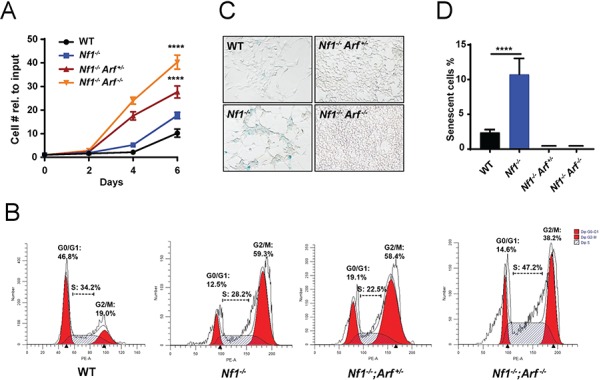
Genetic ablation of p19Arf allows Nf1-null DNSCs to escape senescence and proliferate aberrantly. (A) Proliferation of WT, Nf1−/−, Nf1−/−;Arf +/− and Nf1−/−;Arf −/− DNSCS was assessed by manual cell counting at serial time points as shown. The fold change in cell number relative to input (50 000 cells/well) is shown. (B) Cell cycle of WT, Nf1−/−, Nf1−/−;Arf +/− and Nf1−/−;Arf −/− DNSCS was assessed by flow cytometry. The percentage of cells in G0/G1, S and G2/M phase are denoted as shown. (C) Senescence associated β-galactosidase staining in DNSCs as shown in representative photomicrographs. (D) The percentage of SAS-βgal-positive staining cells relative to total cell number per HPF was quantified. ****P < 0.0001 for Nf1−/− versus WT, Nf1−/−;Arf +/− and Nf1−/−;Arf −/− by one-way ANOVA followed by Tukey’s multiple comparison’s test. n = 3 biological replicates per genotype.
Arf Nf1 −/− SC progenitors phenocopy human ANNUBP
To examine whether Arf loss could directly mediate progression from PN to ANNUBP, we conditionally ablated Arf in the murine model of Nf1 PN. Following Cre-mediated recombination and incubation of the mutant mice, microdissection of the lumbosacral nerve plexus revealed a generalized thickening of the proximal spinal nerve roots as well as multiple discrete tumors arising adjacent to the DRG of Nf1flox/flox, Nf1flox/flox;Arfflox/+ and Nf1flox/flox;Arfflox/flox;PostnCre(+) mutant mice (Fig. 4A and B). Arfflox/flox;PostnCre(+) mice revealed normal nerve root morphology and architecture (Supplementary Material, Fig. S3). Western blot of Nf1/Arf intercrossed mice confirmed loss of p19Arf expression (Fig. 4C).
Figure 4.
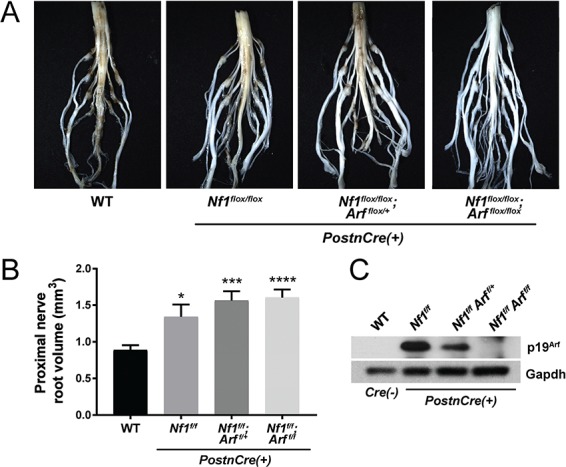
Diffuse morphological changes in the lumbosacral nerve plexus of Nf1/Arf mutant mice. (A) The lumbosacral spinal cord, DRG and associated proximal spinal nerve roots were microdissected from each genotype: WT, Nf1flox/flox, Nf1flox/flox;Arf flox/+ and Nf1flox/flox;Arf flox/flox;PostnCre(+) as shown. (B) Proximal spinal nerve root volume was measured. The number of proximal spinal nerve roots evaluated per genotype are as follows: WT (n = 28), Nf1flox/flox;PostnCre(+) (n = 16), Nf1flox/flox;Arf flox/+;PostnCre(+) (n = 16) and Nf1flox/flox;Arf flox/flox;PostnCre(+) (n = 24). *P < 0.05 WT versus Nf1flox/flox;PostnCre(+).***P < 0.001 WT versus Nf1flox/flox;Arf flox/+;PostnCre(+).****P < 0.0001 WT versus Nf1flox/flox;Arf flox/flox;PostnCre(+). Statistical analysis was performed via one-way ANOVA followed by Sidak’s multiple comparison test. (C) Western blot of p19Arf and Gapdh (loading control) in the trigeminal nerve of each genotype.
Histopathological evaluation confirmed the presence of PNs along multiple proximal spinal nerve roots in Nf1flox/flox,Nf1flox/flox;Arfflox/+ and Nf1flox/flox;Arfflox/flox;PostnCre(+) mutant mice with disrupted nerve architecture, wavy S100+ SCs, increased collagen deposition and mast cell infiltration (Table 1 and Supplementary Material, Fig. S4). Interestingly, Nf1flox/flox;Arfflox/+ and Nf1flox/flox;Arfflox/flox;PostnCre(+) mice also showed outgrowths from peripheral nerves with unique histopathological changes not seen in the Nf1flox/flox;PostnCre(+) mice beginning at ~4 months of life. These lesions met the diagnostic criteria for human ANNUBP based on the presence of increased cellularity, cytological atypia (enlarged, hyperchromatic nuclei), a fascicular growth pattern and loss of the lattice-like CD34+ fibroblastic network seen in PN (Table 1; Fig. 5; Supplementary Material, Fig. S4). Importantly, these lesions also lacked mitotic features required for the diagnosis of low grade MPNST. Cervicothoracic spines and associated nerve roots were embedded, sectioned and examined systematically at each spinal level to identify the presence of tumors meeting diagnostic criteria for PN and ANNUBP (Fig. 6A). The proportion of PN and ANNUBP was similar between Nf1flox/flox;Arfflox/+ and Nf1flox/flox;Arfflox/flox;PostnCre(+) mice (Fig. 6B) at ~6 months of age. Further, while the overall mean proximal nerve root volume was similar among the Nf1flox/flox and Nf1-Arf intercrossed mice, the size of ANNUBP was significantly larger than PN in the same mouse, regardless of genotype (Fig. 6C).
Table 1.
Histopathological features and diagnostic criteria for NF1-associated peripheral nerve sheath tumors
| Diagnosis | Key Diagnostic Features* |
|---|---|
| Plexiform neurofibroma (PN) | Neoplastic proliferation of S100+ Schwann cells with wavy nuclear contours, diffusely enlarging and replacing a major nerve trunk. Thickened perineural sheath. Microenvironment consisting of fibroblasts with myxoid/collagenous matrix and infiltrating inflammatory cells (mast cells and other lineages). Well-developed, lattice-like CD34+ fibroblastic network. |
| Atypical neurofibromatous neoplasm of uncertain biologic potential (ANNUBP) | Schwann cell neoplasm with at least 2 of 4 features: (1) hypercellularity as defined by nuclear overlap at high magnification; (2) cytologic atypia—enlarged nuclei at least 2-3× > normal, hyperchromasia, pleomorphism with irregular chromatin distribution, and/or multinucleated and ‘bizarre’ forms; (3) loss of neurofibroma architecture as defined by fascicular growth pattern or disruption of lattice like CD34+ fibroblastic network; (4) rare mitoses with a mitotic index >1/50 HPF but <3/10 HPF. |
| Malignant peripheral nerve sheath tumor (MPNST) | Features of ANNUBP with mitotic index of 3–9/10 HPF without necrosis (low grade MPNST). MPNST with a mitotic index >10/10 HPF or > 3/10 HPF with necrosis (high grade MPNST). |
*Adapted from Miettinen et al. Human Pathology (2017) 67, 1–10.
Figure 5.
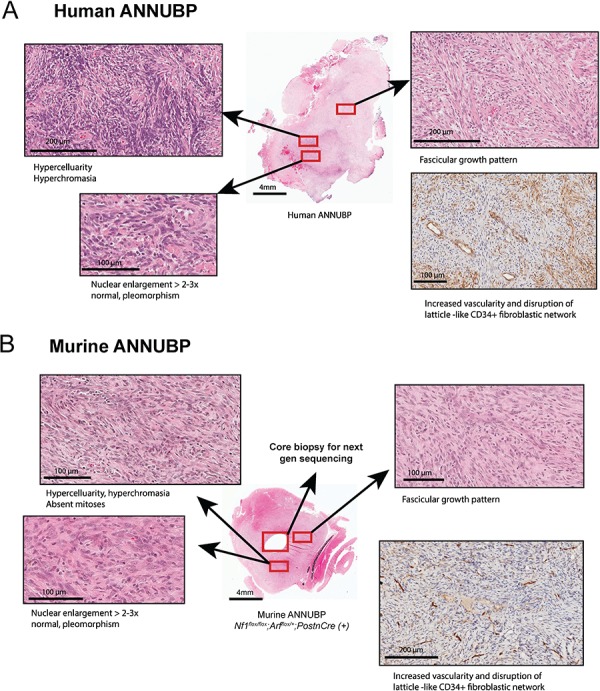
Nf1/Arf mutant mice develop tumors that phenocopy human ANNUBP. (A) Tumor arising in a 60-year-old female patient with a diagnosis of NF1 demonstrating increased cellularity, cytological atypia (enlarged, hyperchromatic and pleomorphic appearing nuclei), fascicular growth pattern and disruption of the lattice-like CD34+ fibroblastic network meeting diagnostic criteria ANNUBP. (B) ANNUBP arising in a representative Nf1flox/flox;Arf flox/+;PostnCre(+) mouse recapitulating the histopathological features observed in the human specimen shown above.
Figure 6.
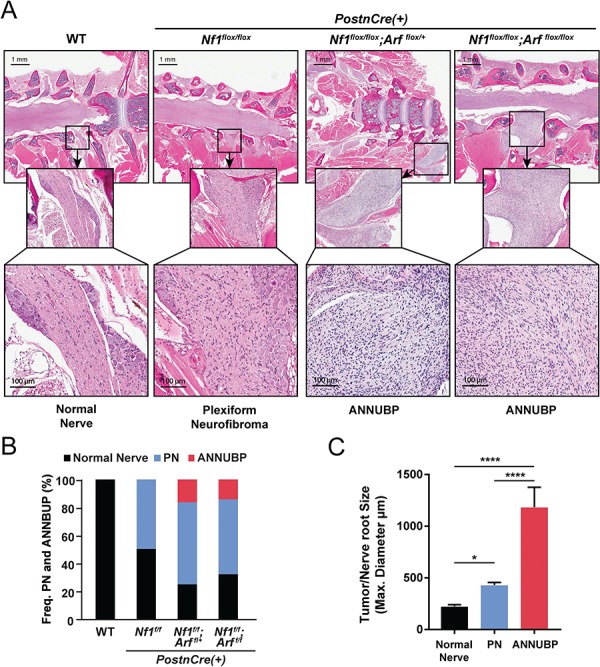
Frequency and size of PN and ANNUBP arising from the cervicothoracic spine of Nf1/Arf mutant mice. (A) Coronal whole spinal sections revealing the spinal cord, DRG with associated proximal spinal nerve roots demonstrating PN and ANNUBP arising from the proximal nerve roots of Nf1flox/flox;PostnCre(+), Nf1flox/flox;Arfflox/+;PostnCre(+) and Nf1flox/flox;Arfflox/flox;PostnCre(+) mice. WT mice exhibited normal nerve architecture and cellularity. (B) Stacked bar plot demonstrating the frequency of PN and ANNUBP arising in the cervical thoracic spinal nerve roots of Nf1flox/flox, Nf1flox/flox;Arf flox/+ and Nf1flox/flox;Arfflox/flox;PostnCre(+) mice. The number of proximal spinal nerve roots evaluated per genotype are as follows: WT (n = 85), Nf1flox/flox;PostnCre(+) (n = 85), Nf1flox/flox;Arf flox/+;PostnCre(+) (n = 87) and Nf1flox/flox;Arf flox/flox;PostnCre(+) (n = 86). (C) The maximal diameter of WT control nerve roots and those infiltrated with PN and ANNUBP lesions were measured on coronal spinal sections and plotted as shown. The number of nerve roots and tumors of each histological subtype are as follows: normal nerve (n = 33), PN (n = 27) and ANNUBP (n = 13). Statistical analysis was performed by one-way ANOVA followed by Tukey’s multiple comparisons test. *P < 0.05 normal nerve versus PN. ****P < 0.0001 ANNUBP versus normal nerve and PN.
Spontaneous progression of ANNUBP to MPNST
A distinguishing feature of Nf1flox/flox;Arfflox/flox;PostnCre(+) mice was the early development of infiltrating and rapidly growing tumors arising from existing PN and ANNUBP lesions (Fig. 7A and B), which met diagnostic criteria for MPNST (Table 1 and Supplementary Material, Fig. S4). Nf1flox/flox;Arf flox/flox;PostnCre(+) mice die of MPNST with 100% penetrance (n = 16/16) and a mean survival time of 4.8 months. Arf heterozygous Nf1flox/flox;Arf flox/+;PostnCre(+) mice exhibit haploinsufficiency with delayed MPNST onset and a mean survival time of 8.7 months (Fig. 7C). A subset of Nf1flox/flox;PostnCre(+) mice also die from PN nerve compression of vital structures. Mice containing a disruption of the Arf allele in Schwann cells did not form tumors (Supplementary Material, Fig. S3). Collectively, the present results demonstrate causality of sequential Nf1 and Arf loss in the progression of PN to ANNUBP and MPNST. In addition, IF and IHC stains against p16Ink4a/p19Arf and pRb confirm loss of the senescence signature in vivo with progression of PN to ANNUBP and MPNST (Supplementary Material, Fig. S5).
Figure 7.
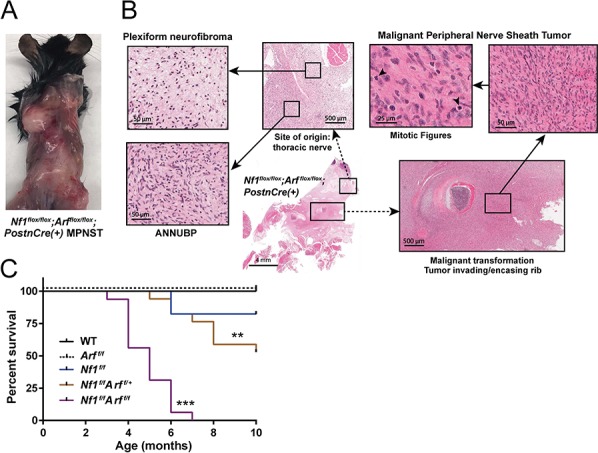
Nf1/Arf mutant mice die from tumor progression to MPNST. (A) Nf1flox/flox;Arfflox/flox;PostnCre(+) mouse with multiple, rapidly growing and infiltrative masses. A diagnosis of MPNST was confirmed histopathologically post-mortem. (B) PN arising from a thoracic nerve root in a representative Nf1flox/flox;Arfflox/flox;PostnCre(+) mouse. Progression to ANNUBP is observed with hypercellularity, cellular atypia and a fascicular growth pattern. Subsequent transition to MPNST with encasement/invasion of surrounding rib and multiple mitotic figures is seen. (C) Kaplan Meier survival curve of WT (n = 14), Arf flox/flox;PostnCre(+) (n = 9) Nf1flox/flox (n = 17), Nf1flox/flox;Arf flox/+;PostnCre(+) (n = 17) and Nf1flox/flox;Arf flox/flox;PostnCre(+) (n = 16) mice. Statistical analysis was performed using a logrank test with Bonferroni post hoc adjustment for multiple comparisons. ***P < 0.001 Nf1flox/flox;Arfflox/flox;PostnCre(+) versus WT, Arfflox/flox;PostnCre(+) and Nf1flox/flox;PostnCre(+). **P < 0.01 Nf1flox/flox;Arfflox/flox;PostnCre(+) versus Nf1flox/flox;Arf flox/+;PostnCre(+).
Discussion
Mammalian cells have developed intricate mechanisms to prevent pathological stimuli resulting in cells undergoing tumorigenesis and transformation. When constitutively active stimuli are present, such as chronic oncogenic signaling, tumor suppressor networks are engaged that antagonized aberrant proliferation by mechanisms that include the induction of cellular senescence. The expression of oncogenic Ras induces senescence-like growth arrest in primary cells and is regarded a major mechanism to prevent the proliferation of incipient cancer cells (19). Colonic serrated adenomas initiated oncogenic KrasG12D, overexpress p16INK4A and undergo senescence (8). Their progression to malignant adenocarcinomas is linked to Ink4/Arf ablation. Similarly, benign melanocytic human nevi, harboring BRAFV600E mutations, have been shown to overexpress p16INK4A and acquire CDKN2A mutations upon progression to malignant melanoma (20). Previously, Courtois-Cox et al. (21) reported that loss of NF1 induced a senescence in human fibroblasts through upregulation of p16. Here we show that loss of Nf1 leads to hyperactive Ras and increased senescence in primary Schwann cells consistent with these other disease models.
Human genetic data from small case series in neurofibromas have led to speculation whether haploinsufficient or nullizygous loss of CDKN2A/B is necessary and/or sufficient to promote ANNUBP and subsequent progression to MPNST. One series used microarray to implicate chromosome 9p21.3 band deletions as the predominating genetic driver of ANNUBP (11). A second study, consisting of PN and a single ANNUBP, suggested that heterozygous loss of CDKN2A was sufficient to generate cytologic atypia, but nullizygous loss was required for the formation of ANNUBP (22). A confounding feature of both studies was the presence of additional gene mutations including known tumor suppressors. The power of genetically engineered mouse (GEM) models allowed us to focus specifically on Arf in the context of Nf1-mediated PN formation. Our experimental findings indicate that inactivating a single allele of Arf in Nf1 deficient SCs is sufficient to promote the genesis of ANNUBP and MPNST. These findings suggest that loss of heterozygosity of Arf is not required for the development of ANNUBP or malignant transformation. Additional analysis will be required to better understand the detailed dynamics of the initiating events.
Developing effective strategies to treat orphan cancers with limited numbers of patients remains a clinical challenge. GEM models have demonstrated their utility to provide mechanistic insights into the biology of these tumors, thereby serving as a catalyst for drug discovery. In particular, genetic and pharmacologic studies in NF1-associated GEM models have predicted patient responses and provided insights into future trials with high fidelity (23–26). The studies outlined here thus provide a potential opportunity for treatment and prevention of ANNUBP and MPNSTs. It remains to be determined whether the majority of ANNUBP will respond to MAPK/ERK kinase (MEK) and other single agent receptor tyrosine kinase (RTK) inhibitors that have shown some efficacy in treating PN (27,28). Further, the observation that human ANNUBP and many MPNST are Ink4/Arf deficient but p53 competent, provides a unique window of therapeutic opportunity for drugs such as MDM2 and/or CDK4/6 inhibitors as potential avenues of treatment.
Materials and Methods
Experimental animals and genotyping
The genetically engineered Nf1 floxed, Arf floxed and PostnCre mice were utilized for in vivo studies, with genotypes confirmed by PCR as described. The WT, Nf1 floxed and recombination bands were detected using the following primers: P1: 5′-AATGTGAAATTGGTGTCGA GTAAGGTAACCAC 3′, P2: 5′-TTAAGAGCATCTGCTGCTCTTAGAGGGAA 3′, P3: 5′-TCAG ACTGATTGTTGTACCTGATGGTTGTACC 3′. The Arf floxed band was detected using forward primer: 5′-ACTGCAGCCAGACCACTAGG 3′ and reverse primer: 5′-AGCTCGGAGATTG AGAAAGC 3′. PostnCre was detected using forward primer: 5′-ATGTTTAGCTGGCCCAAATG-3′ and reverse primer: 5′-CGACCACTACCAGCAGAACA-3′. Animal care and experiments were conducted according to the guidelines established by the Indiana University Animal Care and Use Committee.
Nerve tree microdissection and measurement of tumor volume
Immediately postmortem, fresh blood and select tissues were harvested and mice were perfused and fixed in 10% neutral buffered formalin. The bodies were decalcified in a 50:50 solution of 10% formic acid and 10% neutral buffered formalin solution. The proximal spinal nerve roots from the lumbosacral spine were dissected microscopically. The volume of proximal peripheral nerves was determined using calipers to measure the length and width of dissected tumors (or equivalent region in absence of tumor) in maximal dimension. Volume was then approximated using the formula for the volume of a spheroid = 0.52 × (width)2 × length.
Histopathology
Cervical and thoracic spines with associated DRG and proximal spinal nerve roots were excised from euthanized animals, fixed with 10% formalin, decalcified, dehydrated with graded alcohols, cleared with xylenes, infiltrated with molten paraffin and embedded in paraffin blocks. Five micron thick sections were cut on a Leica rotary microtome and stained with hematoxylin and eosin. Mice were also carefully examined for evidence of gross tumors, which were dissected and excised, formalin fixed, processed and paraffin-embedded for histopathological analysis. The liver and lungs were also harvested to evaluate for evidence of metastatic disease. PN, ANNUBP and MPNSTs were identified according to criteria adopted from a recent consensus overview by Miettinen et al. (10) and are outlined in Table 1.
Immunohistochemistry
Paraffin sections were deparaffinized, hydrated and transferred to 0.1 M citrate buffer (pH 6.0) for antigen retrieval. Slides were pressure cooked for 3 min in citrate buffer, cooled for 1 h and then rinsed in distilled water. Sections were quenched with 3% hydrogen peroxide for 10 min, rinsed in distilled water and blocked in 5% normal goat serum in tris buffered saline with tween (TBST) (TBS buffer +0.1% tween 20). Sections were incubated overnight at 4°C in primary antibody diluted in blocking buffer; S100 (z0311, 1:400 dilution, Dako), CD34 (ab81289, 1:2500 dilution, Abcam), H3K27me (CST9733, 1:200 dilution, Cell Signaling Technology), p16Ink4a/p19Arf (ab54210, 1:500 dilution, Abcam), p15INK4B/p16INK4A (sc377412, 1:250 dilution, Santa Cruz Biotechnology) and p14ARF (CST2407, 1:50 dilution, Cell Signaling Technology). Sections were then incubated in appropriate biotinylated secondary antibodies for 1 h at room temperature, goat anti-rabbit (B8895, 1:800, Sigma). Vectastain Elite ABC reagent was applied for 30 min at room temperature. Color development with Vectastain DAB was observed under the microscope and the reaction was terminated by rinsing in distilled water. Sections were counterstained with modified Mayer’s hematoxylin (vector), dehydrated, cleared and coverslipped. When anti-mouse primary antibody was used, Rodent Block M (BioCare Medical Mouse-on-Mouse HRP Polymer kit, MM510) was applied for 30 min at room temperature instead of blocking buffer for 1 h. Additionally, mouse-on-mouse HRP polymer was applied for 15 min at room temperature instead of the secondary antibody and ABC reagent. Statistical comparisons between control and tumor samples were conducted using Student’s t-test. Whole slide images were acquired on Aperio ScanScope CS and QImaging Retiga 2000R camera on a Nikon Eclipse 80i microscope.
Immunofluorescence
Paraffin sections were deparaffinized, hydrated and transferred to 0.1 M citrate buffer (pH 6.0) for antigen retrieval. Slides were pressure cooked for 3 min in citrate buffer, cooled for 1 h and then rinsed in distilled water. Sections were quenched with 3% hydrogen peroxide for 10 min, rinsed in distilled water and blocked in Rodent Block M (BioCare Medical Mouse-on-Mouse HRP Polymer kit, MM510) for 30 min. Sections were incubated at 4°C overnight in primary antibodies diluted in blocking buffer (5% normal goat serum in TBST), S100 (z0311, 1:400 dilution, Dako) and p16Ink4a/p19Arf (ab54210, 1:400, Abcam). Sections were then incubated in appropriate fluorophore-conjugated secondary antibodies for 1 h at room temperature, goat anti-rabbit 488 (A11034, 1:1000, Invitrogen), goat anti-mouse 568 (A11031, 1:1000, Invitrogen). Slides were then rinsed and stained with Hoechst 33342 (1:5000, Molecular Probes) for 5 min at room temperature. Autofluorescence was quenched with Vector TrueVIEW. Slides were coverslipped and imaged on the QImaging Retiga 2000R camera on a Nikon Eclipse 80i microscope, using an X-Cite 120 fluorescence lamp. Merged images were processed using NIH Image J software.
DNSC isolation and culture
Mouse embryos were removed from pregnant female mice at E13.5 following euthanasia. The DRG and spinal nerve roots were microdissected under a stereomicroscope. DRG and/or nerve root neurosphere culture was performed in serum-free DMEM/F12 media containing penicillin/streptomycin (0.1%), fungizone (40 mg/ml), B27 (without vitamin A), epidermal growth factor (20 ng/ml) and basic fibroblast growth factor (40 ng/ml, Sigma). The sphere cells were fed every 3–4 days and passaged upon reaching confluence. One-third of the condition medium was retained with fresh medium changes.
Schwann cell differentiation from DNSCs
The 25 000 DNSCs were seeded on fibronectin-coated 12-well plates and cultured in DMEM/F12 media supplemented with 10% fetal bovine serum (FBS) and nerve growth factor 200 ng/ml for 6 days.
Proliferation assays
DNSCs were seeded on fibronectin-coated 12-well plates at a density of 50 000 cells per well and cultured in serum-free DMEM/F12 media containing penicillin/streptomycin (0.1%), fungizone (40 mg/ml), B27 (without vitamin A), epidermal growth factor (20 ng/ml) and basic fibroblast growth factor (40 ng/ml, Sigma). Viable cells as determined by trypan blue dye exclusion were counted manually on a glass hemocytometer.
Quantitative Real-time Polymerase Chain Reaction (RT-PCR)
Messenger ribonucleic acids (mRNAs) were isolated from primary Schwann cells cultured from WT and Nf1flox/flox;PostnCre mice using PureLink RNA Micro Kit (Cat#15596026, Thermofisher). mRNA was reverse-transcribed to complementary deoxyribonucleic acid (cDNA) using High-Capacity cDNA Reverse Transcription Kit with RNase Inhibitor (Cat#4374966, Thermofisher). Primers were obtained from Invitrogen for quantitative RT-PCR (qRT-PCR) using SYBER-green (Cat#4385612, Thermofisher). The sequence of forward and reverse primers utilized for qRT-PCR was as follows: Cdkn2a [variant 1 (Arf)] forward primer: 5′-CATGTTGTTGAGGCTAGAGAGG-3′, Cdkn2a reverse primer: 5′-TGAGCAGAAGAGCTGCTACG-3′, Cdkn2b forward primer: 5′-CCCTGCCACCCTTACCAGA-3′, Cdkn2b reverse primer: 5′-GCAGATACCTCGCAATGTCAC-3′. Gapdh forward primer: 5′-TGATGACATCAAGAAGGTGGTGAAG-3′, Gapdh reverse primer: 5′-TCCTTGGAGGCCATGTAGGCCAT-3′. Triplicate reactions were performed on an Applied Biosystems 7500 Real-Time PCR instrument. Relative gene expression was normalized to endogenous Gapdh. The fold change in Cdkn2a and Cdkn2b in Nf1−/− Schwann cells relative to WT was determined using the ΔΔCT method.
Senescence
Cellular senescence was assessed by β-galatosidase utilizing a Senescence Cells Histochemial Staining Kit (CS0030, Sigma). Briefly, growth medium was aspirated from adherent cells in culture. Cells were washed twice and fixed for 8 min at room temperature. Cells were then incubated with β-galactosidase (β-gal) staining mixture at 37°C without CO2 for 4 h or until blue staining was apparent. β-gal stained cells and total cells were counted on photomicrographs acquired at high power. The percentage of senescence cells expressing β-gal was determined.
Ras activity assays
A non-radioactive Ras Activation Assay Kit (#17-218, Millipore) was used to detect and GTP-bound Ras in DNSC lysates. DNSCs were cultured to ~90% confluence in 10 cm dishes. Upon removal of culture media, cells were rinsed 2× with ice cold phosphate buffered saline (PBS), followed by the addition of ice cold 500 μl Mg2+ Lysis Buffer (MLB) containing 10% glycerol, prepared according to the manufacturer’s recommendation. A cell scraper was used to detach cells from plates, and lysates were transferred to microfuge tubes on ice, followed by sonication for 5 s twice at a frequency of 12 kHz. Insoluble cellular debris was pelleted by centrifugation at 14 000×g for 5 min at 4°C. The extract (supernatant) was removed, flash frozen and stored at −80°C for future use. Pull down of Ras-GTP was performed using 10 μg of Ras assay reagent (Raf-1 RBD, agarose), which was added to each cell extract and incubated for 45 min with gentle agitation at 4°C. Agarose beads were pelleted by brief centrifugation (10 s, 14 000×g, 4°C). The supernatant was removed and discarded. Beads were washed 3× with 500 μl MLB, followed by resuspension in 40 μl of 2× Laemmli reducing buffer with 2 μl of 1 M dithiothreitol and boiled for 5 min to release GTP-bound Ras from the beads. Ras-GTP was detected by western blot, incubating with anti-Ras, clone RAS10 (#05-516, Millipore) diluted in freshly prepared PBST-MLK overnight with agitation and goat anti-mouse-HRP conjugate (#12-349, Millipore) as directed.
Western blot
Isolated proteins were fractionated using NuPAGE 4–12% Bis-Tris Gels (Invitrogen Cat#NP0322BOX) and electro-transferred to PVDF membranes. Immunoblots were carried out using antibodies specific to p19Arf (Cat#05-929, EMD), p16Ink4a/p15Ink4b (Cat#377412, Santa Cruz), p53 (Cat#CST-2524, Cell Signaling Technology), neurofibromin (#SC-67, Santa Cruz) and Gapdh (#CST-5174, Cell Signaling Technology). After incubation with appropriate HRP-conjugated secondary antibodies [anti-rabbit (#NA934V, GE Healthcare) and anti-rat (#AP-136P, EMD), signals were detected using ECL chemoluminescence substrate (ECL Prime, GE Healthcare).
Statistical analysis
Statistical analyses were performed with GraphPad Prism 7.0 software (GraphPad, La Jolla, CA). Analysis of variance (ANOVA) and Student’s t-tests with post hoc correction for multiple comparisons were used to evaluate for statistically significant differences between samples as described in detail within the figure legends. Statistical analysis of Kaplan Meier survival curves was performed in SAS software using a logrank test with Bonferroni post hoc adjustment for multiple comparisons.
Supplementary Material
Acknowledgements
We thank Drs Luis Parada (Memorial Sloan Kettering) and Kevin Shannon (UCSF) for helpful discussions and editorial guidance.
Conflict of Interest statement. The authors have no conflicts of interest to disclose.
Funding
Developmental and Hyperactive Ras Tumor SPORE funded through the National Institutes of Health/National Cancer Institute (NIH/NCI) (U54-CA196519-04); S.R. is a fellow in the Pediatric Scientist Development Program supported by award number K12-HD000850 from the Eunice Kennedy Shriver National Institute of Child Health and Human Development; Precision Health Initiative at Indiana University and the Riley Children’s Foundation.
References
- 1. Carey J.C., Baty B.J., Johnson J.P., Morrison T., Skolnick M. and Kivlin J. (1986) The genetic aspects of neurofibromatosis. Ann. N. Y. Acad. Sci., 486, 45–56. [DOI] [PubMed] [Google Scholar]
- 2. Chen Z., Liu C., Patel A.J., Liao C.P., Wang Y. and Le L.Q. (2014) Cells of origin in the embryonic nerve roots for NF1-associated plexiform neurofibroma. Cancer Cell, 26, 695–706. [DOI] [PMC free article] [PubMed] [Google Scholar]
- 3. Zhu Y., Ghosh P., Charnay P., Burns D.K. and Parada L.F. (2002) Neurofibromas in NF1: Schwann cell origin and role of tumor environment. Science, 296, 920–922. [DOI] [PMC free article] [PubMed] [Google Scholar]
- 4. Evans D.G., Baser M.E., McGaughran J., Sharif S., Howard E. and Moran A. (2002) Malignant peripheral nerve sheath tumours in neurofibromatosis 1. J. Med. Genet., 39, 311–314. [DOI] [PMC free article] [PubMed] [Google Scholar]
- 5. Nguyen R., Dombi E., Widemann B.C., Solomon J., Fuensterer C., Kluwe L., Friedman J.M. and Mautner V.F. (2012) Growth dynamics of plexiform neurofibromas: a retrospective cohort study of 201 patients with neurofibromatosis 1. Orphanet J. Rare Dis., 7, 75. [DOI] [PMC free article] [PubMed] [Google Scholar]
- 6. Honda R. and Yasuda H. (1999) Association of p19(ARF) with Mdm2 inhibits ubiquitin ligase activity of Mdm2 for tumor suppressor p53. EMBO J., 18, 22–27. [DOI] [PMC free article] [PubMed] [Google Scholar]
- 7. Romagosa C., Simonetti S., Lopez-Vicente L., Mazo A., Lleonart M.E., Castellvi J. and Ramon y Cajal S. (2011) p16(Ink4a) overexpression in cancer: a tumor suppressor gene associated with senescence and high-grade tumors. Oncogene, 30, 2087–2097. [DOI] [PubMed] [Google Scholar]
- 8. Bennecke M., Kriegl L., Bajbouj M., Retzlaff K., Robine S., Jung A., Arkan M.C., Kirchner T. and Greten F.R. (2010) Ink4a/Arf and oncogene-induced senescence prevent tumor progression during alternative colorectal tumorigenesis. Cancer Cell, 18, 135–146. [DOI] [PubMed] [Google Scholar]
- 9. Higham C.S., Dombi E., Rogiers A., Bhaumik S., Pans S., Connor S.E.J., Miettinen M., Sciot R., Tirabosco R., Brems H. et al. (2018) The characteristics of 76 atypical neurofibromas as precursors to neurofibromatosis 1 associated malignant peripheral nerve sheath tumors. Neuro Oncol., 20, 818–825. [DOI] [PMC free article] [PubMed] [Google Scholar]
- 10. Miettinen M.M., Antonescu C.R., Fletcher C.D.M., Kim A., Lazar A.J., Quezado M.M., Reilly K.M., Stemmer-Rachamimov A., Stewart D.R., Viskochil D. et al. (2017) Histopathologic evaluation of atypical neurofibromatous tumors and their transformation into malignant peripheral nerve sheath tumor in patients with neurofibromatosis 1-a consensus overview. Hum. Pathol., 67, 1–10. [DOI] [PMC free article] [PubMed] [Google Scholar]
- 11. Beert E., Brems H., Daniels B., De Wever I., Van Calenbergh F., Schoenaers J., Debiec-Rychter M., Gevaert O., De Raedt T., Van Den Bruel A. et al. (2011) Atypical neurofibromas in neurofibromatosis type 1 are premalignant tumors. Genes Chromosomes Cancer, 50, 1021–1032. [DOI] [PubMed] [Google Scholar]
- 12. Brohl A.S., Kahen E., Yoder S.J., Teer J.K. and Reed D.R. (2017) The genomic landscape of malignant peripheral nerve sheath tumors: diverse drivers of Ras pathway activation. Sci. Rep., 7, 14992. [DOI] [PMC free article] [PubMed] [Google Scholar]
- 13. Lee W., Teckie S., Wiesner T., Ran L., Prieto Granada C.N., Lin M., Zhu S., Cao Z., Liang Y., Sboner A. et al. (2014) PRC2 is recurrently inactivated through EED or SUZ12 loss in malignant peripheral nerve sheath tumors. Nat. Genet., 46, 1227–1232. [DOI] [PMC free article] [PubMed] [Google Scholar]
- 14. Vogel K.S., Klesse L.J., Velasco-Miguel S., Meyers K., Rushing E.J. and Parada L.F. (1999) Mouse tumor model for neurofibromatosis type 1. Science, 286, 2176–2179. [DOI] [PMC free article] [PubMed] [Google Scholar]
- 15. Buchstaller J., McKeever P.E. and Morrison S.J. (2012) Tumorigenic cells are common in mouse MPNSTs but their frequency depends upon tumor genotype and assay conditions. Cancer Cell, 21, 240–252. [DOI] [PMC free article] [PubMed] [Google Scholar]
- 16. King D., Yang G., Thompson M.A. and Hiebert S.W. (2002) Loss of neurofibromatosis-1 and p19(ARF) cooperate to induce a multiple tumor phenotype. Oncogene, 21, 4978–4982. [DOI] [PubMed] [Google Scholar]
- 17. Lindsley A., Snider P., Zhou H., Rogers R., Wang J., Olaopa M., Kruzynska-Frejtag A., Koushik S.V., Lilly B., Burch J.B. et al. (2007) Identification and characterization of a novel Schwann and outflow tract endocardial cushion lineage-restricted periostin enhancer. Dev. Biol., 307, 340–355. [DOI] [PMC free article] [PubMed] [Google Scholar]
- 18. Gromley A., Churchman M.L., Zindy F. and Sherr C.J. (2009) Transient expression of the Arf tumor suppressor during male germ cell and eye development in Arf-Cre reporter mice. Proc. Natl. Acad. Sci. U. S. A., 106, 6285–6290. [DOI] [PMC free article] [PubMed] [Google Scholar]
- 19. Serrano M., Lin A.W., McCurrach M.E., Beach D. and Lowe S.W. (1997) Oncogenic ras provokes premature cell senescence associated with accumulation of p53 and p16INK4a. Cell, 88, 593–602. [DOI] [PubMed] [Google Scholar]
- 20. Damsky W.E. and Bosenberg M. (2017) Melanocytic nevi and melanoma: unraveling a complex relationship. Oncogene, 36, 5771–5792. [DOI] [PMC free article] [PubMed] [Google Scholar]
- 21. Courtois-Cox S., Genther Williams S.M., Reczek E.E., Johnson B.W., McGillicuddy L.T., Johannessen C.M., Hollstein P.E., MacCollin M. and Cichowski K. (2006) A negative feedback signaling network underlies oncogene-induced senescence. Cancer Cell, 10, 459–472. [DOI] [PMC free article] [PubMed] [Google Scholar]
- 22. Carrio M., Gel B., Terribas E., Zucchiatti A.C., Moline T., Rosas I., Teule A., Ramon Y.C.S., Lopez-Gutierrez J.C., Blanco I. et al. (2018) Analysis of intratumor heterogeneity in neurofibromatosis type 1 plexiform neurofibromas and neurofibromas with atypical features: correlating histological and genomic findings. Hum. Mutat., 39, 1112–1125. [DOI] [PubMed] [Google Scholar]
- 23. Staser K., Park S.J., Rhodes S.D., Zeng Y., He Y.Z., Shew M.A., Gehlhausen J.R., Cerabona D., Menon K., Chen S. et al. (2013) Normal hematopoiesis and neurofibromin-deficient myeloproliferative disease require Erk. J. Clin. Invest., 123, 329–334. [DOI] [PMC free article] [PubMed] [Google Scholar]
- 24. Chang T., Krisman K., Theobald E.H., Xu J., Akutagawa J., Lauchle J.O., Kogan S., Braun B.S. and Shannon K. (2013) Sustained MEK inhibition abrogates myeloproliferative disease in Nf1 mutant mice. J. Clin. Invest., 123, 335–339. [DOI] [PMC free article] [PubMed] [Google Scholar]
- 25. Jessen W.J., Miller S.J., Jousma E., Wu J., Rizvi T.A., Brundage M.E., Eaves D., Widemann B., Kim M.O., Dombi E. et al. (2013) MEK inhibition exhibits efficacy in human and mouse neurofibromatosis tumors. J. Clin. Invest., 123, 340–347. [DOI] [PMC free article] [PubMed] [Google Scholar]
- 26. Yang F.C., Ingram D.A., Chen S., Zhu Y., Yuan J., Li X., Yang X., Knowles S., Horn W., Li Y. et al. (2008) Nf1-dependent tumors require a microenvironment containing Nf1+/−− and c-kit-dependent bone marrow. Cell, 135, 437–448. [DOI] [PMC free article] [PubMed] [Google Scholar]
- 27. Dombi E., Baldwin A., Marcus L.J., Fisher M.J., Weiss B., Kim A., Whitcomb P., Martin S., Aschbacher-Smith L.E., Rizvi T.A. et al. (2016) Activity of selumetinib in neurofibromatosis type 1-related plexiform neurofibromas. N. Engl. J. Med., 375, 2550–2560. [DOI] [PMC free article] [PubMed] [Google Scholar]
- 28. Robertson K.A., Nalepa G., Yang F.C., Bowers D.C., Ho C.Y., Hutchins G.D., Croop J.M., Vik T.A., Denne S.C., Parada L.F. et al. (2012) Imatinib mesylate for plexiform neurofibromas in patients with neurofibromatosis type 1: a phase 2 trial. Lancet Oncol., 13, 1218–1224. [DOI] [PMC free article] [PubMed] [Google Scholar]
Associated Data
This section collects any data citations, data availability statements, or supplementary materials included in this article.


