Abstract
Background
To study miR-30b-5p expression in esophageal squamous cell carcinoma (ESCC) by comparisons between tumor tissues and matched adjacent non-cancerous tissues to elucidate the correlation between miR-30b-5p expression and ESCC clinical parameters, and to explore the signaling pathways associated with miR-30b-5p and key target genes.
Methods
Clinical data, cancer tissues, and adjacent non-cancerous tissues of 32 patients diagnosed with ESCC were collected from Taizhou Hospital of Zhejiang Province. The expression levels of miR-30b-5p were determined by real-time polymerase chain reaction (RT-PCR). mRNA data for ESCC tissues and normal tissues, and clinical materials of patients with ESCC were obtained from the Gene Expression Omnibus (GEO) database and The Cancer Genome Atlas (TCGA). Associations between miR-30b-5p expression and clinical features of patients with ESCC and overall survival were explored. A bioinformatics analysis was performed to determine the pathways and key miR-30b-5p targets associated with ESCC. Additionally, a cytological experiment was performed to evaluate the biological functions of miR-30b-5p. Finally, correlations between miR-30b-5p and key targets involved in PI3K/Akt signaling pathways were validated by western blotting.
Results
The expression level of miR-30b-5p in the 32 ESCC tissues was significantly lower than that in adjacent normal tissues (P<0.01) and was significantly disparate in the T stage, with higher expression in T1 than in T2 (P<0.05). Among the patients with higher expression levels of miR-30b-5p in ESCC tissues than in adjacent normal tissues, patients with higher expression of miR-30b-5p had a better prognosis (P<0.05). An analysis of gene chip data from the GEO database showed similar results. A gene enrichment analysis indicated a series of pathways that may be associated with the downregulation of miR-30b-5p, including focal adhesion, ECM–receptor interaction, and PI3K/Akt signaling pathways. Seven key target genes (PDGFRB, VIM, ITGA5, ACTN1, THBS2, SERPINE1, and RUNX2) were identified; these were found to be upregulated in ESCC tissues and were negatively correlated with miR-30b-5p. Functional experiments showed that miR-30b-5p attenuated migration (P<0.01) and invasion (P<0.05) in the Eca109 cell line. Moreover, the levels of ITGA5, PDGFRB, p-PI3K, and p-AKT, which are involved in the PI3K/Akt signaling pathway, were decreased in the miR-30b-5p-overexpressing Eca109 cell line.
Conclusions
Upregulated miR-30b-5p may inhibit migration and invasion in ESCC by targeting ITGA5, PDGFRB, and signaling pathways, such as PI3K/Akt, involved in ESCC regulation. Our results indicate that miR-30b-5p plays an important role in the occurrence and progression of ESCC and is a potential therapeutic target.
Keywords: miR-30b-5p, esophageal squamous cell carcinoma (ESCC), prognosis, pathway
Introduction
Esophageal cancer (EC) is one of the most widespread malignant tumors, with increasing incidence and mortality rates. More than 90% of ECs are esophageal squamous cell carcinoma (ESCC) (1). The incidence of ESCC is particularly high in Asian countries, exceeding 1/1,000 yearly (2), and although substantial developments have recently been made in the development of diagnostic and treatment approaches, the 5-year survival rate is still <10% (3). Therefore, it is necessary to identify new biomarkers to improve early diagnosis, therapy, and prognosis.
MicroRNAs (miRNAs) are short noncoding RNAs, generally 20–24 nucleotides in length, with crucial roles in the regulation of gene expression (4). There is increasing evidence that abnormal miRNA expression is related to a variety of tumors, including cervical tumors (5), gastric tumors (6), and lung tumors (7), and numerous studies have proven that miRNAs influence cell proliferation, differentiation, and apoptosis as well as cell cycle regulation (8-10).
miR-30b-5p, a microRNA, reportedly acts as a prognostic factor and a tumor regulator via target genes. For instance, miR-30b-5p regulates cell proliferation by directly targeting MTDH in glioma (11). Further, miR-30b-5p has been shown to repress cell growth and invasion by targeting HOXA1 in EC (12). Additionally, miR-30b-5p could affect non-small cell lung cancer cell invasion and migration by regulating Cthrc1 (13). Moreover, miR-30b-5p is a potential prognostic marker and therapeutic target for colorectal tumors (14), and a higher miR-30b-5p expression level is significantly associated with a shorter recurrence-free survival in patients with hepatocellular carcinoma (15).
Although its roles in other tumors have been well characterized, studies on the roles of miR-30b-5p in ESCC are lacking. Thus, in this study, we investigated the potential role of miR-30b-5p in the occurrence, progression, and prognosis of ESCC. In addition, we explored key target genes and signaling pathways associated with miR-30b-5p in ESCC by a comprehensive bioinformatics analysis.
Methods
Tissue samples and cell line
A total of 32 matched primary ESCC tissues and adjacent normal tissues were collected from the human tissue bank at Taizhou Hospital of Zhejiang Province between November 3, 2006 and July 30, 2014. None of the patients received radiotherapy, chemotherapy, or other medical interventions. The study was approved by the ethics review board at Taizhou Hospital of Zhejiang Province, and informed consent was obtained from all participants (Table 1). Eca109 cells were obtained from the Enze Medical Research Center.
Table 1. Clinical characteristics of the ESCC patients included from hospital.
| Clinical characteristics | Number | Relative expression of miR-30b-5p | ||
|---|---|---|---|---|
| Mean ± SD | t | P | ||
| Gender | 0.066 | 0.948 | ||
| Male | 25 | 1.12±0.83 | ||
| Female | 7 | 1.10±0.96 | ||
| Age, years | 0.014 | 0.989 | ||
| ≥60 | 21 | 1.12±1.00 | ||
| <60 | 11 | 1.12±0.44 | ||
| Location | F=1.119a | 0.340 | ||
| Upper | 3 | 0.80±0.65 | ||
| Middle | 20 | 1.29±0.94 | ||
| Lower | 9 | 0.84±0.60 | ||
| Tumor Grade | F=1.246a | 0.303 | ||
| Well | 5 | 0.58±0.29 | ||
| Moderately | 23 | 1.20±0.92 | ||
| Poorly | 4 | 1.33±0.66 | ||
| T status | F=4.008a | 0.017* | ||
| T1 | 3 | 2.53±1.34 | ||
| T2 | 6 | 0.86±0.82 | ||
| T3 | 18 | 1.01±0.62 | ||
| T4 | 5 | 1.00±0.70 | ||
| N status | F=0.593a | 0.625 | ||
| N0 | 15 | 1.32±1.00 | ||
| N1 | 9 | 1.02±0.88 | ||
| N2 | 4 | 0.79±0.42 | ||
| N3 | 4 | 0.92±0.23 | ||
a, one-way analysis of variance (ANOVA) test was utilized; *, comparison of miR-30b-5p expression between or among each variable is statistical significance. t, Student’s t-test. SD, standard deviation; ESCC, esophageal squamous cell carcinoma.
Estimation of miR-30b-5p expression using GEO and TCGA miRNA-seq data
The GSE43732 (China, 2014) dataset was downloaded from the GEO website (https://www.ncbi.nlm.nih.gov/geo/query/acc.cgi) using the key terms “miRNA” and “esophageal squamous carcinoma” to obtain miRNA expression data as well as clinical and prognostic data for 119 patients with ESCC and for normal tissues adjacent to carcinoma tissues (Table 2). The difference in miR-30b-5p expression between ESCC and normal samples was evaluated using the GEO2R online analysis tool, and the data were normalized by 2nd transformation. The RNA profile, isoform of miR-30b-5p, and corresponding clinical data for 95 patients with ESCC were obtained from The Cancer Genome Atlas (TCGA) platform (https://cancergenome.nih.gov/), which is rich in cancer-related data, and the expression values were normalized by log2 transformation.
Table 2. Clinical characteristics of the ESCC patients included in GEO.
| Clinical characteristics | N | Relative expression of miR-30b-5p | ||
|---|---|---|---|---|
| Mean ± SD | t | P | ||
| Gender | −1.516 | 0.132 | ||
| Male | 98 | 0.80±0.41 | ||
| Female | 21 | 0.96±0.55 | ||
| Age, years | −1.418 | 0.159 | ||
| ≥60 | 58 | 0.77±0.34 | ||
| <60 | 61 | 0.88±0.51 | ||
| Family history | 0.525 | 0.605 | ||
| Positive | 42 | 0.89±0.67 | ||
| Negative | 40 | 0.81±0.37 | ||
| Tobacco | −0.302 | 0.763 | ||
| Yes | 80 | 0.82±0.41 | ||
| No | 39 | 0.85±0.50 | ||
| Alcohol | −1.085 | 0.280 | ||
| Yes | 74 | 0.79±0.38 | ||
| No | 45 | 0.88±0.52 | ||
| Tumor Location | F=0.608a | 0.546 | ||
| Upper | 14 | 0.82±0.45 | ||
| Middle | 69 | 0.86±0.48 | ||
| Lower | 36 | 0.76±0.34 | ||
| Tumor Grade | F=1.645a | 0.198 | ||
| Well | 23 | 0.73±0.31 | ||
| Moderately | 64 | 0.81±0.39 | ||
| Poorly | 32 | 0.94±0.58 | ||
| T status | F=0.054a | 0.054 | ||
| T1 | 8 | 1.13±0.32 | ||
| T2 | 20 | 0.64±0.46 | ||
| T3 | 62 | 0.83±0.37 | ||
| T4 | 29 | 0.87±0.53 | ||
| N status | F=1.995a | 0.119 | ||
| N0 | 54 | 0.76±0.44 | ||
| N1 | 42 | 0.88±0.38 | ||
| N2 | 13 | 0.75±0.44 | ||
| N3 | 10 | 1.08±0.56 | ||
| TNM | F=1.312a | 0.273 | ||
| I | 6 | 0.90±0.39 | ||
| II | 47 | 0.75±0.38 | ||
| III | 66 | 0.88±0.48 | ||
a, one-way analysis of variance (ANOVA) test was utilized. GEO, Gene Expression Omnibus; SD, standard deviation; t, Student’s t-test; ESCC, esophageal squamous cell carcinoma.
Collection of differentially expressed genes
The mRNA-seq data for patients with ESCC were downloaded from TCGA. Patients with ESCC were ranked according to the expression level of miR-30b-5p from low to high, defining the first third as the low-expression group and the last third as the high-expression group. The R package “limma” was used for the correlation analysis.
Gene Ontology (GO), Kyoto Encyclopedia of Genes and Genomes (KEGG), and protein interaction analyses
A GO analysis was performed using the Database for Annotation, Visualization and Integrated Discovery (DAVID) (http://David.abcc.ncifcrf.gov/). For the pathway analysis, KEGG (http://www.genome.ad.jp/KEGG) was used to determine the regulatory relationships among downregulated genes. GO and KEGG enrichment was determined based on P values and a corresponding false discovery rate (FDR). The Search Tool for the Retrieval of Interacting Genes (STRING) was applied to analyze the interaction network of targets of miR-30b-5p. Hub genes were obtained using Cytoscape (degree >20).
Prediction of miR-30b-5p target genes
STAR BASE 3.0 (http://www.lncrnablog.com/starbase-v2-0-for-decoding-rna-interaction-networks/), which contains seven miRNA-target prediction algorithms (PITA, RNA22, miRmap, microT, miRanda, PicTar, and TargetScan) was used to identify possible miR-30b-5p target genes. Only the target genes conforming to the following screening conditions (algorithms Number ≥3, clipExpNum ≥2, and pancancerNum ≥6) were included in further analyses.
Screening of key target genes
For the purpose of acquiring more specific target genes, the intersection of hub genes and predicted miR-30b-5p target genes was obtained. The overlapping genes were used to further screen key target genes by analyzing their expression in ESCC and normal tissues and their correlations with miR-30b-5p.
Cell culture and transfection
Eca109 cells were cultured in Dulbecco’s modified Eagle’s medium (Wisent Inc., Quebec, Canada) supplemented with 10% fetal bovine serum (Wisent Inc.) in a humidified 5% CO2 atmosphere at 37 °C. The miR-30b-5p expression vector (pGCMV-GFP-miRNA-miR-30b-5p) and negative control (NC) (pGCMV-GFP-miRNA-ShNC) were purchased from GenePharma (Shanghai, China) and transfected at a final concentration of 10 µM with Lipofectamine 2000 (Invitrogen) according to the manufacturer’s instructions. After 6 h, the cells were moved to normal medium and cultured for an additional 24 h.
Transwell migration and invasion assays
After 48 h of transfection, cells were starved for 24 h in serum-free RPMI-1640 medium. Adjusting log-phase cells to 1–1.5 million cells/mL, 0.2-mL cell suspensions were added to 24-well Transwell chambers. The lower chamber was filled with 0.5 mL of RPMI-1640 medium containing fetal bovine serum (FBS; Gibco, Gaithersburg, MD, USA). For the invasion experiment, the upper chamber with an 8-µm pore size was coated with Matrigel according to the manufacturer’s instructions.
After a 24-h incubation, cells were fixed with paraformaldehyde and stained with 0.1% crystal violet. Cotton swabs were used to remove the cells on the upper surface of the membrane. Finally, the cells were counted under a microscope (×200), and five randomly selected fields were used to calculate average values.
RNA extraction and real-time polymerase chain reaction (RT-PCR)
RNA was extracted from tissues using TRIzol Reagent (Invitrogen). The TaqMan microRNA Reverse Transcription Kit (Applied Biosystems of Thermo Fisher Scientific, Foster City, CA, USA) was used to synthesize cDNA. The expression level of miR-30b-5p was determined using a Hairpin-itTM microRNA and U6 snRNA Normalization RT-PCR Quantitation Kit (GenePharma) and the 7300 Real-Time PCR apparatus (ABI). Relative miRNA expression levels were calculated using the 2−ΔΔCt method and normalized to U6 snRNA levels.
Western blot analysis
Proteins were extracted from harvested Eca109 cells by RIPA containing 1% PMSF at 4°C for 30 min after the transfection of miR-30b-5p for 48 h. Lysates were then centrifuged for 30 min at 12,000 ×g and 4 °C. Total proteins were denatured with SDS loading buffer, separated by SDS-PAGE, transferred to a PVDF membrane. The membranes were incubated with primary antibodies overnight at 4 °C, washed with TBST buffer, and incubated with a secondary antibody for 1 h. Proteins were then exposed to ECL using the ImageQuant LAS 500. The following primary antibodies were used: anti-GAPDH (arigo Biolaboratories, Huissen, The Netherlands), anti-Integrin alpha 5, anti-PDGFR beta (Abcam, Cambridge, UK), anti-Phospho-PI3 Kinase, anti-Phospho-Akt, anti-PI3 Kinase, anti-Akt (Cell Signaling Technology, USA). As a secondary antibody goat anti-rabbit HRP-conjugated IgG was obtained from arigo Biolaboratories.
Statistical analysis
Continuous variables are described by means ± SD and categorical variables are described by frequencies. Paired t-tests were used to compare the expression level of miR-30b-5p between ESCC and matched normal esophageal tissues. For comparisons among multiple groups, one-way analysis of variance (ANOVA) was used. Pearson correlation tests were used to evaluate correlations between variables. The relationship between miR-30b-5p level and survival rates was determined by the Kaplan-Meier survival approach along with Gehan Breslow Wilcoxon test. For the hospital data, the median value was taken as the optimal cut-off value, and for the GEO data, the best cut-off value was determined by the X-Tile software. The FDR approach was used to correct for multiple testing correction. All data analyses were performed using SPSS 20.0 and GraphPad Prism 6.0. A value of P<0.05 was considered statistically significant.
Results
miR-30b-5p expression was down-regulated in ESCC tissues
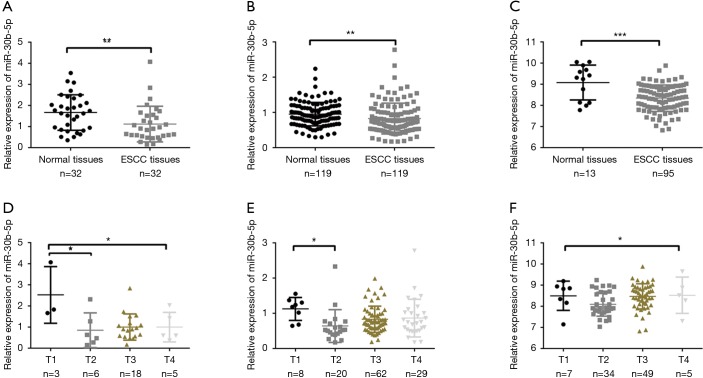
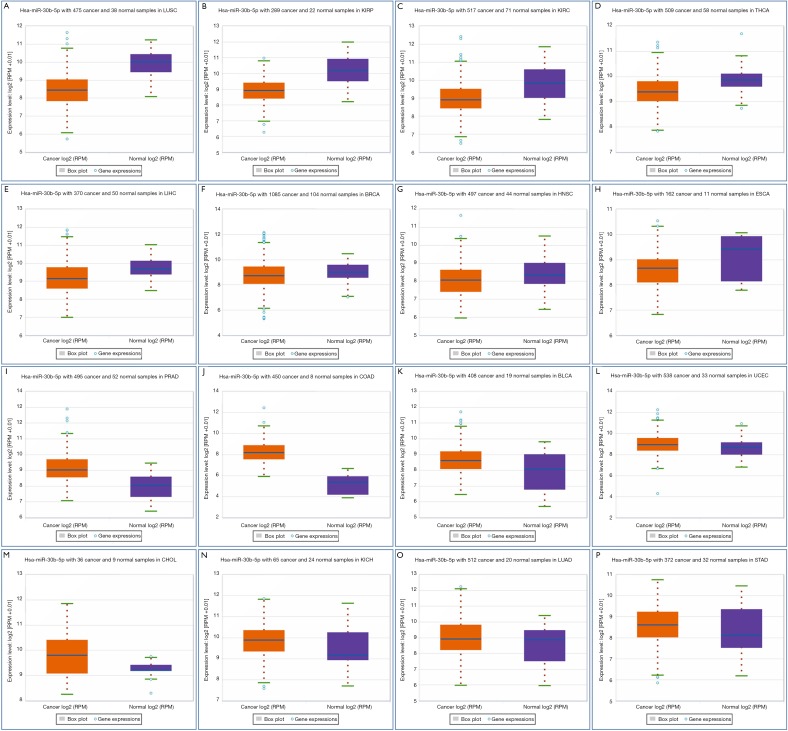
We performed RT-PCR to explore the expression levels of miR-30b-5p in samples from 32 patients with ESCC. The results showed that miR-30b-5p expression was significantly lower (Paired t-tests, P<0.01) in ESCC tissues than in paired adjacent normal tissues (Figure 1A). In addition, we investigated miR-30b-5p expression in 119 patients with ESCC from the GEO database (GSE43732) and 95 patients with ESCC from TCGA; the results of GEO and TCGA analyses were consistent with our RT-PCR results (Figure 1B,C). Further, using the downloaded TCGA data in starbase 3.0, a boxplot of the expression profiles of miR-30b-5p in several tumors was generated and shown in Figure S1. The miR-30b-5p expression level varied from tumor to tumor (Table S1).
Figure 1.
Relative expression of miR-30b-5p in ESCC tissues and clinical T stages. (A) RT-PCR analysis of relative miR-30b-5p expression in 32 ESCC tissues and adjacent normal tissues; (B) relative expression of miR-30b-5p based on GEO data; (C) relative expression of miR-30b-5p based on TCGA data; (D) miR-30b-5p expression in T stages in 32 ESCC tissues; (E) miR-30b-5p expression in T stages based on GEO data; (F) miR-30b-5p expression in T stages based on TCGA data. *P<0.05, **P<0.01, ***P<0.001. ESCC, esophageal squamous cell carcinoma; RT-PCR, real-time polymerase chain reaction.
Figure S1.
A boxplot of the expression profiles in other cancer types using TCGA data. TCGA, The Cancer Genome Atlas.
Table S1. Differential expression table of pan-cancer analysis for miR-30b-5p.
| Cancer full name | Cancer number | Normal number | Fold change | P |
|---|---|---|---|---|
| Lung squamous cell carcinoma | 475 | 38 | 0.4 | 1.3e-21 |
| Kidney renal papillary cell carcinoma | 289 | 32 | 0.37 | 1.0e-18 |
| Kidney renal clear cell carcinoma | 517 | 71 | 0.54 | 9.7e-16 |
| Thyroid carcinoma | 509 | 58 | 0.75 | 5.0e-8 |
| Liver hepatocellular carcinoma | 370 | 50 | 0.79 | 3.1e-5 |
| Breast invasive carcinoma | 1085 | 104 | 0.95 | 0.0028 |
| Head and neck squamous cell carcinoma | 497 | 44 | 0.77 | 0.0045 |
| Esophageal carcinoma | 162 | 11 | 0.67 | 0.013 |
| Prostate adenocarcinoma | 495 | 52 | 2.30 | 3.8e-20 |
| Colon adenocarcinoma | 450 | 8 | 8.30 | 5.6e-19 |
| Bladder urothelial carcinoma | 408 | 19 | 1.44 | 0.00025 |
| Uterine corpus endometrial carcinoma | 538 | 33 | 1.38 | 0.0032 |
| Cholangiocarcinoma | 36 | 9 | 1.86 | 0.059 |
| Kidney chromophobe | 65 | 24 | 1.14 | 0.067 |
| Lung adenocarcinoma | 512 | 20 | 1.34 | 0.083 |
| Stomach adenocarcinoma | 372 | 32 | 1.04 | 0.14 |
The clinical data of the 32 ESCC tissue samples collected from the Human Tissue Bank of the Zheijang Taizhou Hospital are shown in Table 1. In patients with ESCC, no relationships were discovered between miR-30b-5p expression levels and clinical factors, except for T stage. The expression level of miR-30b-5p was significantly disparate in different T stages; in particular, miR-30b-5p expression level was higher in T1 than in T2 (Figure 1D). Similar results were obtained using GEO data (Figure 1E, Table 2). However, using TCGA data, the difference in miR-30b-5p expression between the T1 and T2 stages was not significant (Figure 1F).
In a specific patient population, patients with high miR-30b-5p level have a better prognosis
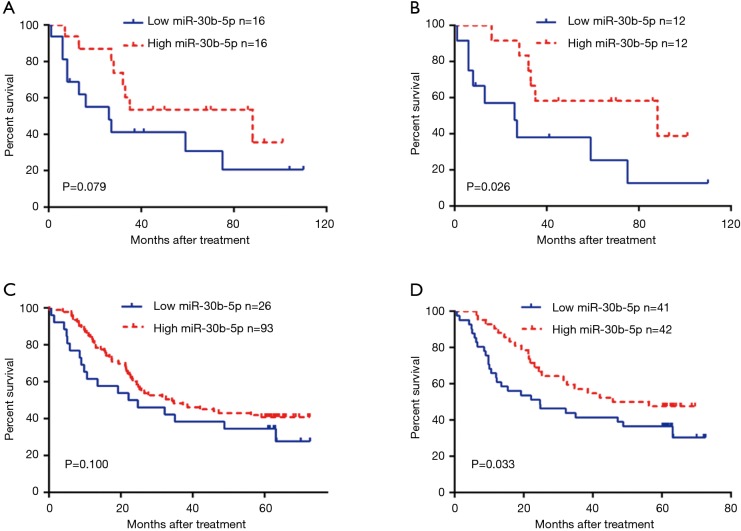
We divided the 32 patients with ESCC into two groups, a low-expression group (n=16) and a high-expression group (n=16), according to the median miR-30b-5p expression level. A Kaplan-Meier survival analysis showed that the prognosis was not significantly different between patients with high miR-30b-5p expression and those with low miR-30b-5p expression (Gehan Breslow Wilcoxon test, P=0.079) (Figure 2A). Furthermore, we selected 24 ESCC patients whose miR-30b-5p expression levels were lower in cancer tissues than in adjacent normal tissues for a survival analysis. Patients with high miR-30b-5p expression had a better prognosis than those with low miR-30b-5p expression (Gehan Breslow Wilcoxon test, P=0.026) (Figure 2B). When patients were divided into high expression group and low expression group according to the best cut-off value by the X-tile software, similar results were observed using GEO data (Figure 2C,D). Moreover, multivariate analyses showed that miR-30b-5p and N status are independent prognostic factors in the GEO data (Table 3). Therefore, miR-30b-5p probably plays a suppressive role in ESCC development.
Figure 2.
Kaplan-Meier survival analysis. Comparison of prognosis between ESCC patients with high and low expression levels of miR-30b-5p. (A) Hospital data; (C) GEO data. ESCC patients whose miR-30b-5p expression level in cancerous tissues was lower than that in adjacent normal tissues were chosen for the survival analysis. (B) Hospital data; (D) GEO data. ESCC, esophageal squamous cell carcinoma; GEO, Gene Expression Omnibus.
Table 3. Multivariate analyses for overall survival in ESCC patients.
| Variable | HR | 95% CI | P |
|---|---|---|---|
| Gender (male vs. female) | 0.619 | 0.197–1.939 | 0.410 |
| Age (≥60 vs. <60 years) | 0.663 | 0.355–1.237 | 0.197 |
| Family history (positive vs. negative) | 0.489 | 0.202–1.181 | 0.112 |
| Tobacco (yes vs. no) | 1.166 | 0.536–2.534 | 0.699 |
| Alcohol (yes vs. no) | 1.086 | 0.463–2.549 | 0.849 |
| Tumor location (upper vs. middle vs. lower) | 0.753 | 0.454–1.249 | 0.272 |
| Tumor grade (well vs. moderately vs. poorly) | 0.962 | 0.585–1.583 | 0.880 |
| T status (T1 vs. T2 vs. T3 vs. T4) | 1.282 | 0.815–2.015 | 0.282 |
| N status (N0 vs. N1 vs. N2 vs. N3) | 1.690 | 1.100–2.597 | 0.017* |
| TNM (I vs. II vs. III) | 1.760 | 0.696–4.452 | 0.233 |
| miR-30b-5p expression status (low vs. high) | 0.524 | 0.278–0.988 | 0.046* |
ESCC, esophageal squamous cell carcinoma.
Differential expression analysis
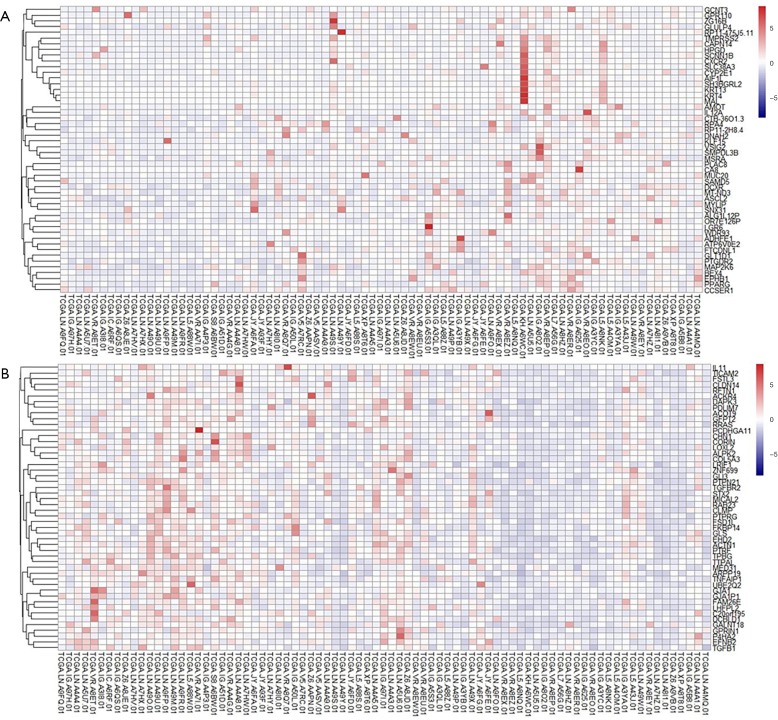
To explore the mechanisms underlying the suppressive effects of miR-30b-5p on tumor development in ESCC, we obtained miRNASeq and clinical data for 95 patients with ESCC from TCGA. We ranked 81 patients with ESCC according to the expression level of miR-30b-5p from low to high, defining the first 27 patients as the low-expression group and the last 27 patients as the high-expression group. Two groups of patients were screened for differential expression genes. A total of 17,429 RNA genes were included, of which 614 genes exhibited significantly decreased levels and 50 genes exhibited significantly increased levels in the high-expression group compared with those in the low-expression group after FDR correction (Table S2). The expression profiles of these two sets (top 50 genes) are shown as a heatmap using R package “heatmap” (Figure S2).
Table S2. Up/down regulated genes of miR-30b-5p.
| Up/down regulated genes | Genes |
|---|---|
| Up regulated genes | CYP2E1, CXCR2, PPARG, BEX4, SAMD5, ALG1L12P, MYLIP, KLF15, KRT13, HPGD, IL12A, CA8, RP11-475J5.11, CAPN14, GLT1D1, MUC20, AMOT, VSIG2, KRT4, EPHB1, SCNN1B, AIF1L, ADHFE1, LGR6, SLC38A3, MAL, GCNT3, DCXR, GLULP4, MSRA, SNX31, GPR110, ZG16B, RPA4, ASCL2, CTB-36O1.3, MT-ND3, CCSER1, DNAH2, SH3BGRL2, ATP6V0E2, TMPRSS2, PLAC8, SMPDL3B, OR7E126P, PTGDR2, RP11-2H8.4, FTCDNL1, MAP2K6, WDR93 |
| Down regulated genes | PTRF, TPBG, MICAL2, TTPAL, GFPT2, TNFAIP1, DAPK3, DCBLD1, TICAM2, FSTL3, C20orf195, FSD1L, GJA1, EHD2, COL5A3, GPRIN1, EFNB2, FAM26E, LHFPL2, ACKR4, UBE2Q2, LOXL2, TGFB1, GALNT18, RRAS, ARPP19, GLS, CHN1, CLMP, FKBP14, PDLIM7, TGFBR2, STX2, ZNF699, GJA1P1, P4HA2, LRIF1, MED31, CLDN14, PTPRG, RAB23, ALPK2, GLI3, ACOT9, ACTN1, RFTN1, CORIN, PCDHGA11, IL11, PTPN21, TBC1D2B, RNF216, OSBPL5, REEP3, TGFBR1, HOMER1, COL5A2, CD248, DLGAP4, TAF13, LRRC16A, MYO5A, SLC25A24, VASP, PODNL1, VDR, LATS2, SPON2, AFAP1L2, SH3PXD2B, STK17A, GNA12, HRH1, MAP4, COL6A1, KLF13, NXN, FBLIM1, SPHK1, PCDHGA12, CCM2, MB21D2, CTC-281F24.3, DPH3, ADAMTS6, C19orf71, MMP19, SERPINE1, ATP10D, MTMR6, LGALS1, FAM101B, CEACAM19, UBR1, OLFML2B, CYTH3, DPP9, CEP164, CERCAM, RAB31, ITGA5, MYH9, PDGFRB, PIP5K1C, FUT11, MYO1C, PRKCDBP, PAFAH1B1, PBX3, FZR1, COL6A2, YWHAH, SFXN3, MEIS3, SMTN, HEXB, DNAJC1, EHD4, RAB22A, SPARC, ITGA3, TNFRSF12A, PANX1, SCG5, TRIM3, KLF7, CYP27C1, CDKN1A, TUBB3, MFSD12, CSMD2, VPS53, PPP1R18, ACVR1, SBNO2, C19orf12, NACC2, DUSP14, AK5, PPAPDC3, GALNT10, MRC2, MAP7D1, ZNF235, ALG2, OLFM2, COPZ2, GPR180, FILIP1L, AGPS, RSU1, C9orf40, LACTB, HERC4, ZHX3, MKL1, PCBP4, COL12A1, PVR, HTRA1, GNAI1, ILK, CHSY3, PAPLN, TES, ANGPT2, PLAUR, ABHD15, KIAA1644, SRR, OPA3, PAM, THY1, SERINC3, KIFAP3, MYOM3, TRPV3, GLT8D2, CTSK, ADAMTS2, POSTN, PRRX1, PSORS1C1, DYNC1LI1, SELM, TMEM2, SLC35D1, FAM151B, ANO6, COL6A3, TNKS1BP1, NTM, INHBA, PHTF2, IGDCC4, NAB1, PPFIBP1, NEK7, RFK, SEC23A, MMP1, USP47, CHD1, CMTM6, BMP1, SGPP1, FMOD, LAMA4, LRRC59, PIEZO1, LUM, CD109, ENPEP, SYNC, PTPRN, PRR34, DNAJB5, ADAMTS12, GREM1, ARHGAP1, SPAG9, VGLL3, C9orf117, SMIM3, TENM3, IL1R1, TMEM104, FHL2, MYO19, VAV2, IKBIP, ZNF264, GLIS1, COL1A2, PMP22, ANKS1A, SGMS1, ABHD13, FIBCD1, MAFK, THAP1, GOLGA1, SPOCD1, SYDE1, LIMA1, STYX, MMP13, MRPL50, RUNX2, FAM69A, RTKN, KLF10, OSBPL3, COL1A1, CLIC4, CSGALNACT2, THBS2, AGPAT4, PLCD3, ZBTB47, PGM3, FNTAL1, FEZ1, PPP1R9B, COL5A1, OSTM1, ITGB1, SPTBN5, HAUS2, CDC27, PNMA1, SULF2, SEPT7, HAS2, TMEM26, BBS4, NAV3, ZNF805, SNX13, GRIN2D, NDEL1, WDR44, AP4E1, TLE1, TMCC1, GGT5, OLFML1, FLNB, TOR1B, WDR47, CRAT, BICD2, PTPN12, THBS1, CTGF, RP11-235E17.5, ARPIN, NELL2, SOCS4, VCL, ISLR, COL3A1, FHOD3, SBDS, CASC10, MICALCL, MAP3K7CL, PRSS23, PCDHGA4, C9orf64, FBXL19-AS1, FURIN, ZNF283, FAM198B, CDHR2, ATP8B3, KCTD11, HSPA8, C12orf5, WISP1, KDELC1, TGFB3, MOB3A, HELZ2, GPR97, ZNF469, KIAA0391, ISM1, PLS3, TMED7-TICAM2, CSPG4, CALD1, NEDD4, ARHGAP22, FAM63B, PMEPA1, LAMA3, ABL1, TBXA2R, DCUN1D4, SNAI2, PCDHGB1, ARHGAP21, CCRN4L, SPRED3, KLHL28, ZNF146, ZNF609, CDR2L, KDELR3, UEVLD, TAOK1, GAS2L1, STAM, GMFB, P4HA3, POLK, RDX, MMP3, ZNF749, DCN, EML5, PIGW, ITGA11, CD151, HEPH, ATP11A, UBASH3B, CREB3L1, CALU, FN1, TANC2, RCN3, MFGE8, GUCY1A2, ELK3, HOOK3, AAED1, BCL9L, SLC30A4, RAB8B, ZNF474, MXRA8, FNIP2, PDLIM4, KIAA0930, ANTXR2, NOD1, HIVEP2, PCDHGC5, CDK6, FAM126A, ITGB1P1, PEAK1, CLN5, PLBD2, ANXA8L1, AC098614.2, GPR153, EDA2R, ETHE1, NRBF2, NFE2L1, GNPNAT1, NAGS, EGFL6, MSANTD3, BAZ1A, FBXL2, RASGRF2, SSC5D, MAP4K4, PLEKHO2, PTGIR, TTYH3, STON2, ANXA5, BNC1, WNT2, CYR61, FAM177A1, GALNT15, PQLC3, MYO1D, KHSRPP1, SNX10, FUT4, TIMP2, NDE1, AC069282.6, SGIP1, SLC9A1, DSE, CNRIP1, PLEC, BMP2K, C11orf91, ANGPTL2, TTLL13P, NNMT, ZMIZ1, MCTP1, TRIO, SLC31A2, DOCK5, PLXDC1, MTSS1, HERC3, ZNF267, SCARF2, IFITM2, BIRC2, KIAA1024, RCAN1, IL7R, HGSNAT, MAGEL2, AHNAK2, FAM83B, LTBP1, RANBP6, COL10A1, REP15, KCNIP3, FKBP9, ZNF222, FBN1, PPP1R13L, VIM, S1PR2, RIC1, CAMK2A, ZNF227, C1orf216, MFAP5, SKIL, AEBP1, CDK14, PPARD, NOX4, EPAS1, TSPAN4, ZNF155, MAMLD1, STRA6, NEXN-AS1, KIAA0895, KRT9, GPR124, TMEM209, NID2, ADCY7, EXOC5, PAPPA, UNGP3, NUMBL, GRK4, SNX29, IGFBP7, RBP1, LAMC2, PCOLCE, HOMER3, LRRC8C, ABL2, APC2, MAPK6, JRKL, RABEP1, BBS12, ELMSAN1, STRN3, LRRFIP1, VAT1L, TBX18, DOCK11, IL13RA1, TIMP3, COL27A1, FSTL1, COL4A1, INF2, LPPR4, KIF5B, MDFI, ECM2, MCAM, CNTNAP1, GLIPR1, ZNF45, MYO1E, FAP, AK1, OPTN, NMNAT2, HES2, AJUBA, LIG4, ZNFX1, XIAP, MISP, CDHR4, LIMK1, ITGAV, DAB2, MMD, ITGA1, NCS1, BIN1, PCDHGA3, CNTF, HLX, CD59, SYT7, MAF, TMEM204, KIFC3, SLC16A3, NBL1, TMEM45A, PTPRE, TMEM256-PLSCR3, ADAMTS14, HES4, MSRB3, CDC37L1, TRPM4, SYNJ1, TGFBI, EGFLAM, RRAS2, PDPN, ZNF226, RALGAPA1P, PHLDA2, RNF152, ANKRD9, SLC39A6, ANXA2, HOXB5, P3H2, GRAMD4, OPN1SW, IGFL2, ARNTL2, LRCH1, PRR16, TLR6, CELSR2, C9orf3, BICC1, PDGFC, MICAL3, ANTXR1, ELOVL5, GPR68, ZNF587, ADAMTS7, EIF5A2, LTBP2, FGF1, UGGT2, CELSR3, FSCN1, ARPC1B, COX6B2, CAV1, PHLDB2, TPM1, PSMD5, HIPK3, CASC5, ATL3, LRRC8A |
The above genes remain significant after FDR test is applied. FDR, false discovery rate.
Figure S2.
The expression profiles of down/up-regulated genes (top 50 genes) are showed by heatmap using R package “pheatmap”. (A) Down-regulated genes; (B) up-regulated genes.
GO, KEGG enrichment, and protein interaction analyses
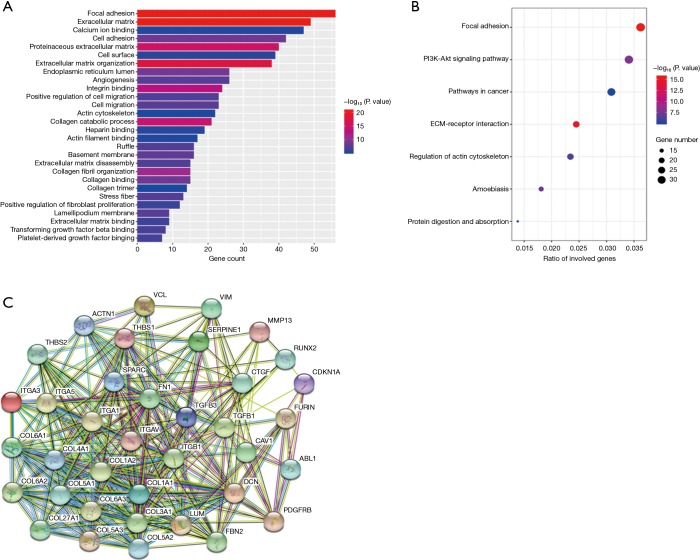
GO and KEGG analyses of the 614 downregulated genes were performed using DAVID. In the GO analysis, a total of 328 terms were obtained, of which 28 terms were significantly enriched (Figure 3A, FDR <0.01). In the KEGG analysis, seven pathways were statistically significant (Figure 3B, FDR <0.01). The three most significant GO terms were extracellular matrix, focal adhesion, and extracellular matrix organization. Similarly, the top three significant pathways in the KEGG analysis were focal adhesion, ECM-receptor interaction, and PI3K/Akt signaling pathway. Among these terms, miR-30b-5p is well known in “cell migration” and “proliferation” in multiple cancer types. Moreover, we obtained 37 hub genes by a Cytoscape protein interaction analysis with degree >20 (Figure 3C). Based on previous literatures, we found that these genes play a crucial role in cell processes and that many of them are involved in the carcinogenesis of numerous tumors, including ESCC (Table S3).
Figure 3.
Overview of significantly enriched GO and KEGG terms. The x-axis indicates the counts or ratio of involved genes and the y-axis represents the GO and KEGG terms. (A) Enriched GO terms. The length of the horizontal column represents the number of genes and their color indicates the P value. (B) Enriched KEGG terms. Each bubble represents a term. The size of the bubble indicates the number of involved genes. Lighter colors indicate smaller P values. (C) Network analysis of the prospective target genes of miR-30b-5p. Network nodes represent proteins. Colored nodes, query proteins, and first shell of interactors; white nodes, second shell of interactors. Small nodes, protein of unknown 3D structure; large nodes, some 3D structure is known or predicted. ESCC, esophageal squamous cell carcinoma; RT-PCR, real-time polymerase chain reaction; GO, Gene Ontology; KEGG, Kyoto Encyclopedia of Genes and Genomes.
Table S3. Description of Hub genes based on literatures.
| The role of genes in cancer | Gene name |
|---|---|
| Oncogene in ESCC | ITGA5 (21), PDGFRB (29), FN1 (29), VIM (30), CTGF (30), TGFB1 (36), CAV1 (37), MMP13 (38), SPARC (39), THBS1 (40), ITGB1 (41), ITGAV (42), LUM (43) |
| Tumor suppressor gene in ESCC | None |
| Oncogene in other cancer types | ABL1 (44), ACTN1 (45), COL1A1 (46), COL1A2 (47), COL3A1 (48,49), COL4A1 (50), COL5A1 (51), COL5A2 (52), COL6A1 (53), COL6A3 (35), FBN1 (54), FURIN (55), ITGA1 (56), ITGA3 (57), RUNX2 (58), TGFB3 (59), SERPINE1 (60) |
| Tumor suppressor gene in other cancer types | CDKN1A (61,62,63), DCN (64), THBS2 (34,65), VCL (66) |
| Other | COL27A1, COL5A3, COL6A2 |
Key target genes of miR-30b-5p
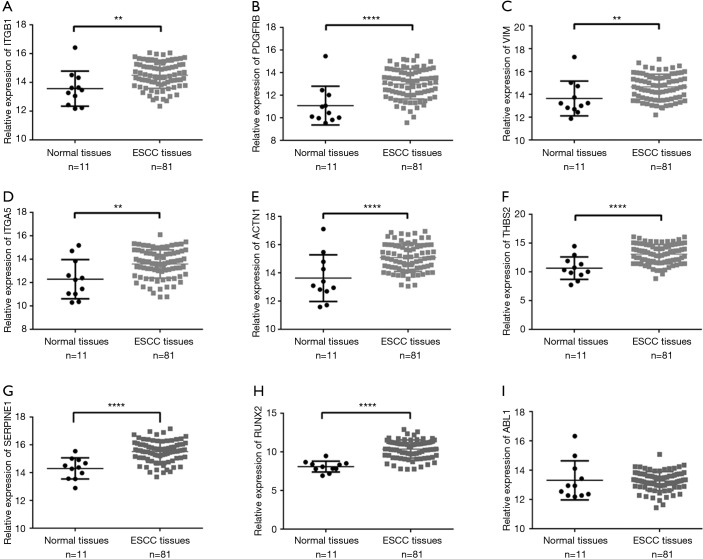
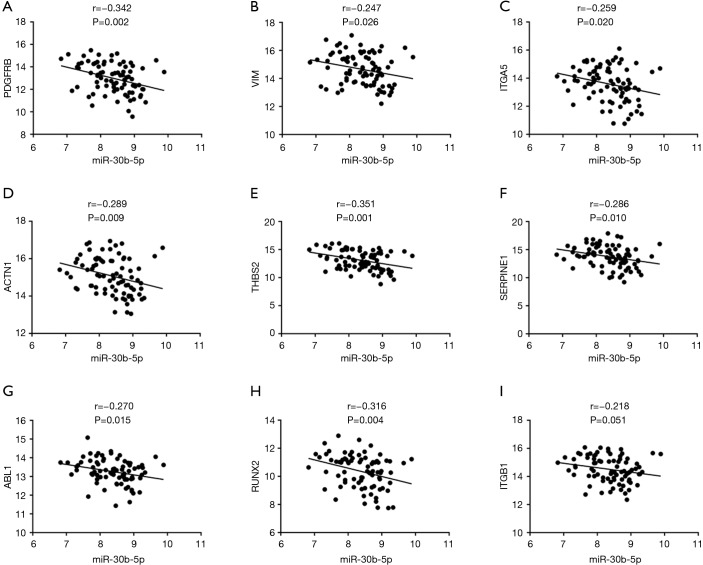
We used seven algorithms through the STAR BASE 3.0 website to identify 871 potential target genes. Based on the intersection of 37 hub genes and 871 potential target genes, nine genes (ITGB1, PDGFRB, VIM, ITGA5, ACTN1, THBS2, SERPINE1, ABL1 and RUNX2) were obtained for further analyses. We found eight genes (ITGB1, PDGFRB, VIM, ITGA5, ACTN1, THBS2, SERPINE1, and RUNX2) that were significantly increased in ESCC tissues (Figure 4A,B,C,D,E,F,G,H), and there was no significant difference in ABL1 gene expression (Figure 4I). A Pearson’s correlation analysis indicated that the levels of eight genes were significantly inversely correlated with miR-30b-5p, i.e., PDGFRB (r=−0.342, P=0.002), VIM (r=−0.247, P=0.026), ITGA5 (r=−0.259, P=0.020), ACTN1 (r=−0.289, P=0.009), THBS2 (r=−0.351, P=0.001), SERPINE1 (r=−0.286, P=0.010), ABL1 (r=−0.270, P=0.015), and RUNX2 (r=−0.316, P=0.004) (Figure 5A,B,C,D,E,F,G,H). However, there was no remarkable negative correlation between ITGB1 and miR-30b-5p (Figure 5I). When miR-30b-5p is decreased in ESCC, upregulated genes may play vital roles as key targets of miR-30b-5p. Ultimately, seven genes (PDGFRB, VIM, ITGA5, ACTN1, THBS2, SERPINE1, and RUNX2) were identified as key target genes of miR-30b-5p. Among them, PDGFRB, RUNX2, and SERPINE1 were confirmed using miRTarBase (Table 4).
Figure 4.
Relative expression of key target genes in ESCC tissues compared with that in normal tissues. (A) ITGB1; (B) PDGFRB; (C) VIM; (D) ITGA5; (E) ACTN1; (F) THBS2; (G) SERPINE1; (H) RUNX2; (I) ABL1. *P<0.05, **P<0.01, ***P<0.001, ****P<0.0001.
Figure 5.
Correlation between miR-30b-5p and key target genes. (A) PDGFRB (r=−0.342, P=0.002); (B) VIM (r=−0.247, P=0.026); (C) ITGA5 (r=−0.259, P=0.020); (D) ACTN1 (r=−0.289, P=0.009); (E) THBS2 (r=−0.351, P=0.001); (F) SERPINE1 (r=−0.286, P=0.010), (G) ABL1 (r=−0.270, P=0.015), (H) RUNX2 (r=−0.316, P=0.004); (I) ITGB1 (r=−0.218, P=0.051).
Table 4. miR-30b-5p target genes in miRTarBase.
| Target | Description | Strong evidence | Less strong evidence | |||||||
|---|---|---|---|---|---|---|---|---|---|---|
| Reporter assay | Western bolt | qPCR | Microarray | NGS | pSILAC | Sum | # of papers | |||
| RUNX2 | Runt related transcription factor 2 | √ | – | √ | √ | √ | – | 4 | 2 | |
| PDGFRB | Platelet derived growth factor receptor beta | √ | √ | √ | – | – | – | 3 | 1 | |
| SERPINE1 | Serpin family E member 1 | √ | √ | √ | – | √ | – | 4 | 2 | |
qPCR, reverse transcriptase-PCR; NGS, next-generation sequencing; pSILAC, stable-isotope labeling by amino acids in cultured cells.
The expression levels of key target genes in clinical T stages
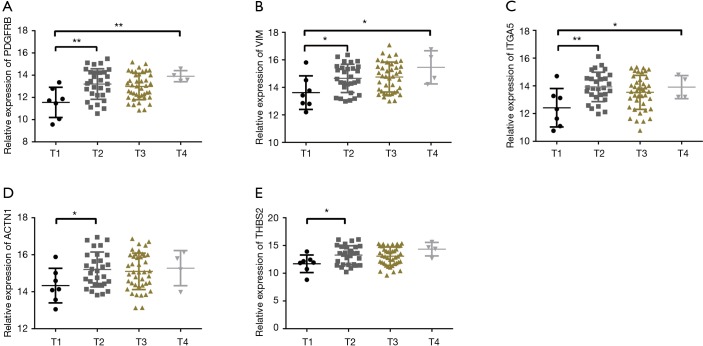
The seven key target gene mRNA levels in clinical T stages were studied. One-way ANOVA showed that the expression of the target genes PDGFRB, VIM, and ITGA5 differed significantly among T stages (Figure 6A,B,C). Further t-tests revealed higher expression levels of five key target genes (PDGFRB, VIM, ITGA5, ACTN1, and THBS2) in T2 than in T1 (Figure 6).
Figure 6.
Expression levels of key target genes in clinical T stages. (A) PDGFRB; (B) VIM; (C) ITGA5; (D) ACTN1; (E) THBS2. *P<0.05, **P<0.01.
Upregulated expression of miR-30b-5p inhibited the migration and invasion of Eca109 cells
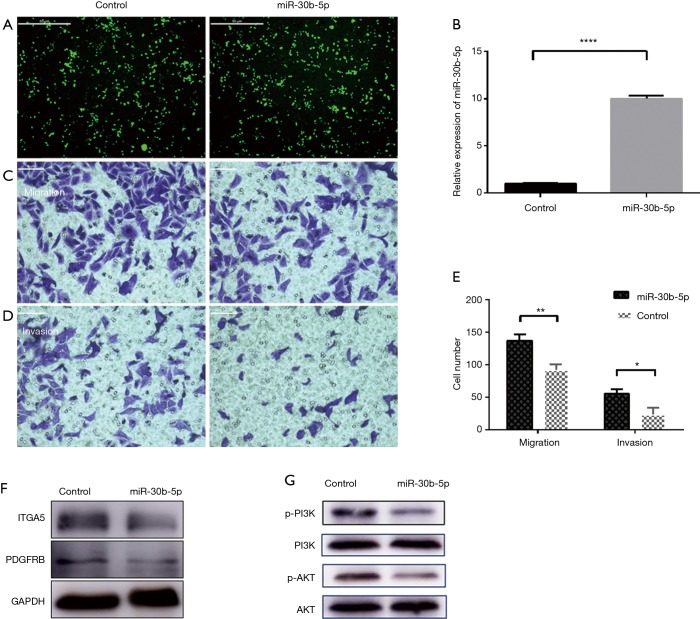
Downregulated miR-30b-5p levels in ESCC provide a basis for determining whether this miRNA functions as a tumor inhibitor in ESCC. We transfected Eca109 cells with an exogenous miR-30b-5p plasmid and assessed the influence on cell biological functions in vitro. After 24 h of transfection, Eca109 cells were observed by fluorescence microscopy (Figure 7A). TaqMan RT-PCR showed that expression of miR-30b-5p was upregulated by 8.5–10.5-fold in Eca109 cells (Figure 7B).
Figure 7.
miR-30b-5p regulates migration and invasion through the PI3K/AKT pathway in Eca109 cells. (A) Eca109 cells were treated with an miR-30b-5p overexpression vector or negative control (control). (B) The expression level was detected by qRT-PCR. Data are expressed as fold changes (means ± SE). ****P<0.0001, control compared with miR-30b-5p. (C,D) Representative images of migration and invasion chambers. (E) Average counts of migrated and invasive cells from five random microscopic fields (mean ± SE). *P<0.05, **P<0.01, control compared with miR-30b-5p. (F) The protein expression of key targets PDGFRB and ITGA5. (G) Protein expression of p-PI3K, PI3K, p-AKT, and AKT.
To identify whether miR-30b-5p has an impact on the progression of ESCC, we performed transwell experiments. The upregulation of miR-30b-5p attenuated migration and invasion in Eca109 cells (Figure 7C,D,E). These results suggest that miR-30b-5p acts as a suppressive factor in ESCC.
miR-30b-5p in ESCC is related to the PI3K/Akt signaling pathway
A western blotting analysis revealed that the protein levels of PDGFRB, ITGA5, p-AKT, and p-PI3K, which are involved in the PI3K/Akt signaling pathway, were lower in the miR-30b-5p overexpression Eca109 cells than in the untransfected Eca109 cells. However, the expression level of AKT and PI3K showed almost no difference (Figure 7F,G). These results confirmed that PDGFRB and ITGA5 are the key targets of miR-30b-5p, and they also suggest that miR-30b-5p is related to the PI3K/Akt signaling pathway.
Discussion
ESCC is a general type of esophageal cancer, and growing evidence suggests that miRNAs function as cancerogenic factors or tumor-inhibiting factors in ESCC (16). Identification of the signaling pathways and molecular mechanisms underlying ESCC can provide a basis for the development of novel strategies for diagnosis and for predicting prognosis.
In the present study, we investigated target gene networks and associations of miR-30b-5p levels with clinicopathological characteristics and prognosis in ESCC. We found that miR-30b-5p levels were significantly lower in ESCC tissues than in adjacent non-cancerous tissues. In addition, miR-30b-5p levels were significantly disparate in different T stages (i.e., they were significantly higher in T1 than in T2) but showed no remarkable difference among other clinical factors. These findings were supported by a statistical analysis of GEO data. However, we found no significant differences between the T1 and T2 stages in TCGA data. This may be explained by the differences in the sample sources and sample size.
Patients with high miR-30b-5p expression exhibited longer survival time, but this result was not significant. It has been proved that miR-30b-5p does not have an inhibitory effect on EC cells, except those with low expression of miR-30b-5p such as Eca109 and TE-1 (12); this prompted us to perform a survival analysis of patients with ESCC who had lower miR-30b-5p expression in cancer tissues than in normal tissues. Patients with high miR-30b-5p expression had a better prognosis based on GEO data. Furthermore, multivariate analyses showed that miR-30b-5p is an independent prognostic factor.
Studies have revealed that miR-30b-5p can regulate invasion and metastasis in cancers (14,17). Accordingly, we further investigated the relationship between miR-30b-5p and metastasis in ESCC. Our results showed that miR-30b-5p attenuated migration and invasion in the Eca109 cell line. Similarly, a previous study showed that overexpression of miR-30b-5p inhibits growth, migration, and invasion of Eca109 and TE-1 EC cells (12). Therefore, we speculated that miR-30b-5p may play a critical role in ESCC tumorigenesis and progression.
The PI3K/AKT pathway identified in the enrichment analysis is a major signaling cascade that is activated in a large variety of human cancers (18). It is involved in metastasis and apoptosis of ESCC cells, thus affecting proliferation and tumor growth (19). The present study showed that p-PI3K and p-Akt proteins were down-regulated in Eca109 cells when miR-30b-5p was overexpressed in Eca109. On the basis of these findings, we speculated that miR-30b-5p is likely involved in cell migration and the PI3K/AKT signaling pathway, which may affect cancer progression.
We further identified seven key target genes (PDGFRB, VIM, ITGA5, ACTN1, THBS2, SERPINE1, and RUNX2) based on the intersection between 37 hub genes and 871 predicted target genes. Some of these key target genes have been shown to play a role in EC in previous studies. As an integrin α subunit, ITGA5 is involved in invasiveness and tumorigenesis (20,21) and is one of the most abundant proteins in the extracellular matrix. Numerous studies have shown that ITGA5 could have a regulatory role in specific cancers by activating focal adhesion kinases to promote cell adhesion and migration (21-24). Regarding ESCC, a previous study showed that high expression of ITGA5 was significantly correlated with lymph node metastasis and tumor size and indicated a low survival rate (21). Platelet-derived growth factor receptor β (PDGFRB) is an important target for anti-tumor treatment (25,26). Studies have shown that PDGFRB is involved in numerous cellular processes, including angiogenesis, proliferation, and migration (27,28). A previous study showed that high expression of PDGFRB plays a tumorigenic role in EC and that the strong expression rate of PDGFRB is significantly higher in tumor tissues than in para-tumor and normal tissues (29). As a major component of the intermediate filament family of proteins, VIM is widely regarded as a marker of epithelial-mesenchymal transition (EMT). A previous study showed that overexpression of miR-145 and knockdown of CTGF inhibited the proliferation, migration, and invasion of ESCC cells through their influence on EMT (30). Another study showed a correlation between SERPINE1 and the prognosis of EC patients (31). However, prior to the present study, the association of the other three genes with EC had not been reported.
PDGFRB and ITGA5 are both involved in the PI3K/AKT signaling pathway and are positive regulators of cell migration. Therefore, we focused on these two proteins for further exploration. We provide the first evidence that the mRNA expression levels of ITGA5 and PDGFRB are negatively correlated with miR-30b-5p in ESCC. Further, their expression levels were remarkably disparate in different T stages. We also revealed that the protein levels of ITGA5 and PDGFRB were downregulated in the miR-30b-5p high-expression Eca109 group. These findings indicated that miR-30b-5p may inhibit Eca109 migration and invasion by suppressing ITGA5 and PDGFRB. The overexpression of ITGA5 and PDGFRB is a remarkable characteristic that may be a crucial event in ESCC tumorigenesis. However, the precise functions and downstream regulatory mechanisms remain to be explored.
We identified three additional key targets with known roles in other cancers or cancer-related pathways. Lower expression of ACTN1 is associated with better survival in pancreatic cancer (32). As a transcription factor, RUNX2 could facilitate HCC cell migration and invasion by a MMP9-mediated pathway (33). A previous study showed that high THBS2 expression is associated with better prognosis through inhibition of gastric cancer cell proliferation (34). However, another study showed that silencing of THBS2 inhibits gastric cancer cell proliferation, migration, and invasion (35). Our current research shows that these genes may also play a key role in the occurrence and development of EC, and may be regulated by miR-30b-5p. In general, the role of these genes in ESCC deserves further study.
Conclusions
miR-30b-5p plays an important role in the occurrence and progression of ESCC. On the basis of the results of the present study, PDGFRB and ITGA5 are potential therapeutic targets and prognostic predictors for ESCC and the PI3K/Akt signaling pathway is involved in the regulation of miR-30b-5p; however, further research is needed to confirm these roles.
Acknowledgments
Funding: This study was funded by the Zhejiang Provincial Department of Medical and Health Science and Technology (grant number 2015KYA239), Taizhou science and technology planning project (grant number 1802ky01).
Ethical Statement: The authors are accountable for all aspects of the work in ensuring that questions related to the accuracy or integrity of any part of the work are appropriately investigated and resolved. The study has been approved by the Ethics Committee of Taizhou Hospital (K20180402) and patients gave their informed consent before materials were obtained for use in the study.
Footnotes
Conflicts of Interest: The authors have no conflicts of interest to declare.
References
- 1.Arnold M, Soerjomataram I, Ferlay J, et al. Global incidence of oesophageal cancer by histological subtype in 2012. Gut 2015;64:381-7. 10.1136/gutjnl-2014-308124 [DOI] [PubMed] [Google Scholar]
- 2.Pennathur A, Gibson MK, Jobe BA, et al. Oesophageal carcinoma. Lancet 2013;381:400-12. 10.1016/S0140-6736(12)60643-6 [DOI] [PubMed] [Google Scholar]
- 3.Kim T, Grobmyer SR, Smith R, et al. Esophageal cancer—the five year survivors. J Surg Oncol 2011;103:179-83. 10.1002/jso.21784 [DOI] [PubMed] [Google Scholar]
- 4.Huang Y, Shen XJ, Zou Q, et al. Biological functions of microRNAs: a review. J Physiol Biochem 2011;67:129-39. 10.1007/s13105-010-0050-6 [DOI] [PubMed] [Google Scholar]
- 5.Hu X, Schwarz JK, Lewis JS, Jr, et al. A microRNA expression signature for cervical cancer prognosis. Cancer Res 2010;70:1441-8. 10.1158/0008-5472.CAN-09-3289 [DOI] [PMC free article] [PubMed] [Google Scholar]
- 6.Wu WK, Lee CW, Cho CH, et al. MicroRNA dysregulation in gastric cancer: a new player enters the game. Oncogene 2010;29:5761-71. 10.1038/onc.2010.352 [DOI] [PubMed] [Google Scholar]
- 7.Guz M, Rivero-Muller A, Okon E, et al. MicroRNAs-role in lung cancer. Dis Markers 2014;2014:218169. 10.1155/2014/218169 [DOI] [PMC free article] [PubMed] [Google Scholar]
- 8.Dluzen DF, Sun D, Salzberg AC, et al. Regulation of UDP-glucuronosyltransferase 1A1 expression and activity by microRNA 491-3p. J Pharmacol Exp Ther 2014;348:465-77. 10.1124/jpet.113.210658 [DOI] [PMC free article] [PubMed] [Google Scholar]
- 9.Dolly SO, Collins DC, Sundar R, et al. Advances in the Development of Molecularly Targeted Agents in Non-Small-Cell Lung Cancer. Drugs 2017;77:813-27. 10.1007/s40265-017-0732-2 [DOI] [PubMed] [Google Scholar]
- 10.Dweep H, Gretz N. miRWalk2.0: a comprehensive atlas of microRNA-target interactions. Nat Methods 2015;12:697. 10.1038/nmeth.3485 [DOI] [PubMed] [Google Scholar]
- 11.Zhang D, Liu Z, Zheng N, et al. MiR-30b-5p modulates glioma cell proliferation by direct targeting MTDH. Saudi J Biol Sci 2018;25:947-52. 10.1016/j.sjbs.2018.02.015 [DOI] [PMC free article] [PubMed] [Google Scholar]
- 12.Li Q, Zhang X, Li N, et al. miR-30b inhibits cancer cell growth, migration, and invasion by targeting homeobox A1 in esophageal cancer. Biochem Biophys Res Commun 2017;485:506-12. 10.1016/j.bbrc.2017.02.016 [DOI] [PubMed] [Google Scholar]
- 13.Chen S, Li P, Yang R, et al. microRNA-30b inhibits cell invasion and migration through targeting collagen triple helix repeat containing 1 in non-small cell lung cancer. Cancer Cell Int 2015;15:85. 10.1186/s12935-015-0236-7 [DOI] [PMC free article] [PubMed] [Google Scholar]
- 14.Liao WT, Ye YP, Zhang NJ, et al. MicroRNA-30b functions as a tumour suppressor in human colorectal cancer by targeting KRAS, PIK3CD and BCL2. J Pathol 2014;232:415-27. 10.1002/path.4309 [DOI] [PubMed] [Google Scholar]
- 15.Huang YH, Lin KH, Chen HC, et al. Identification of postoperative prognostic microRNA predictors in hepatocellular carcinoma. PLoS One 2012;7:e37188. 10.1371/journal.pone.0037188 [DOI] [PMC free article] [PubMed] [Google Scholar]
- 16.Harada K, Baba Y, Ishimoto T, et al. The role of microRNA in esophageal squamous cell carcinoma. J Gastroenterol 2016;51:520-30. 10.1007/s00535-016-1161-9 [DOI] [PubMed] [Google Scholar]
- 17.Gaziel-Sovran A, Segura MF, Di MR, et al. miR-30b/30d regulation of GalNAc transferases enhances invasion and immunosuppression during metastasis. Cancer Cell 2011;20:104-18. 10.1016/j.ccr.2011.05.027 [DOI] [PMC free article] [PubMed] [Google Scholar]
- 18.Fresno Vara JA, Casado E, De CJ, et al. PI3K/Akt signalling pathway and cancer. Cancer Treat Rev 2004;30:193-204. 10.1016/j.ctrv.2003.07.007 [DOI] [PubMed] [Google Scholar]
- 19.Guanen Q, Junjie S, Baolin W, et al. MiR-214 promotes cell meastasis and inhibites apoptosis of esophageal squamous cell carcinoma via PI3K/AKT/mTOR signaling pathway. Biomed Pharmacother 2018;105:350-61. 10.1016/j.biopha.2018.05.149 [DOI] [PubMed] [Google Scholar]
- 20.Lake J, Zaniolo K, Gingras MÈ, et al. Functional Impact of Collagens on the Activity Directed by the Promoter of the α5 Integrin Subunit Gene in Corneal Epithelial Cells. Invest Ophthalmol Vis Sci 2015;56:6217-32. 10.1167/iovs.15-16587 [DOI] [PubMed] [Google Scholar]
- 21.Xie JJ, Guo JC, Wu ZY, et al. Integrin α5 promotes tumor progression and is an independent unfavorable prognostic factor in esophageal squamous cell carcinoma. Hum Pathol 2016;48:69-75. 10.1016/j.humpath.2015.09.029 [DOI] [PubMed] [Google Scholar]
- 22.Dingemans AMC, Boogaart VVD, Vosse BA, et al. Integrin expression profiling identifies integrin alpha5 and beta1 as prognostic factors in early stage non-small cell lung cancer. Mol Cancer 2010;9:152. 10.1186/1476-4598-9-152 [DOI] [PMC free article] [PubMed] [Google Scholar]
- 23.Haenssen KK, Caldwell SA, Shahriari KS, et al. ErbB2 requires integrin alpha5 for anoikis resistance via Src regulation of receptor activity in human mammary epithelial cells. J Cell Sci 2010;123:1373-82. 10.1242/jcs.050906 [DOI] [PMC free article] [PubMed] [Google Scholar]
- 24.Zhang X, Cheng SL, Bian K, et al. MicroRNA-26a promotes anoikis in human hepatocellular carcinoma cells by targeting alpha5 integrin. Oncotarget 2015;6:2277-89. [DOI] [PMC free article] [PubMed] [Google Scholar]
- 25.Camorani S, Esposito CL, Rienzo A, et al. Inhibition of Receptor Signaling and of Glioblastoma-derived Tumor Growth by a Novel PDGFRβ Aptamer. Mol Ther 2014;22:828. 10.1038/mt.2013.300 [DOI] [PMC free article] [PubMed] [Google Scholar]
- 26.Zheng Z, Qiao Z, Chen W, et al. CIP2A regulates proliferation and apoptosis of multiple myeloma cells. Mol Med Rep 2016;14:2705. 10.3892/mmr.2016.5553 [DOI] [PubMed] [Google Scholar]
- 27.Moreno L, Popov S, Jury A, et al. Role of platelet derived growth factor receptor (PDGFR) over-expression and angiogenesis in ependymoma. J Neurooncol 2013;111:169-76. 10.1007/s11060-012-0996-z [DOI] [PubMed] [Google Scholar]
- 28.Zhang J, Chintalgattu V, Shih T, et al. MicroRNA-9 is an activation-induced regulator of PDGFR-beta expression in cardiomyocytes. J Mol Cell Cardiol 2011;51:337-46. 10.1016/j.yjmcc.2011.05.019 [DOI] [PubMed] [Google Scholar]
- 29.Song G, Liu K, Yang X, et al. SATB1 plays an oncogenic role in esophageal cancer by up-regulation of FN1 and PDGFRB. Oncotarget 2017;8:17771-84. [DOI] [PMC free article] [PubMed] [Google Scholar]
- 30.Han Q, Zhang HY, Zhong BL, et al. MicroRNA-145 Inhibits Cell Migration and Invasion and Regulates Epithelial-Mesenchymal Transition (EMT) by Targeting Connective Tissue Growth Factor (CTGF) in Esophageal Squamous Cell Carcinoma. Med Sci Monit 2016;22:3925-34. 10.12659/MSM.897663 [DOI] [PMC free article] [PubMed] [Google Scholar]
- 31.Klimczak-Bitner AA, Kordek R, Bitner J, et al. Expression of MMP9, SERPINE1 and miR-134 as prognostic factors in esophageal cancer. Oncol Lett 2016;12:4133-8. 10.3892/ol.2016.5211 [DOI] [PMC free article] [PubMed] [Google Scholar]
- 32.Rajamani D, Bhasin MK. Identification of key regulators of pancreatic cancer progression through multidimensional systems-level analysis. Genome Med 2016;8:38. 10.1186/s13073-016-0282-3 [DOI] [PMC free article] [PubMed] [Google Scholar]
- 33.Wang Q, Yu W, Huang T, et al. RUNX2 promotes hepatocellular carcinoma cell migration and invasion by upregulating MMP9 expression. Oncol Rep 2016;36:2777. 10.3892/or.2016.5101 [DOI] [PubMed] [Google Scholar]
- 34.Sun R, Wu J, Chen Y, et al. Down regulation of Thrombospondin2 predicts poor prognosis in patients with gastric cancer. Mol Cancer 2014;13:225. 10.1186/1476-4598-13-225 [DOI] [PMC free article] [PubMed] [Google Scholar]
- 35.Ao R, Guan L, Wang Y, et al. Silencing of COL1A2, COL6A3, and THBS2 inhibits gastric cancer cell proliferation, migration, and invasion while promoting apoptosis through the PI3k-Akt signaling pathway. J Cell Biochem 2018;119:4420-34. 10.1002/jcb.26524 [DOI] [PubMed] [Google Scholar]
- 36.Nishimura T, Tamaoki M, Komatsuzaki R, et al. SIX1 maintains tumor basal cells via transforming growth factor-beta pathway and associates with poor prognosis in esophageal cancer. Cancer Sci 2017;108:216-25. 10.1111/cas.13135 [DOI] [PMC free article] [PubMed] [Google Scholar]
- 37.Ando T, Ishiguro H, Kimura M, et al. The overexpression of caveolin-1 and caveolin-2 correlates with a poor prognosis and tumor progression in esophageal squamous cell carcinoma. Oncol Rep 2007;18:601-9. [PubMed] [Google Scholar]
- 38.Osako Y, Seki N, Kita Y, et al. Regulation of MMP13 by antitumor microRNA-375 markedly inhibits cancer cell migration and invasion in esophageal squamous cell carcinoma. Int J Oncol 2016;49:2255-64. 10.3892/ijo.2016.3745 [DOI] [PMC free article] [PubMed] [Google Scholar]
- 39.Chen Y, Zhang Y, Tan Y, et al. Clinical significance of SPARC in esophageal squamous cell carcinoma. Biochem Biophys Res Commun 2017;492:184-91. 10.1016/j.bbrc.2017.08.043 [DOI] [PubMed] [Google Scholar]
- 40.Zhou ZQ, Cao WH, Xie JJ, et al. Expression and prognostic significance of THBS1, Cyr61 and CTGF in esophageal squamous cell carcinoma. BMC Cancer 2009;9:291. 10.1186/1471-2407-9-291 [DOI] [PMC free article] [PubMed] [Google Scholar]
- 41.Xu Z, Zou L, Ma G, et al. Integrin β1 is a critical effector in promoting metastasis and chemo-resistance of esophageal squamous cell carcinoma. Am J Cancer Res 2017;7:531. [PMC free article] [PubMed] [Google Scholar]
- 42.Miller SE, Veale RB. Environmental modulation of alpha(v), alpha(2) and beta(1) integrin subunit expression in human oesophageal squamous cell carcinomas. Cell Biol Int 2001;25:61-9. 10.1006/cbir.2000.0678 [DOI] [PubMed] [Google Scholar]
- 43.Kashyap MK, Marimuthu A, Peri S, et al. Overexpression of periostin and lumican in esophageal squamous cell carcinoma. Cancers 2010;2:133-42. 10.3390/cancers2010133 [DOI] [PMC free article] [PubMed] [Google Scholar]
- 44.Huang T, Zhou F, Wang-Johanning F, et al. Depression accelerates the development of gastric cancer through reactive oxygen species-activated ABL1 (Review). Oncol Rep 2016;36:2435-43. 10.3892/or.2016.5127 [DOI] [PubMed] [Google Scholar]
- 45.Wang R, Morris DS, Tomlins SA, et al. Development of a multiplex quantitative PCR signature to predict progression in non-muscle-invasive bladder cancer. Cancer Res 2009;69:3810-8. 10.1158/0008-5472.CAN-08-4405 [DOI] [PMC free article] [PubMed] [Google Scholar]
- 46.Zhang Z, Wang Y, Zhang J, et al. COL1A1 promotes metastasis in colorectal cancer by regulating the WNT/PCP pathway. Mol Med Rep 2018;17:5037-42. [DOI] [PMC free article] [PubMed] [Google Scholar]
- 47.Li J, Ding Y, Li A. Identification of COL1A1 and COL1A2 as candidate prognostic factors in gastric cancer. World J Surg Oncol 2016;14:297. 10.1186/s12957-016-1056-5 [DOI] [PMC free article] [PubMed] [Google Scholar]
- 48.Su B, Zhao W, Shi B, et al. Let-7d suppresses growth, metastasis, and tumor macrophage infiltration in renal cell carcinoma by targeting COL3A1 and CCL7. Mol Cancer 2014;13:206. 10.1186/1476-4598-13-206 [DOI] [PMC free article] [PubMed] [Google Scholar]
- 49.Yuan L, Bo S, Liang C, et al. Overexpression of COL3A1 confers a poor prognosis in human bladder cancer identified by co-expression analysis. Oncotarget 2017;8:70508-20. 10.18632/oncotarget.19733 [DOI] [PMC free article] [PubMed] [Google Scholar]
- 50.Jin R, Jia S, Zhang T, et al. The highly expressed COL4A1 genes contributes to the proliferation and migration of the invasive ductal carcinomas. Oncotarget 2017;8:58172-83. [DOI] [PMC free article] [PubMed] [Google Scholar]
- 51.Liu W, Wei H, Gao Z, et al. COL5A1 may contribute the metastasis of lung adenocarcinoma. Gene 2018;665:57-66. 10.1016/j.gene.2018.04.066 [DOI] [PubMed] [Google Scholar]
- 52.Fischer H, Stenling R, Rubio C, et al. Colorectal carcinogenesis is associated with stromal expression of COL11A1 and COL5A2. Carcinogenesis 2001;22:875. 10.1093/carcin/22.6.875 [DOI] [PubMed] [Google Scholar]
- 53.Hou T, Tong C, Kazobinka G, et al. Expression of COL6A1 predicts prognosis in cervical cancer patients. Am J Transl Res 2016;8:2838-44. [PMC free article] [PubMed] [Google Scholar]
- 54.Yang D, Zhao D, Chen X. MiR-133b inhibits proliferation and invasion of gastric cancer cells by up-regulating FBN1 expression. Cancer Biomark 2017;19:425-36. 10.3233/CBM-160421 [DOI] [PubMed] [Google Scholar]
- 55.Coppola JM, Bhojani MS, Ross BD, et al. A Small-Molecule Furin Inhibitor Inhibits Cancer Cell Motility and Invasiveness 1. Neoplasia 2008;10:363-70. 10.1593/neo.08166 [DOI] [PMC free article] [PubMed] [Google Scholar]
- 56.Liu X, Tian H, Li H, et al. Derivate Isocorydine (d-ICD) Suppresses Migration and Invasion of Hepatocellular Carcinoma Cell by Downregulating ITGA1 Expression. Int J Mol Sci 2017. doi: . 10.3390/ijms18030514 [DOI] [PMC free article] [PubMed] [Google Scholar]
- 57.Kurozumi A, Goto Y, Matsushita R, et al. Tumor-suppressive microRNA-223 inhibits cancer cell migration and invasion by targeting ITGA3/ITGB1 signaling in prostate cancer. Cancer Sci 2016;107:84-94. 10.1111/cas.12842 [DOI] [PMC free article] [PubMed] [Google Scholar]
- 58.Akech J, Wixted JJ, Bedard K, et al. Runx2 association with progression of prostate cancer in patients: mechanisms mediating bone osteolysis and osteoblastic metastatic lesions. Oncogene 2010;29:811-21. 10.1038/onc.2009.389 [DOI] [PMC free article] [PubMed] [Google Scholar]
- 59.Qin X, Yan M, Zhang J, et al. TGFβ3-mediated induction of Periostin facilitates head and neck cancer growth and is associated with metastasis. Sci Rep 2016;6:20587. 10.1038/srep20587 [DOI] [PMC free article] [PubMed] [Google Scholar]
- 60.Mazzoccoli G, Pazienza V, Panza A, et al. ARNTL2 and SERPINE1: potential biomarkers for tumor aggressiveness in colorectal cancer. J Cancer Res Clin Oncol 2012;138:501-11. 10.1007/s00432-011-1126-6 [DOI] [PubMed] [Google Scholar]
- 61.Jin W, Katayama H, Leblanc AB, et al. Abstract LB-350: MicroRNA-301a, elevated in pancreatic cancer, targets tumor suppressor CDKN1A/p21 blocking cellular senescence and promoting invasion of pancreatic epithelial cells. Washington, DC: AACR 101st Annual Meeting, 2010. [Google Scholar]
- 62.Gao Q, Zheng J. Ginsenoside Rh2 inhibits prostate cancer cell growth through suppression of microRNA-4295 that activates CDKN1A. Cell Prolif 2018;51:e12438. 10.1111/cpr.12438 [DOI] [PMC free article] [PubMed] [Google Scholar]
- 63.Wu Z, Liu K, Wang Y, et al. Upregulation of microRNA-96 and its oncogenic functions by targeting CDKN1A in bladder cancer. Cancer Cell Int 2015;15:107. 10.1186/s12935-015-0235-8 [DOI] [PMC free article] [PubMed] [Google Scholar]
- 64.Shi X, Liang W, Yang W, et al. Decorin is responsible for progression of non-small-cell lung cancer by promoting cell proliferation and metastasis. Tumour Biol 2015;36:3345-54. 10.1007/s13277-014-2968-8 [DOI] [PubMed] [Google Scholar]
- 65.Wei WF, Zhou CF, Wu XG, et al. MicroRNA-221-3p, a TWIST2 target, promotes cervical cancer metastasis by directly targeting THBS2. Cell Death Dis 2017;8:3220. 10.1038/s41419-017-0077-5 [DOI] [PMC free article] [PubMed] [Google Scholar] [Retracted]
- 66.Rodríguez Fernández JL, Geiger B, Salomon D, et al. Suppression of tumorigenicity in transformed cells after transfection with vinculin cDNA. J Cell Biol 1992;119:427-38. 10.1083/jcb.119.2.427 [DOI] [PMC free article] [PubMed] [Google Scholar]


