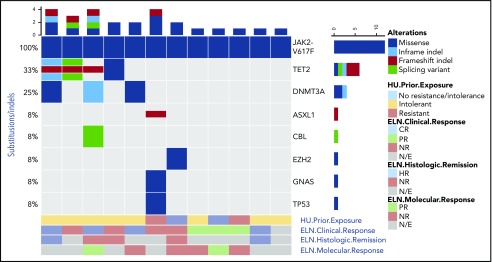
Figure 1.
Baseline genomic alterations. The genomic profiles of 11 patients as determined by next-generation sequencing studies are shown. Each column represents an individual patient. Bars at the top indicate the number of alterations identified per patient. Mutated genes are listed on the right. Frequency of each mutation in these 11 patients is listed on the left. Type of alteration is denoted by key. Additionally, prior hydroxyurea (HU) exposure qualified by intolerance or resistance is shown below, and this is further coupled to the clinical, pathologic, and molecular response by ELN criteria for each patient. HR, histologic response; N/E, not evaluable; NR, no response.

