

Abstract
The purpose of our study is to understand the protective role of miR-455-3p against abnormal amyloid precursor protein (APP) processing, amyloid beta (Aβ) formation, defective mitochondrial biogenesis/dynamics and synaptic damage in AD progression. In-silico analysis of miR-455-3p has identified the APP gene as a putative target. Using mutant APP cells, miR-455-3p construct, biochemical and molecular assays, immunofluorescence and transmission electron microscopy (TEM) analyses, we studied the protective effects of miR-455-3p on – 1) APP regulation, amyloid beta (Aβ)(1-40) & (1-42) levels, mitochondrial biogenesis & dynamics; 3) synaptic activities and 4) cell viability & apoptosis. Our luciferase reporter assay confirmed the binding of miR-455-3p at the 3’UTR of APP gene. Immunoblot, sandwich ELISA and immunostaining analyses revealed that the reduced levels of the mutant APP, Aβ(1-40) & Aβ(1-42), and C99 by miR-455-3p. We also found the reduced levels of mRNA and proteins of mitochondrial biogenesis (PGC1α, NRF1, NRF2, and TFAM) and synaptic genes (synaptophysin and PSD95) in mutant APP cells; on the other hand, mutant APP cells that express miR-455-3p showed increased mRNA and protein levels of biogenesis and synaptic genes. Additionally, expression of mitochondrial fission proteins (DRP1 and FIS1) were decreased while the fusion proteins (OPA1, Mfin1 and Mfn2) were increased by miR-455-3p. Our TEM analysis showed a decrease in mitochondria number and an increase in the size of mitochondrial length in mutant APP cells transfected with miR-455-3p. Based on these observations, we cautiously conclude that miR-455-3p regulate APP processing and protective against mutant APP-induced mitochondrial and synaptic abnormalities in AD.
Keywords: microRNA-455-3p, Alzheimer’s disease, Amyloid Precursor Protein, Amyloid Beta, Mitochondrial Biogenesis, Synaptic Proteins
1. Introduction
Alzheimer’s disease (AD) is a progressive mental illness that affect over 50 million people worldwide, including 5.7 Americans (Alzheimer’s Association 2018, Facts and Figures). AD is associated with the loss of memory, impairment of multiple cognitive functions, and changes in the personality and behavior [1–4]. Currently, there are no drugs available that can delay and/or prevent disease progression. Tremendous progress has been made in the last several decades in understanding molecular basis of both early-onset familial and late-onset sporadic AD. Early-onset familial AD involves genetic mutations and 2) late-onset “sporadic” AD involves aging and other lifestyle factors. Genetic mutations in amyloid precursor protein (APP), presenilin 1, and presenilin 2 cause a small proportion of familial AD [5]. Genetic polymorphisms in multiple genes – including the Apolipoprotein E gene with the E4 genotype, sortilin related receptor 1, clusterin, complement component receptor 1, CD2AP, EPHA1, and MS4A4/MS4A6E – are reported to be involved in the late-onset AD [5]. In addition to these genetic factors, lifestyle activities (diet, exposure to toxic environments, including chemicals), and oxidative mitochondrial DNA damage are major contributing factors found to affect the late-onset of sporadic AD.
Cellular, morphological and pathological examination of AD cells and mouse models and postmortem AD brains revealed that AD is mainly associated with synaptic damage, loss of synapses & synaptic proteins, proliferation of reactive astrocytes and activated microglia, defects and alterations in cholinergic neurons, defective autophagy/mitophagy, age-dependent imbalance in hormones, structural and functional changes in mitochondria, microRNA (miRNAs) changes, in addition to intracellular neurofibrillary tangles (NFTs) and extracellular Aβ plaques [6–17]. Among these changes, synaptic damage and the loss of synapses and mitochondrial oxidative damage are widely recognized as early events in the progression and pathogenesis of AD. In recent years, several published reports suggested that miRNAs play a large role in disease progression, particularly dysregulating 3’ untranslated region (3’UTR) of APP, PS1, PS2 and ApoE4 genes [17].
However, it is still unclear how recently discovered miRNAs involved in dysregulating 3’UTR of these genes. MiRNAs are a class of small nucleotide sequences that play important roles in regulating multiple genes. Abnormal expression of miRNAs has been reported in the brain, cerebrospinal fluid, serum, and plasma samples of various human diseases including AD [18–24]. Given the important role of miRNAs in their deregulation in cells affected by AD, miRNAs – in particular, miRNA-455-3p could be a potential biomarker for AD [19, 21]. Besides, there are many other miRNAs those regulates the expression of important AD-related genes, therefore these could be a therapeutic target for AD [25].
MiRNA research in the AD field has mainly focused on the proteins APP, BACE1 and tau, and how modulation of these proteins might slow AD progression or improve AD-affected neurons. Several studies reported the regulation of APP genes by different miRNAs [25]. These miRNAs regulate or otherwise affect the APP protein expression in different ways, either by directly interacting to 3’UTR of APP or by interacting with APP mRNA regulatory elements associated with AD single-nucleotide polymorphism (SNPs) [26]. MiR-101 was a negative regulator of APP expression and high levels of miR-101 significantly reduced the accumulation of amyloid-β in hippocampal neurons and in different cell lines [26, 27]. MiR-33 was found to be regulate ApoE and Aβ metabolism in the brain by inducing the level of the ABCA1 protein [28]. Ma et al, (2017) reported that miR-125b was upregulated in AD patients, promoted neuronal cell apoptosis, and the phosphorylation of tau by activating cyclin-dependent kinase 5 (CDK5) and p35/25 proteins [29]. Recently, Long et al, reported novel upregulation of amyloid-β precursor protein translation and Aβ production by miR-346 via targeting of APP mRNA 5′-untranslated region [30].
MiR-455-3p is a member of broadly conserved family non-coding RNA, expressed in most species. In humans, miR-455-3p is present in 2 isoforms that exhibits one nucleotide difference: miR-455-3p.1 and miR-455-3p.2. MiR-455-3p has been implicated in various human diseases, including chondrogenesis, atherosclerosis, preeclampsia, and various human cancers (e.g., colon, prostate, gastric) [31]. These findings prompted us to determine whether miR-455-3p is implicated in AD, and if so, how.
In a recent global miRNA analysis study of different sources of AD-affected cells (e.g., serum samples from AD patients, from AD postmortem brains, and neurons from the APP transgenic mice), we found that expression levels of miR-455-3p were higher in AD-affected serum and neurons relative to control serum and neurons, suggesting that miR-455-3p is implicated in disease process [21, 31]. However, it is unclear why the miR-455-3p was upregulated in AD cells and/or tissues. In our previous study, we found elevated levels of miR-455-3p in human and mouse neuroblastoma cells treated with Aβ(1-42) peptide, indicating that upregulation of miR-455-3p is a compensatory response to the increased levels of Aβ in AD cells. If so, how much increased levels of miR-455-3p is required to reduce Aβ production in AD affected neurons?
In our previous study, we identified several potential genes that are targeted by miR-455-3p and very important in AD pathogenesis [31]. APP gene was one of the top-targeted genes in our miRNA analysis. However, 1) the precise molecular links between miR-455-3p and APP gene are not clearly understood, particularly whether upregulated miR-455-3p is protective or deleterious in the progression and pathogenesis of AD and 2) further, the impact of 455-3p on APP processing & Aβ production, mitochondrial biogenesis, mitochondrial dynamics and synaptic activity in AD neurons is unclear. To address these questions, we studied APP processing, mitochondrial biogenesis, mitochondrial dynamics, mitochondrial morphology, synaptic activity and cell viability in mutant APP cells that express miR-455-3p.
2. Material and Methods
2.1. Cell culture
The N2a mouse neuroblastoma cell line was purchased from the ATCC (American Type Culture Collection) and was maintained in the Reddy laboratory. The cells were grown in DMEM+F12 (1:1) supplemented with 10% FBS at 37°C with 5% CO2.
2.2. Mutant APP cDNA construct
The mutant APP Swe cDNA clone (pCAX-APP Swe/Ind) was obtain from the laboratory of Dr. Arubala Reddy [32]. APP Swe cDNA was cloned into a mammalian expression vector pRP-Puro-CAG. The pRP vector is a puc backbone having a CMV promoter and an SV40 polyadenylation site with puromycin selection for stable transfection. Details are available in Supplemental Information (SI) Figure 1. The sequence output was confirm with the NCBI sequence hAPP [NM_201414.2]*(K595N M596L V642F) (SI Figure 2).
2.3. MiR-455-3p expression vector
MiR-455-3p expression vector (pRP[Exp]-U6>hsa-miR-455-3p-CAG-EGFP) was purchased from VectorBuilder (Cyagen Biosciences, Santa Clara, CA, EISA). It was a 5128 bp plasmid propagated in Stbl3 host and contained a Green Fluorescent Protein (GFP) encoding gene (SI Figure 3). GFP expression readily allowed the detection and confirmation of transfection.
2.4. Target prediction analysis of miR-455-3p
In silico analysis was performed with various bio-informatics algorithms, such as DIANA-MICROT, MICRORNA.ORG, MIRDB, RNA22-HAS, TARGETMINER, and TARGETSCAN-VERT. MiR-455-3p had at least 2 binding sites at 3′UTR of the genes and total context++ score ranges from −0.1 to −0.46. For example, miR-455-3p binds at the 2 sequence sites of 3′ UTR of the APP gene at sequence positions 522-528 and 3,139-3,145 (Figure 1A).
Figure 1 -. MiR-455-3p interaction with the APP gene and its effects on neuroblastoma cells survival.
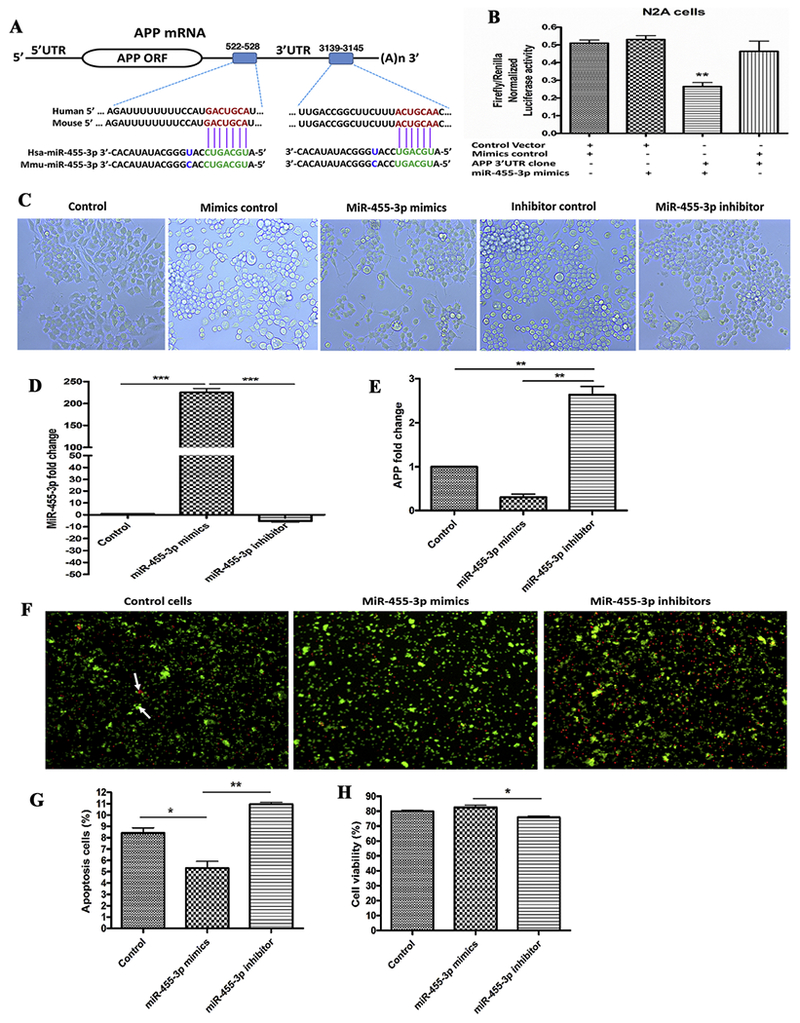
(A) The two putative binding sites of miR-455-3p at the 3′-UTR regions of a wild-type APP gene in humans and mice. Region A (522-528) had 7 nucleotide binding sites, and Region B (3139-3145) had 6 nucleotide binding sites with the seed sequence of miR-455-3p in both the human and mouse wild-type APP gene (shown in green). (B) Luciferase reporter assay for miR-455-3p binding with the APP gene. Normalized luciferase activity (Firefly/Renilla) in neuroblastoma cells co-transfected with the APP 3’UTR clone (HmiT009578-MT06) and miR-455-3p mimics. Firefly/Renilla luciferase activity of the APP 3’UTR clone was significantly decrease by the miR-455-3p. (C) Representative images of neuroblastoma cells morphology after 24 hr of miR-455-3p mimics and inhibitor transfection (10× magnification). Quantitative measurement of miR-455-3p (D), and APP fold-change (E), in cells at 24 hr post mimics and inhibitor transfection. (F) Representative images of Annexin V and PI staining of cells at 24 hr post-transfection of miR-455-3p mimics and inhibitor. White arrow represents the viable (green) and dead (red) cells. Percentage (%) of apoptotic cells (G), and viable cells populations (H), after 24 hr of miR-455-3p mimics and inhibitor transfection. (*P<0.05) (**P<0.01) (***P<0.001)
2.5. Luciferase reporter assay
To confirm the binding of miR-455-3p at the 3’UTR of the APP gene, neuroblastoma cells were plated at a density of 5×10⁴ cells per well in a 24-well plate for one day before transfection. The cells were then transfected with APP 3 ‘UTR target expression clone (HmiT009578-MT06) for the human APP (NM_000484.2) and miRNA target clone control vector having mutated 3’UTR of APP gene pEZX-MT06 (CmiT000001-MT06) (Genecopoeia, Rockville, MD, USA). Cells were also transfected with miR-455-3p mimics and mimic controls (Applied Biological Materials, Inc., Richmond, BC V6V 2J5, Canada). After 24 hr of transfection, luciferase activity was measured with the Luc-Pair™ Duo-Luciferase Assay Kit 2.0 (Genecopoeia, Rockville, MD, USA) as per manufacturer instructions. The samples were read with an illuminometer.
2.6. Transfection of miR-455-3p mimics and inhibitors
Neuroblastoma cells were transfected with 25 nM (final concentration) of miR-455-3p mimic oligonucleotide and miR-455-3p inhibitor oligonucleotide (Applied Biological Materials, Richmond, BC, CANADA) using lipofectamine™ 2000 reagent (Invitrogen Life Technologies, Carlsbad, CA, USA) following the manufacturer’s instructions.
2.7. Transfection of the MiR-455-3p vector and the mutant APP cDNA
Neuroblastoma cells were cultured in antibiotic-free media, in 6-well plates one day before transfection. On the next day, when cells reached 70% to 80% confluence, they were transfected with the miR-455-3p vector and the mutant APP cDNA with the lipofectamine™ 2000 reagent. Mutant APP cDNA contains three identical sequences at three different locations those were complementary to the seed sequence of miR-455-3p (SI Figure 4).
2.8. Apoptotic assay
A cell-based apoptosis assay was performed, using the Cellometer Vision CBA Image Cytometry System (Nexcelom Bioscience, LLC, Lawrence, MA, USA) with 2 fluorophores-Annexin V-FITC and propidium iodide (PI) staining solutions, following manufacturer’s instructions. Briefly, neuroblastoma cells were harvested using trypsin, then spun down to 300 g for 3 min. The pellets were washed with 1×PBS. Cells were counted using a hematocytometer, and 100,000 to 150,000 cells were collected and resuspended in 40 μl of an Annexin V binding buffer. Five μl of Annexin V-FITC reagent (green) and PI (red) each were added to the binding buffer containing the cells. The solution was gently mixed by pipetting up and down. It was then incubated for 15 min at room temperature in the dark. After incubation, 250 μl of 1×PBS was added and spun down at 300 g for 3 min. Cell pellets were re-suspend in 50 μl of an Annexin V binding buffer and assessed for apoptosis analysis [32].
2.9. Cell viability test (MTT assay)
Mitochondrial respiration, an indicator of cell viability, was assessed in the neuroblastoma cells from control and experimental treatments (n=4), using the mitochondrial-dependent reduction of 3-(4,5-dimethyl-thiazol-2-yl)-2,5-diphenyl-tetrazolium bromide (MTT) to formazan as described in Reddy et al, (2016) [33]. Cells were trypsinized until they have lifted off the cell culture plate, then spin down at 300g for three minutes, decant the supernatant and resuspend cells in 1×PBS. 20μl of cells were transferred to the countering chamber, cell viability was determined by using the Cellometer Vision CBA Image Cytometry System.
2.10. Assessment of miR-455-3p levels -
Quantification of miR-455-3p involved 3 steps:
(i). Polyadenylation.
One μg of total RNA was polyadenylated with a miRNA First-Strand cDNA synthesis kit (Agilent Technologies Inc., CA, USA), following manufacturer’s instructions [18].
(ii). cDNA synthesis.
Ten μL of polyadenylated miRNAs were processed for cDNA synthesis with the miRNA First-Strand cDNA synthesis kit (Agilent Technologies Inc., CA, USA). Resulting cDNAs were diluted with 20 μL of RNase-free water and stored at −80°C for further analysis.
(iii). Real-time qRT-PCR.
Real-time RT-PCR was performed by preparing a reaction mixture containing 1 μL of miRNA-specific forward primer (10μm), 1 μL of a universal reverse primer (3.125 μM) (Agilent Technologies Inc., CA, USA), 10 μl of 2× SYBR Green PCR master mix (Applied Biosystems CA), and 1 μL of cDNA. To this mixture RNase-free water was added up to a 20-μL final volume. Primers used in the current study were synthesized commercially (Integrated DNA Technologies, Inc., City, Iowa, USA) (SI Table 1). To normalize the miRNA expression, snoRNA-202 (small nuclear RNA) expression was also quantified in the cells, which was used as an internal control. The reaction mixture for each sample prepared in triplicates was set in the 7900HT Fast Real-Time PCR System (Applied Biosystems). MiRNA fold change were calculated by using the formula (2−ΔΔct) [18, 21].
2.11. Messenger RNA levels of APP, mitochondrial biogenesis and synaptic genes
Quantification of mRNA levels in APP, mitochondrial biogenesis, and synaptic genes was carried out with real-time RT-PCR using methods described in Reddy et al, (2016) [33]. The oligonucleotide primers were designed with primer express software (Applied Biosystems) for the housekeeping genes β-actin, APP, PGC1α, NRF1, NRF2, TFAM, DRP1, FIS1, OPA1, Mfn1, Mfn2, synaptophysin, and PSD95. The primer sequences and amplicon sizes are listed in SI Table 1. SYBR-Green chemistry-based quantitative real-time RT-PCR was used to measure mRNA expression of these genes using β-actin and GAPDH as housekeeping genes, as described by Manczak et al, (2016) [34].
2.12. Immunoblot analysis for the mutant APP protein
Immunoblot analysis was performed, using protein lysates prepared from all groups of cells (cells transfected and untransfected with mutant APP, miR455-3p), using the 6E10 antibody that recognizes full-length mutant human APP and Aβ. We also performed immunoblot analysis for all mitochondrial biogenesis proteins. Details of the antibody dilutions are given in SI Table 2. Twenty μg of protein lysates were resolved on a 4-12% Nu-PAGE gel (Invitrogen). The resolved proteins were transferred to nylon membranes (Novax Inc., San Diego, CA, USA) and then incubated for 1 hr at room temperature with a blocking buffer (5% dry milk dissolved in a TBST buffer). The nylon membranes were incubated overnight with the primary antibodies. The membranes were washed with a TBST buffer 3 times at 10-min intervals and then incubated for 2 hr with an appropriate secondary antibody, sheep anti-mouse HRP 1:10,000, followed by three additional washes at 10-min intervals. Proteins were detected with chemiluminescence reagents (Pierce Biotechnology, Rockford, IL, USA), and the bands from the immunoblots were visualized [32].
2.13. Immunostaining and immunofluorescence analysis
To determine the immunoreactivity and intensity of the APP protein, we performed immunofluorescence analysis using neuroblastoma cells transfected with a miR-control vector, a miR-455-3p vector, and a mutant APP cDNA. The cells were co-transfected with an APP clone and a miR-455-3p vector. The cells were grown on coverslips for 24 hr post-transfection. They were then were washed with 1× PBS three times for 5 min each and fixed in freshly prepared 4% paraformaldehyde in PBS for 10 min. The cells were washed again with PBS and permeabilized with 0.1% Triton-X100 in PBS. The cells were blocked with a 1% blocking solution (Invitrogen) for 1 hr at room temperature. The cells were incubated with 6E10 primary antibody (1:200 dilution) (Biolegend, San Diego, CA) overnight at 4°C. After incubation, the cells were washed 3 times with PBS, for 10 min each. The cells were incubated with an anti-mouse secondary antibody conjugated with Fluor 488 (1:500 dilution) (Invitrogen) for 1 hr at room temperature, then washed 3 times with PBS, and mounted on slides. Photographs were taken with a multiphoton laser scanning microscope system (ZeissMeta LSM510). To quantify the immunoreactivities of antibodies, 10-15 photographs were taken at 20× magnification. Statistical significance was assessed by the intensities of red, green or blue, using NIH ImageJ software [32].
2.14. ELISA for Aβ(1-40) and Aβ(1-42)
The protein lysates were prepared from neuroblastoma cells pellets and soluble Aβ levels were measured, using human-specific Aβ(1-40) and Aβ(1-42) sandwich ELISA kit. We used Human Quantikine® ELISA Amyloid β (aa1-40) and (aa1-42) immunoassay kit as per manufacturer instructions (R&D Systems, Inc. Minneapolis, MN, USA).
2.15. Transmission electron microscopy
Experiments were performed in 60-mm Petri dishes. Neuroblastoma cells were transfected with a miR-control vector, the miR-455-3p vector, and the mutant APP cDNA; and were co-transfected with the APP clone and the miR-455-3p vector. After 48 hr, the cells were washed with 5 ml 1× PBS. Cell pellets were dissolved in a fixative solution (8% glutaraldehyde, 16% paraformaldehyde, and 0.2M sodium cacodylate buffer) for 1 hr at room temperature. The cells were removed from the fixative solution and scraped into one ml of a fresh fixative solution. Cells were incubated at room temperature for 30 min. The cells were centrifuge at 300 g for 3 min [32]. The resulting cell pellet was undergone electron microscopy at the Imaging Core Facility at Texas Tech University.
2.16. Statistical considerations
Statistical analyses were conducted, by using the student T-test for analyzing 2 groups of samples, and one-way comparative analysis of variance (ANOVA) was used for analyzing more than two groups of samples. Significant differences in five group of samples were calculated by Bonferroni’s multiple comparison tests. Statistical parameters were calculated, using Prism software, v6 (La Zolla, CA, USA). P<0.05 was considered statistically significant.
3. Results
3.1. MiR-455-3p interaction with the APP gene
Our recent in silico miRNA target prediction analysis showed two binding sites of miR-455-3p at 3′ UTR of the APP gene (ENST00000346798.3) at sequence positions 522–528 and 3,139–3,145 (Figure 1A). The cumulative weighted context++ score was −0.29, total context++ score was −0.35, and the aggregate PCT was <0.1 for miR-455-3p (Table 1). The miR-455-3p binding sequence at the 3’UTR of APP mRNA was similar in the human and mouse genome. To confirm these results, a luciferase reporter assay was performed on a vector having a wild-type APP 3’UTR sequence and on a control vector. Luciferase activity was significantly (P=0.002) reduced in the cells transfected with miR-455-3p mimics compared to their respective controls (Figure 1B). These results indicate that the 3’UTR site of mRNA from the APP protein consists of conserved binding sites for miR-455-3p.
Table 1-.
Parameters for miR-455-3p binding at 3’UTR of APP gene
| Previous TargetScan publication(s) | None |
| Aggregate PCT | <0.1 |
| Total context++ score | −0.35 |
| Cumulative weighted context++ score | −0.29 |
| Representative miRNA | hsa-miR-455-3p.2 |
| 6mer sites | 1 |
| Poorly conserved 7mer-A1 sites | 1 |
| Poorly conserved 7mer-m8 sites | 1 |
| Poorly conserved sites total | 2 |
| 3P-seq tags + 5 | 4570 |
| Gene name | amyloid beta (A4) precursor protein |
| Representative transcript | ENST00000346798.3 |
| Target gene | APP |
3.2. MiR-455-3p functional analysis
(a). Neuroblastoma cells morphology treated with miR-455-3p mimics and inhibitors
Since miR-455-3p target APP gene regulation, we sought to determine the effects of increased and decreased levels of miR-455-3p on cell morphology. We analyzed the cell morphology after miR-455-3p mimics and inhibitor treatment. Microscopic examination of cells at 24 hr post-transfection with the miR-455-3p mimics showed extended cell proliferation compared to the controls (Figure 1C). The cells transfected with miR-455-3p inhibitors did not show normal and healthy proliferation. These findings suggest that higher expression levels of miR-455-3p mimics promoted cell growth, on the other hand, inhibitors reduced cell proliferation.
(b). MiR-455-3p and APP expression analysis
To confirm the regulation of APP gene by miR-455-3p, cells were transfected with miR-455-3p mimics and inhibitors, followed by the quantification of miR-455-3p and APP mRNA expression at 24 hr post-transfection. qRT-PCR analysis showed the significant upregulation of miR-455-3p (225-fold) (P=0.0001) in cells transfected with miR-455-3p mimics. On the contrary, cells treated with miR-455-3p inhibitors showed a significant downregulation (−5.23-fold) of miR-455-3p relative to untreated cells (Figure 1D).
In our qRT-PCR analysis, we found that mRNA levels of APP were reduced by 0.3-fold (P=0.001) in the cells transfected with the miR-455-3p mimics. On the other hand, we found 2.6-fold upregulation of APP expression in the cells transfected with the miR-455-3p inhibitors (Figure 1E). These results agree with our luciferase assay data that miR-455-3p had the potential to modulate the APP expression.
(c). Effects of miR-455-3p mimics and inhibitors on cell viability
As shown in Figure 1F and 1G, apoptotic cell death was reduced by 5.31% (P=0.042) in the cells transfected with miR-455-3p mimics relative to untransfected cells. On the contrary, apoptotic cell death was increased by 10.96% (P=0.0071) in cells transfected with miR-455-3p inhibitors. These findings point to the protective effects of miR-455-3p mimics on cell survival.
Cell viability analysis showed the increased levels of cell survival in cells transfected with miR-455-3p mimics compared to the untransfected cells (Figure 1H). As expected, cell survival was significantly reduced in cells transfected with miR-455-3p inhibitors. These findings suggest that miR-455-3p mimics increases cell survival.
3.3. Effect of miR-455-3p on mutant APP
To determine the effect of mutant APP and miR-455-3p on cell survival and cell viability, cells were transfected with mutant APP cDNA and miR-455-3p vector. Cells were observed under a light microscope after 24 hours transfection with mutant APP and miR-455-3p individually and in combination. MiR-455-3p vector had a green fluorescence protein. As shown in Figure 2A, cells transfected with miR-455-3p vector showed an increased number of cells relative to the miR-control vector (vector without miR-455-3p sequence) and mutant APP cDNA transfected cells.
Figure 2 -. Regulation of mutant APP cDNA expression by miR-455-3p.
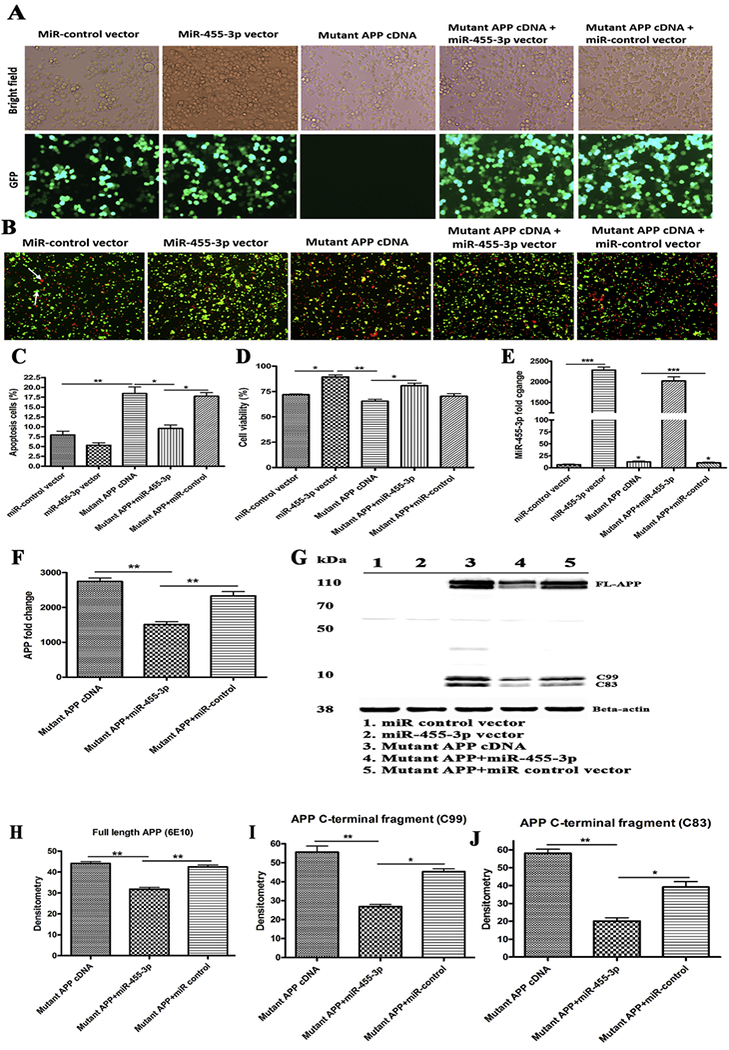
(A) Representative images for transfection of the miR-455-3p expression vector (GFP), the miR-control (GFP) vector, and the mutant APP cDNA in neuroblastoma cells (10× magnification). Bright field images and green fluorescence detected in the same field at 24 hr post-transfection (10× magnification). (B) Representative images of Annexin V and Propidium Iodide (PI) stained neuroblastoma cells transfected with the miR-control vector, the miR-455-3p vector, and the mutant APP cDNA. The white arrow indicates the populations of viable (green) cells and dead (red) cells. (C) Percentage (%) of an apoptotic cell population after 24 hr of the miR-455-3p vector, the miR-control vector, and the mutant APP cDNA transfecting cells. (D) Percentage (%) of a viable cell population after 24 hr of the miR-control vector, the miR-455-3p vector and the mutant APP cDNA transfecting cells. (E) Quantitative measurement of miR-455-3p fold change expression after 24 hr of the miR-455-3p vector and the mutant APP cDNA transfecting cells. (F) Quantitative measurement of APP mRNA folds change expression after 24 hr of the miR-455-3p vector and the mutant APP cDNA transfecting cells. (G) Western blot for APP (6E10), the C-terminal fragment of APP (C99) and B-actin proteins in cells transfected with the miR-control vector, the miR-455-3p vector, mutant APP cDNA and co-transfected cells. Quantitative measurement of (H) APP (6E10) and C-terminal fragments of APP C99 (I), and C83 (J) proteins levels by densitometry in the mutant APP cDNA and the miR-455-3p vector transfecting cells. (*P<0.05) (**P<0.01) (***P<0.001)
Significantly increased apoptotic cell death was observed in mutant APP cells relative to untransfected cells (18.46%) (P=0.001). Co-transfected cells with both mutant APP+miR-455-3p showed significantly reduced apoptotic cell death (9.54%) (P=0.031) relative to mutant APP cells (Figure 2B and 2C). Cell viability was significantly increased (91.35%) (P=0.014) in cells transfected with miR-455-3p compared to miR-control vector-transfected cells (71.95%) (Figure 2D). Similarly, cell viability was higher in cells co-transfected with the mutant APP and miR-455-3p vector compared to cells transfected with mutant APP alone. These findings suggest that miR-455-3p is protective against mutant APP toxicity.
3.4. Effect of miR-455-3p on mRNA and protein levels of mutant APP
Next, we determined the expression of miR-455-3p in miR-control vector, miR-455-3p vector and mutant APP transfected cells and how overexpression of miR-455-3p modulates the expression of mutant APP cDNA.
Our miR-455-3p analysis revealed that increased expression levels of miR-455-3p (2285-fold) (P=0.0001) in cells transfected with miR-455-3p vector compared to the miR-control vector (Figure 2E). We also observed increased levels of miR-455-3p in cells transfected with mutant APP cDNA compared to miR-control vector (Figure 2E). As shown in Figure 2F, significantly reduced levels of mutant APP mRNA (1508-fold) (P=0.008) were found in cells co-transfected with miR-455-3p and mutant APP relative to cells transfected with mutant APP alone.
Our immunoblot analysis findings agrees with mRNA data that significantly reduced the level of full-length APP and both C99 and C83 fragments in cells co-transfected with the miR-455-3p and mutant APP cells (P=0.0021) relative to mutant APP cells alone (Figure 2G, 2H, 2I and 2J). These observations suggest that miR-455-3p not only modulate full-length APP but also involved in c-terminal fragments of APP.
3.5. Effect of miR-455-3p on the localization of mutant APP
To determine the location and immunoreactivity levels of mutant APP and Aβ in cells transfected with miR-455-3p, mutant APP and in combination, immunostaining of cells were performed. As shown in Figure 3A, cells transfected with miR-455-3p, showed green fluorescence protein. Expression intensity of APP (6E10, red) was significantly reduced in cells co-transfected with the miR-455-3p and mutant APP cDNA (P=0.027) compared to the cells transfected with mutant APP alone (Figure 3A and 3B). These findings further confirmed that miR-455-3p has a role in regulating mutant APP and Aβ levels.
Figure 3 – MiR-455-3p reduces APP and amyloid proteins.
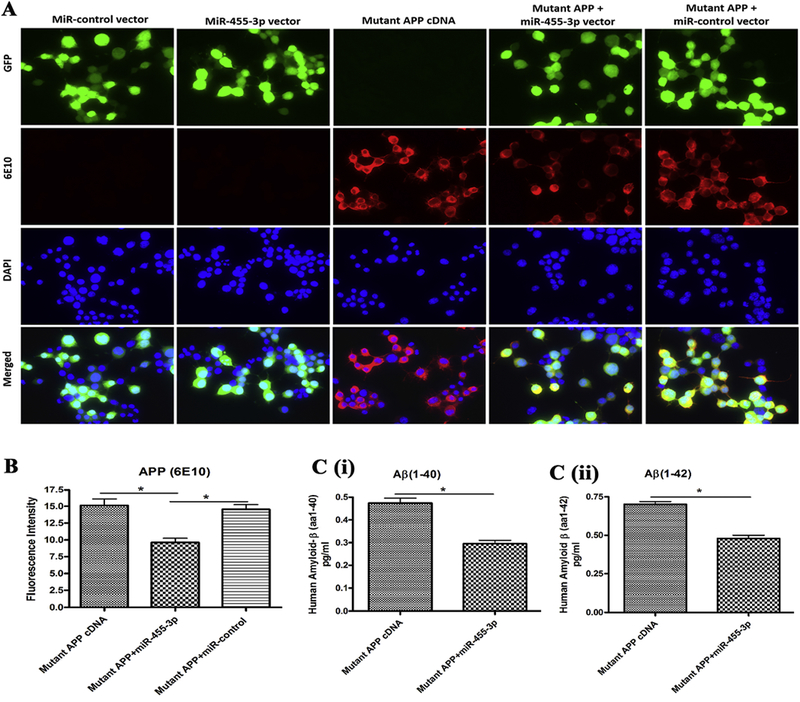
(A) Representative immunostaining images of neuroblastoma cells transfected with the miR-control vector, the miR-455-3p vector, the mutant APP cDNA, the mutant APP and miR-455-3p co-transfected. Cells were stain with the APP (6E10) antibody producing red fluorescence (20× magnification). Green fluorescence showed the miR-control and miR-455-3p vector expression and the nucleus of the cell stained with DAPI (blue). Fluorescence intensity (red) of the mutant APP was reduce in mutant APP and miR-455-3p co-transfected cells. (B) Quantitative measurement of fluorescence intensity of the APP (6E10) protein in mutant APP, miR-455-3p, and miR-control vector transfected cells. (C) ELISA analysis for amyloid (1-40) and (1-42) levels in neuroblastoma cells. Quantitative detection of the (i) human amyloid-β(1-40) and (ii) amyloid-β(1-42) peptide level in mutant APP cDNA and miR-455-3p vector transfected cells. (*P<0.05)
3.6. Effect of miR-455-3p on Aβ(1-40) and Aβ(1-42) levels
Since, miR-455-3p reduced the levels of full-length mutant APP, we next checked the levels of soluble Aβ(1-40) and Aβ(1-42) in neuroblastoma cells lysate. Level of Aβ(1-40) was significantly reduced (P=0.011) in the cells co-transfected with the miR-455-3p and mutant APP compared to cells transfected with mutant APP alone (Figure 3C). Similarly, the level of Aβ(1-42) was also significantly lowered by miR-455-3p in co-transfected cells with miR-455-3p and mutant APP compared to cells transfected with mutant APP alone (Figure 3C). These observations suggest that miR-455-3p reduced both Aβ(1-40) and Aβ(1-42) levels in mutant APP cells.
3.7. Effect of miR-455-3p on mitochondrial biogenesis and synaptic activity
To determine the effect of miR-455-3p on mitochondrial biogenesis and synaptic proteins, we assessed mitochondrial biogenesis (PGC1α, NRF1, NRF1, TFAM), and synaptic (synaptophysin, and PSD95) genes at mRNA and protein levels.
As shown in Table 2, mRNA levels of mitochondrial biogenesis genes PGC1α, NRF1, NRF1, TFAM were significantly reduced in the mutant APP cells relative to miR-control transfected cells. On the other hand, mRNA levels of mitochondrial biogenesis genes were significantly increase in co-transfected cells with miR-455-3p and mutant APP relative to cells transfected with mutant APP alone (Table 2).
Table 2-.
qRT-PCR analysis of neuroblastoma cells transfected with miR-control vector, miR-455-3p vector, mutant APP cDNA and their mRNA fold change calculations relative to miR-control vector
| (Fold change-mRNA/β-actin) | |||||
|---|---|---|---|---|---|
| Genes | miR-455-3p vector | Mutant APP cDNA | Mutant APP+miR-455-3p | Mutant APP+miR-control | |
| Mitochondrial biogenesis genes | PGC1α | 4.24** | −1.8* | 3.64** | −1.7* |
| NR.F1 | 3.18** | −1.4 | 2.48* | −4.81** | |
| NRF2 | 3.2* | −1.59* | 2.43* | −1.25* | |
| TFAM | 2.6* | −1.4* | 2.68* | −4.49** | |
| Synaptic genes | Synaptophysin | 2.5* | −2.44* | 2* | −1.45* |
| PSD95 | 3.25* | −3.29** | 2.78* | −2.37** | |
| Mitochondrial fission genes | DRP1 | − 1.42* | 2.36* | − 1.18 | 2.43* |
| FIS1 | − 1.37* | 1.89* | − 1.17 | 1.61* | |
| Mitochondrial fusion genes | OPA1 | 1.59* | − 1.93* | 1.85* | − 1.4* |
| Mfn1 | 1.92* | − 1.46* | 1.48* | − 1.76* | |
| Mfn2 | 2.01* | − 1.14 | 1.93* | − 1.19 | |
Similarly, quantitative densitometry based on immunoblot analysis revealed decreased protein levels of PGC1α, NRF1, NRF2, and TFAM by the mutant APP relative to cells transfected with miR-control. On the other hand, biogenesis protein levels were increased in miR-455-3p and mutant APP cDNA co-transfected cells relative to transfected with mutant APP alone, indicating that miR-455-3p enhances biogenesis activity (Figure 4A–4E).
Figure 4 -. Immunoblotting for mitochondrial biogenesis and synaptic genes.
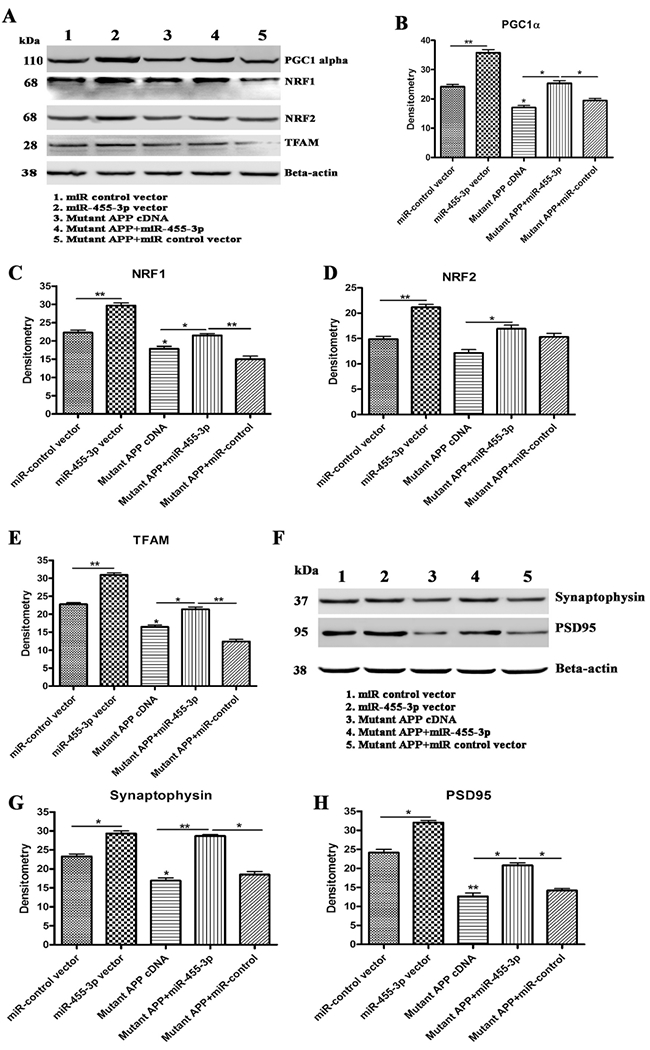
(A) Representative western blot images for PGC1α, NRF1, NRF2, TFAM, and beta-actin proteins levels in 1) Neuroblastoma cells transfected with the miR-control vector, 2) Neuroblastoma cells transfected with the miR-455-3p expression vector, 3) Neuroblastoma cells transfected with the mutant APP cDNA, 4) Neuroblastoma cells co-transfected with the miR-455-3p and mutant APP cDNA, and 5) Neuroblastoma cells co-transfected with the mutant APP and miR-control vector. Quantitative measurement of the levels of (B) the PGC1α protein (C) NRF1, (D) NRF2, and (E) TFAM using densitometry in 1) Cells transfected with the miR-control vector, 2) Cells transfected with the miR-455-3p expression vector, 3) Cells transfected with mutant APP cDNA, 4) Cells co-transfected with the miR-455-3p and mutant APP cDNA, and 5) Cells co-transfected with the mutant APP and miR-control vector. (F) Representative western blot images for synaptophysin, PSD95, and beta-actin proteins levels in 1) Cells transfected with the miR-control vector, 2) Cells transfected with the miR-455-3p expression vector, 3) Cells transfected with the mutant APP cDNA, 4) Cells co-transfected with the miR-455-3p and mutant APP cDNA, and 5) Cells co-transfected with the mutant APP and miR-control vector. Quantitative measurement of the levels of (G) the synaptophysin protein and (H) PSD95 using densitometry in same groups of cells. (*P<0.05) (**P<0.01)
Our synaptic protein analysis revealed the significantly reduced levels of synaptophysin and PSD95 genes at mRNA (Table 2) and protein levels (Figures 4F–4H) in cells transfected with mutant APP relative to controls. On the other hand, synaptic protein levels were increased significantly in miR-455-3p co-transfected cells relative to transfected with mutant APP alone.
3.8. Effect of miR-455-3p on mitochondrial dynamics (fission and fusion)
Further, to confirm the effect of miR-455-3p on mitochondrial dynamics genes, we studied the expression of mitochondrial fission proteins (DRP1 and FIS1) and fusion proteins (OPA1, Mfn1, and Mfn2) at mRNA and protein levels. mRNA levels of DRP1 and FIS1 were significantly increased in cells transfected with mutant APP cDNA compared to controls. On the contrary, cells co-transfected with miR-455-3p and mutant APP cDNA showed reduced levels of fission genes DRP1 and FIS1 relative to mutant APP cells (Table 2). As expected, mRNA levels of mitochondrial fusion genes (OPA1, Mfn1, and Mfn2) were significantly reduce in mutant APP cells, but upregulated in the cells co-transfected with miR-455-3p and mutant APP cDNA (Table 2).
Our immunoblotting data agreed with mRNA observations (Figures 5A–5F). These results conclude that miR-455-3p reduce fission proteins and enhances fusion proteins.
Figure 5 -. Immunoblotting for mitochondrial dynamic genes.
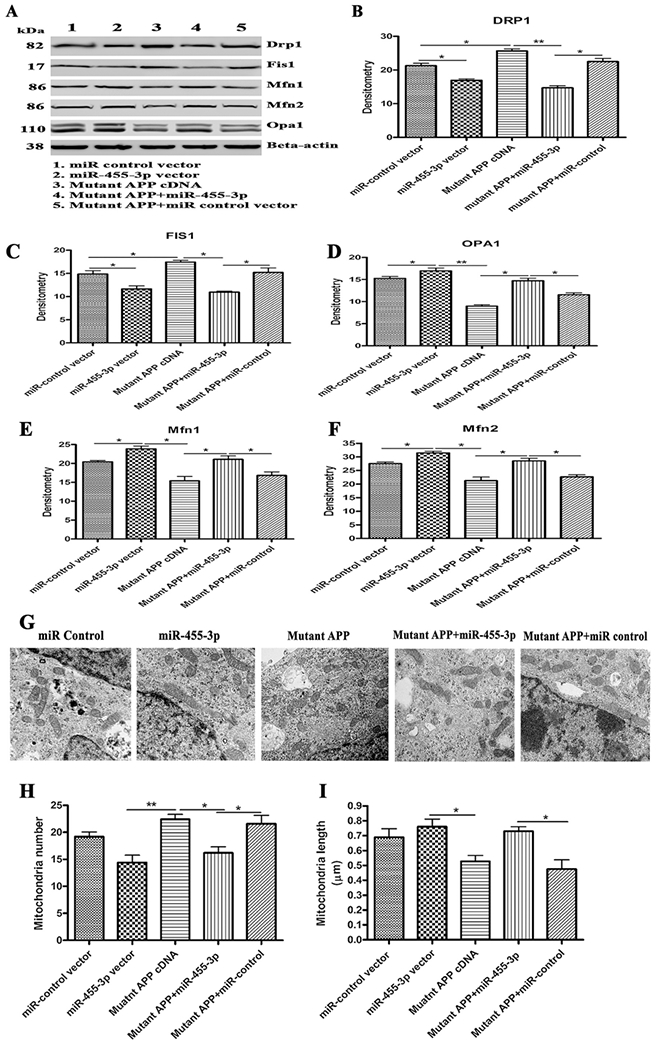
(A) Representative western blot images for DRP1, FIS1, OPA1, Mfn1, Mfn2 and beta-actin proteins levels in: 1) Neuroblastoma cells transfected with the miR-control vector, 2) Neuroblastoma cells transfected with the miR-455-3p expression vector, 3) Neuroblastoma cells transfected with the mutant APP cDNA, 4) Neuroblastoma cells co-transfected with the miR-455-3p and mutant APP cDNA, and 5) Neuroblastoma cells co-transfected with the mutant APP and miR-control vector. Quantitative measurement of the levels of (B) the DRP1, (C) FIS1, (D) OPA1, (E) Mfn1 and (F) Mfn2 proteins using densitometry in the same groups of cells. (G) Representative TEM images of Neuroblastoma cells transfected with the miR-control vector, the miR-455-3p vector, mutant APP cDNA, co-transfected with mutant APP and miR-455-3p, and co-transfected with mutant APP and miR-control, showing mitochondrial organization (600 nm magnification). (H) Quantification of the number of mitochondria in the Neuroblastoma cells transfected with miR-control vector, the miR-455-3p vector, mutant APP cDNA, co-transfected with mutant APP and miR-455-3p, and co-transfected with mutant APP and miR-control. (I) Quantification of the size of mitochondria (μm) in the neuroblastoma cells transfected with miR-control vector, the miR-455-3p vector, mutant APP cDNA, co-transfected with mutant APP and miR-455-3p, and co-transfected with mutant APP and miR-control. (*P<0.05) (**P<0.01).
3.9. Effect of miR-455-3p on mitochondrial morphology
We also studied mitochondrial number and length in mutant APP cells transfected with miR-455-3p in order to determine the effect of miR-455-3p on mitochondrial morphology. As shown in Figures 5G increased numbers of mitochondria were found in cells transfected with mutant APP cDNA relative to miR-control vector transfected cells, indicating that mutant APP, fragments mitochondria. However, significantly reduced numbers of mitochondria were found in cells co-transfected with miR-455-3p and mutant APP relative to cells transfected with mutant APP alone (Figure 5H).
Conversely, the mitochondrial length was decreased in the mutant APP cells, whereas, cells co-transfected with miR-455-3p and mutant APP cDNA showed increased in mitochondrial length compared to mutant APP cells alone (Figures 5I). Taken together, these analyses confirmed that miR-455-3p had the potential to control and/or repair the abnormal mitochondrial dynamics caused by toxic effects of mutant APP.
4. Discussion
Despite tremendous progress have been made in understanding the mechanisms of disease progression of AD and efforts in clinical trials aimed at finding treatments to prevent disease progression, AD is still an untreated disease. However, researchers remain optimistic that treatments and biomarkers can be developed. Recently, several miRNAs have been identified in order to determine early detectable peripheral biomarkers. Because of their small size, stability, and endogenous nature, miRNAs could be an ideal treatment option to control AD. Several miRNAs have been tested as therapeutic candidates against AD, and clinical trials are underway [25, 35].
The current study is devoted to research efforts targeting miR-455-3p as one of the therapeutic candidates for persons with AD. We have unveiled the therapeutic potential for miR-455-3p through the modulation of the APP processing. Additionally, we have found that miR-455-3p promote cell survival and activates synaptic genes, also indicating that miR-455-3p may have a protective role in AD pathogenesis through the modulation of defective mitochondrial biogenesis and mitochondrial dynamics.
Our initial transfection experiments of miR-455-3p mimics offer important clues about their protective roles in cell growth and survival. Our findings were parallel with Zhang and colleagues’ study [36], who found that miR-455-3p promotes cell survival and protects osteoblasts from oxidative stress by activating Nrf2/ARE signaling via targeting HDCA2. Similar observations were reported in studies of pancreatic, breast cancers, where miR-455-3p affected the TAZ protein and EI24 protein respectively, and promote cell proliferation [37, 38]. Therefore, miR-455-3p may have a crucial role in the regulation of cell survival through the regulation of different genes. Our bioinformatics analysis showed that miR-455-3p targets several other genes (e.g., BAX, BMF, TGFBR3L, and HIF1 [http://targetscan.org]) that have important roles in apoptotic pathways. However, in current study, our main focus was on the regulation of APP processing by miR-455-3p, and how it overcomes the toxic effect of mutant APP on cell survival, mitochondrial biogenesis, mitochondrial dynamics, and synaptic activity.
The two constitutive binding sites of miR-455-3p at the 3’UTR region of the APP gene provides better regulation and modulation of miRNA moieties. Overexpression of miR-455-3p in mutant APP cells, significantly reduced the levels of mutant full-length APP and Aβ(1-40) & Aβ(1-42). These findings strongly suggest that miR-455-3p is a potential candidate to treat AD. In our study, we used a mutant APP cDNA construct that robustly expressed the human mutant APP protein in HT22 cells [32]. We found that an overexpression of mutant APP, causes mitochondrial, synaptic, and autophagy/mitophagy abnormalities in hippocampal neurons, in addition to reduced cell survival, leading to neuronal dysfunction [32]. mRNA levels of APP were significantly increased (2745-fold) in mutant APP cDNA transfected cells. Despite this huge increase, miR-455-3p was capable of efficiently suppress the toxic effect of mutant APP on cell survival, mitochondrial biogenesis/dynamics, and synaptic activity. We also found that miR-455-3p not only interact and modulate full-length APP levels, but also suppress C99 fragment of APP, which is responsible for the generation of Aβ(1-40) and Aβ(1-42) peptides [39].
We also identified a supportive role of miR-455-3p in mitochondrial biogenesis, consistent with Zhang et al. (2015), who reported that miR-455 regulates brown adipogenesis via a novel HIF1an-AMPK-PGC1α signaling network [40]. Our lab confirmed that overexpression of the mutant APP cDNA caused the suppression of PGC1α and other mitochondrial biogenesis genes [36]. In the present study, we found that over-expression of miR-455-3p not only increased PGC1α but also increased the expression of their downstream effector genes NRF-1, NRF-2, and TFAM. Therefore, it is expected that upregulation of mitochondrial biogenesis events eventually improved the overall mitochondrial functions. These findings were supported by our electron microscopic analysis of neuroblastoma cells transfected with mutant APP cDNA and miR-455-3p, miR-455-3p was associated with an increase in mitochondrial length and a decrease in the number of mitochondria number. Further, analysis of mitochondrial dynamics proteins showed the suppression of fission protein (DRP1 and FIS1) and upregulation of fusion proteins (OPA1, Mfin1, and Mfn2) by miR-455-3p. Based on these observations, we conclude that overexpression of miR-455-3p maintain the normal mitochondrial activity by reducing the toxic effects of Aβ on mitochondria.
Additionally, the upregulation of the key synaptic genes synaptophysin and PSD95 in presence of miR-455-3p provides the new evidence that miR-455-3p have a role in the regulation of synaptic activity. We strongly believe that miR-455-3p expressed in neurons. The improved cell survival and extended dendrites in miR-455-3p overexpressing cells, further supports its possible role in the neuronal proliferation. To the best of our knowledge, ours is the first study to describe that miR-455-3p has significant role progression and pathogenesis in AD. However, further research is still needed to understand the underlying mechanism(s), how miR-455-3p involved in the regulation of synaptic plasticity.
To understand the impact of miR-455-3p in the brain, it is important to create overexpressed (transgenic) and/or (depleted) knockout mouse models for miR-455-3p and characterize these mouse models. And it is equally important to cross these transgenic and knockout lines of miR-455-3p mice with different mutant APP mice (APP - Tg2576), APP/PS1, 5×FAD and others) and study abnormal APP processing, C-terminal fragments such as C83 & C99, Aβ levels and mitochondrial biogenesis, mitochondrial dynamics and synaptic activities in double mutant mice (Tg miR455-3p × APP Tg mice; KO miR455-3p × APP Tg mice) relative to APP Tg mice alone.
In summary, miR-455-3p increases cell survival and promotes cell proliferation, and overexpression of miR-455-3p dramatically decreases full-length APP expression, the C-terminal fragment of APP and reduces Aβ(1-40) and Aβ(1-42) levels. Further, increased levels of miR-455-3p also increase mitochondrial biogenesis, mitochondrial fusion, and synaptic genes. These findings suggest the negative role of miR-455-3p in abnormal APP processing and its positive role in the regulation of mitochondrial biogenesis/dynamics and synaptic plasticity make it a valuable potential molecule worthy of research to identify AD therapy.
Supplementary Material
Highlights.
MiR-455-3p targets 3’UTR of Amyloid Precursor Protein (APP) gene
Over-expression of miR-455-3p increases cell viability and cell proliferation in mutant APP cells
High level of miR-455-3p regulates abnormal APP processing and Aβ production
MiR-455-3p suppresses mutant APP level and induces mitochondrial biogenesis events
MiR-455-3p improve synaptic activity in mutant APP cells and regulates healthy mitochondrial dynamics, fission and fusion proteins
Acknowledgments
Funding
The research presented in this article was supported by NIH grants AG042178, AG047812, and NS105473; the Garrison Family Foundation at Texas Tech University; the CH Foundation; and Alzheimer’s Association through a SAGA grant (to PHR). This research was also supported by the Alzheimer’s Association New Investigator Research Grant 2016-NIRG-39787, the Center of Excellence for Translational Neuroscience and Therapeutics (PN-CTNT20115-AR), and Alzheimer’s Association through a SAGA grant (to APR).
Footnotes
Publisher's Disclaimer: This is a PDF file of an unedited manuscript that has been accepted for publication. As a service to our customers we are providing this early version of the manuscript. The manuscript will undergo copyediting, typesetting, and review of the resulting proof before it is published in its final citable form. Please note that during the production process errors may be discovered which could affect the content, and all legal disclaimers that apply to the journal pertain.
Conflict of interest
Conflict of Interest: I would like to inform that we have a pending patent ‘MicroRNA-455-3p as a Potential Peripheral Biomarker for Alzheimer’s Disease (D-1417)’ related to the contents of our manuscript.
References
- 1.Selkoe DJ, Alzheimer’s disease: genes, proteins, and therapy, Physiol. Rev 81 (2001) 741–766. [DOI] [PubMed] [Google Scholar]
- 2.Mattson MP, Pathways towards and away from Alzheimer’s disease, Nature. 430 (2004) 631–639. [DOI] [PMC free article] [PubMed] [Google Scholar]
- 3.LaFerla FM, Green KN, Oddo S, Intracellular amyloid-beta in Alzheimer’s disease, Nat. Rev. Neurosci 8 (2007) 499–509. [DOI] [PubMed] [Google Scholar]
- 4.Reddy PH, Manczak M, Mao P, Calkins MJ, Reddy AP, Shirendeb U, Amyloid-beta and mitochondria in aging and Alzheimer’s disease: implications for synaptic damage and cognitive decline, J. Alzheimers Dis 20 (2010) S499–S512. [DOI] [PMC free article] [PubMed] [Google Scholar]
- 5.Mao P, Reddy PH, Aging and amyloid beta-induced oxidative DNA damage and mitochondrial dysfunction in Alzheimer’s disease: implications for early intervention and therapeutics, Biochim. Biophys. Acta 1812 (2011) 1359–1370. [DOI] [PMC free article] [PubMed] [Google Scholar]
- 6.Terry RD, Masliah E, Salmon DP, Butters N, DeTeresa R, Hill R, Hansen LA, Katzman R, Physical basis of cognitive alterations in Alzheimer’s disease: synapse loss is the major correlate of cognitive impairment, Ann. Neurol 30 (1991) 572–580. [DOI] [PubMed] [Google Scholar]
- 7.DeKosky ST, Scheff SW, Styrene SD, Structural correlates of cognition in dementia: quantification and assessment of synapse change, Neurodegeneration. 5 (1996) 417–421. [DOI] [PubMed] [Google Scholar]
- 8.Nunomura A, Perry G, Aliev G, Hirai K, Takeda A, Balraj EK, Jones PK, Ghanbari H, Wataya T, Shimohama S, Chiba S, Atwood CS, Petersen RB, Smith MA, Oxidative damage is the earliest event in Alzheimer disease, J. Neuropathol. Exp. Neurol 60 (2001) 759–767. [DOI] [PubMed] [Google Scholar]
- 9.McGeer PL, McGeer EG, Inflammation, autotoxicity, and Alzheimer disease, Neurobiol. Aging. 22 (2001) 799–809. [DOI] [PubMed] [Google Scholar]
- 10.Reddy PH, Amyloid precursor protein-mediated free radicals and oxidative damage: implications for the development and progression of Alzheimer’s disease, J. Neurochem 96 (2006) 1–13. [DOI] [PubMed] [Google Scholar]
- 11.Reddy PH, Beal MF, Amyloid beta, mitochondrial dysfunction and synaptic damage: implications for cognitive decline in aging and Alzheimer’s disease, Trends Mol. Med 14 (2008) 45–53. [DOI] [PMC free article] [PubMed] [Google Scholar]
- 12.Manczak M, Mao P, Nakamura K, Bebbington C, Park B, Reddy PH, Neutralization of granulocyte macrophage colony-stimulating factor decreases amyloid beta 1–42 and suppresses microglial activity in a transgenic mouse model of Alzheimer’s disease, Hum. Mol. Genet 18 (2009) 3876–3893. [DOI] [PMC free article] [PubMed] [Google Scholar]
- 13.Du H, Guo L, Yan S, Sosunov AA, McKhann GM, Yan SS, Early deficits in synaptic mitochondria in an Alzheimer’s disease mouse model, Proc. Natl. Acad. Sci. USA. 107 (2010) 18670–18675. [DOI] [PMC free article] [PubMed] [Google Scholar]
- 14.Swerdlow RH, Brain aging, Alzheimer’s disease, and mitochondria, Biochim. Biophys. Acta 1812 (2011) 1630–1639. [DOI] [PMC free article] [PubMed] [Google Scholar]
- 15.Reddy PH, Tripathi R, Troung Q, Tirumala K, Reddy TP, Anekonda V, Shirendeb UP, Calkins MJ, Reddy AP, Mao P, Manczak M, Abnormal mitochondrial dynamics and synaptic degeneration as early events in Alzheimer’s disease: implications to mitochondria-targeted antioxidant therapeutics, Biochim. Biophys. Acta 1822 (2012) 639–649. [DOI] [PMC free article] [PubMed] [Google Scholar]
- 16.Zhu X, Perry G, Smith MA, Wang X, Abnormal mitochondrial dynamics in the pathogenesis of Alzheimer’s disease, J. Alzheimers Dis 33 (2013) S253–S262. [DOI] [PMC free article] [PubMed] [Google Scholar]
- 17.Reddy PH, Tonk S, Kumar S, Vijayan M, Kandimalla R, Kuruva CS, Reddy AP, A critical evaluation of neuroprotective and neurodegenerative MicroRNAs in Alzheimer’s disease, Biochem. Biophys. Res. Commun 483 (2017) 1156–1165. [DOI] [PMC free article] [PubMed] [Google Scholar]
- 18.Kumar S, Chawla YK, Ghosh S, Chakraborti A, Severity of hepatitis C virus (genotype-3) infection positively correlates with circulating microRNA-122 in patients sera, Dis. Markers. (2014) 435476. [DOI] [PMC free article] [PubMed] [Google Scholar]
- 19.Kumar S, Reddy PH, Are circulating microRNAs peripheral biomarkers for Alzheimer’s disease?, Biochim. Biophys. Acta 1862 (2016) 1617–1627. [DOI] [PMC free article] [PubMed] [Google Scholar]
- 20.Vijayan M, Reddy PH, Peripheral biomarkers of stroke: Focus on circulatory microRNAs, Biochim. Biophys. Acta 1862 (2016) 1984–1993. [DOI] [PMC free article] [PubMed] [Google Scholar]
- 21.Kumar S, Vijayan M, Reddy PH, MicroRNA-455-3p as a potential peripheral biomarker for Alzheimer’s disease, Hum. Mol. Genet 26 (2017) 3808–3822. [DOI] [PMC free article] [PubMed] [Google Scholar]
- 22.Williams J, Smith F, Kumar S, Vijayan M, Reddy PH, Are microRNAs true sensors of aging and cellular senescence?, Ageing Res. Rev 35 (2017) 350–363. [DOI] [PMC free article] [PubMed] [Google Scholar]
- 23.Reddy PH, Williams J, Smith F, Bhatti JS, Kumar S, Vijayan M, Kandimalla R, Kuruva CS, Wang R, Manczak M, Yin X, Reddy AP, MicroRNAs, Aging, Cellular Senescence, and Alzheimer’s Disease, Prog. Mol. Biol. Transl. Sci 2017;146:127–71. [DOI] [PubMed] [Google Scholar]
- 24.Vijayan M, Kumar S, Yin X, Zafer D, Chanana V, Cengiz P, Reddy PH, Identification of novel circulatory microRNA signatures linked to patients with ischemic stroke, Hum. Mol. Genet 27 (2018) 2318–2329. [DOI] [PMC free article] [PubMed] [Google Scholar]
- 25.Zhao J, Yue D, Zhou Y, Jia L, Wang H, Guo M, Xu H, Chen C, Zhang J, Xu L, The Role of MicroRNAs in Aβ Deposition and Tau Phosphorylation in Alzheimer’s Disease, Front. Neurol 8 (2017) 342. [DOI] [PMC free article] [PubMed] [Google Scholar]
- 26.Vilardo E, Barbato C, Ciotti M, Cogoni C, Ruberti F, MicroRNA-101 regulates amyloid precursor protein expression in hippocampal neurons, J. Biol. Chem 285 (2010) 18344–18351. [DOI] [PMC free article] [PubMed] [Google Scholar]
- 27.Long JM, Lahiri DK, MicroRNA-101 downregulates Alzheimer’s amyloid-β precursor protein levels in human cell cultures and is differentially expressed, Biochem. Biophys. Res. Commun 404 (2011) 889–895. [DOI] [PMC free article] [PubMed] [Google Scholar]
- 28.Kim J, Yoon H, Horie T, Burchett JM, Restivo JL, Rotllan N, Ramirez CM, Verghese PB, Ihara M, Hoe HS, Esau C, Femandez-Hemando C, Holtzman DM, Cirrito JR, Ono K, Kim J, microRNA-33 Regulates ApoE Lipidation and Amyloid-β Metabolism in the Brain, J. Neurosci 35 (2015) 14717–14726. [DOI] [PMC free article] [PubMed] [Google Scholar]
- 29.Ma X, Liu L, Meng J, MicroRNA-125b promotes neurons cell apoptosis and Tau phosphorylation in Alzheimer’s disease, Neurosci. Lett 661 (2017) 57–62. [DOI] [PubMed] [Google Scholar]
- 30.Long JM, Maloney B, Rogers JT, Lahiri DK, Novel upregulation of amyloid-β precursor protein (APP) by microRNA-346 via targeting of APP mRNA 5′-untranslated region: Implications in Alzheimer’s disease, Mol. Psychiatry. 3 (2019) 345–363. [DOI] [PMC free article] [PubMed] [Google Scholar]
- 31.Kumar S, Reddy PH, MicroRNA-455-3p as a Potential Biomarker for Alzheimer’s Disease: An Update, Front. Aging Neurosci 10 (2018) 41. [DOI] [PMC free article] [PubMed] [Google Scholar]
- 32.Reddy PH, Yin X, Manczak M, Kumar S, Pradeepkiran JA, Vijayan M, Reddy AP, Mutant APP and amyloid beta-induced defective autophagy, mitophagy, mitochondrial structural and functional changes and synaptic damage in hippocampal neurons from Alzheimer’s disease, Hum. Mol. Genet 27 (2018) 2502–2516. [DOI] [PMC free article] [PubMed] [Google Scholar]
- 33.Reddy PH, Manczak M, Yin X, Grady MC, Mitchell A, Kandimalla R, Reddy AP, Protective effects of a natural product, curcumin, against amyloid β induced mitochondrial and synaptic toxicities in Alzheimer’s disease, J. Investig. Med 64 (2016) 1220–1234. [DOI] [PMC free article] [PubMed] [Google Scholar]
- 34.Manczak M, Kandimalla R, Fry D, Sesaki H, Reddy PH, Protective effects of reduced dynamin-related protein 1 against amyloid beta-induced mitochondrial dysfunction and synaptic damage in Alzheimer’s disease, Hum. Mol. Genet 25 (2016) 5148–5166. [DOI] [PMC free article] [PubMed] [Google Scholar]
- 35.Gupta P, Bhattacharjee S, Sharma AR, Sharma G, Lee SS, Chakraborty C, miRNAs in Alzheimer Disease - A Therapeutic Perspective, Curr. Alzheimer Res 14 (2017) 1198–1206. [DOI] [PubMed] [Google Scholar]
- 36.Zhang S, Wu W, Jiao G, Li C, Liu H, MiR-455-3p activates Nrf2/ARE signaling via HDAC2 and protects osteoblasts from oxidative stress, Int. J. Biol. Macromol 107 (2018) 2094–2101. [DOI] [PubMed] [Google Scholar]
- 37.Zhan T, Huang X, Tian X, Chen X, Ding Y, Luo H, Zhang Y, Downregulation of MicroRNA-455-3p Links to Proliferation and Drug Resistance of Pancreatic Cancer Cells via Targeting TAZ, Mol. Ther. Nucleic Acids. 10 (2018) 215–226. [DOI] [PMC free article] [PubMed] [Google Scholar]
- 38.Li Z, Meng Q, Pan A, Wu X, Cui J, Wang Y, Li L, MicroRNA-455-3p promotes invasion and migration in triple negative breast cancer by targeting tumor suppressor EI24, Oncotarget. 8 (2017) 19455–19466. [DOI] [PMC free article] [PubMed] [Google Scholar]
- 39.Multhaup G, Huber O, Buée L, Galas MC, Amyloid Precursor Protein (APP) Metabolites APP Intracellular Fragment (AICD), Aβ42, and Tau in Nuclear Roles, J. Biol. Chem 290 (2015) 23515–23522. [DOI] [PMC free article] [PubMed] [Google Scholar]
- 40.Zhang H, Guan M, Townsend KL, Huang TL, An D, Yan X, Xue R, Schulz TJ, Winnay J, Mori M, Hirshman MF, Kristiansen K, Tsang JS, White AP, Cypess AM, Goodyear LJ, Tseng YH, MicroRNA-455 regulates brown adipogenesis via a novel HIF1an AMPK-PGC1α signaling network, EMBO Rep 16 (2015) 1378–1393. [DOI] [PMC free article] [PubMed] [Google Scholar]
Associated Data
This section collects any data citations, data availability statements, or supplementary materials included in this article.