

Abstract
Purpose:
Rapid growth during infancy predicts higher risk of obesity later in childhood. The association between patterns of early life growth and later obesity may differ by race/ethnicity or socioeconomic status (SES), but prior evidence syntheses do not consider vulnerable subpopulations.
Methods:
We systemically reviewed published studies that explored patterns of early life growth (0-24 months of age) as predictors of later obesity (>24 months) that were either conducted in racial/ethnic minority or low-SES study populations or assessed effect modification of this association by race/ethnicity or SES. Literature searches were conducted in PubMed and SocINDEX.
Results:
Ten studies met inclusion criteria. Faster growth during the first 2 years of life was consistently associated with later obesity irrespective of definition and timing of exposure and outcome measures. Associations were strongest in populations composed of greater proportions of racial/ethnic minority and/or low-SES children. For example, ORs ranged from 1.17 (95% CI: 1.11, 1.24) in a heterogeneous population to 9.24 (95%CI: 3.73, 22.9) in an entirely low-SES non-white population.
Conclusions:
The impact of rapid growth in infancy on later obesity may differ by social stratification factors such as race/ethnicity and family income. More robust and inclusive studies examining these associations are needed.
Keywords: Overweight, Review [Publication Type], Infant, Weight Gain, Growth and Development, Ethnic Groups, Continental Population Groups, Socioeconomic Factors, Social Environment
INTRODUCTION
In the United States, 33.4% of children and adolescents are overweight and 26.1% are obese [1]. Disparities in obesity persist, with obesity prevalence as high as 33.4% and 31.5% in Black girls and Hispanic boys, respectively [1]. Further, obesity prevalence has increased by as much as 33% for children in low-education, low-income, and higher unemployment households [2]. Children with obesity are at greater risk of developing adverse health outcomes such as type 2 diabetes and metabolic syndrome [3]. As such, disparities in childhood obesity based on race, ethnicity, and socioeconomic status (SES) likely further contribute to health disparities in in adulthood.
Systematic reviews of over 25 studies suggest that faster growth in weight, length, relative weight, and adiposity during infancy are associated with elevated risk for obesity in childhood and beyond [4–9]. The study populations in these reviews are, naturally, those represented in most empirical studies on the topic: predominantly white race, and moderate- to high-SES subgroups or national SES profiles [4–9]. Social gradients are observed for obesity and obesity-related infant growth patterns [10], but few studies consider the degree to which infant growth patterns predict later obesity differentially by race/ethnicity or SES.
Differential associations by race/ethnicity or SES may result from interactions between prenatal and postnatal drivers of infant growth patterns. Maternal exposures – such as poor nutrition and environmental toxins – have been shown to modify fetal growth and gestational age at birth [11], both of which shape growth patterns in infancy and beyond [12]. Moreover, developmental alterations resulting from prenatal conditions may intensify responses to infant growth [10]. Minority race/ethnicity or lower SES mothers are not only disproportionately exposed to critical determinants of prenatal development -- poor nutrition [13], environmental toxins [14], and elevated stress levels [15] – but also face inadequate supports for healthy postnatal practices such as breastfeeding [19] due to inadequate work place breastfeeding policies [16].
We hypothesized that, as a result of differences in prenatal development and postnatal conditions, minority race/ethnicity or lower SES infants are more sensitive to variations in early life growth. The objective of this paper is to systematically review the epidemiologic literature regarding the association between patterns of early life growth and later obesity in racial/ethnic minority or low-SES subgroups in Western countries.
MATERIALS and METHODS
Literature search strategy
We conducted literature searches within PubMed and SocINDEX for published studies that examined early life growth as a predictor of later obesity in racial/ethnic minority or low-SES children. We applied search terms for concepts of (a) growth (e.g. weight gain, body mass index (BMI) trajectory), (b) early life (e.g. infant, newborn), (c) social divisions (e.g. race, ethnicity, SES), and (d) obesity or overweight. We also employed use of medical subject headings (MeSH) and text terms (Appendix A). Our search, conducted in April 2016, was restricted to papers published after January 1, 2000. This date was selected because general population studies on the topic first appeared around 2000, and papers featuring social subgroups followed. Further, our review of reference lists (described below) identified no relevant papers published prior to 2000.
Inclusion criteria
We included published English language papers of original observational studies that examined anthropometric measurements (e.g. weight, height, skin-fold thickness) at two or more time points between birth and 24 months, which were subsequently used to predict later obesity (>24 months). Our objective was to determine if the association between early life growth and later obesity differed by race/ethnicity or SES. While within-study comparisons were ideal for addressing this research question, the sparse state of the current literature in the field necessitated broadening our scope to include studies that focused on subgroups. As such, we included studies that (a) examined associations between early life growth and later obesity within racial/ethnic minority (any race/ethnicity other than non-Hispanic white) or low-SES (any indicator or proxy of low-SES e.g. low-income, low educational attainment, or unskilled occupation) study populations or (b) assessed effect modification of this association by social division (race/ethnicity, income, education, or a SES index or proxy measure) in broader populations. Due to our interest in growth within the context of the Western food environment, we only included studies examining early life growth that occurred in Western countries.
Review of candidate papers
Each paper found in the database search was independently examined by two members of the study team. Each study team member reviewed paper titles, and papers that were clearly outside the review topic were excluded. If the study title did not provide sufficient information to determine inclusion status, the abstract and then the full text were read. Discrepant determinations were resolved by a third reviewer. We used the same process to review studies listed in the reference lists of included papers.
Extraction and study characteristics
For each included paper, two reviewers independently extracted information pertaining to the study design and results. Extracted study characteristics included exposure and outcome definition and ascertainment, racial/ethnic and SES composition of the study population, covariates and modifying variables such as maternal BMI and feeding mode, and degree and management of study attrition (Appendix B).
Quality assessment
To assess each included study’s resiliency from bias, we employed a modified version of the NIH Quality Assessment Tool for Observational Cohort and Cross-sectional Studies (Appendix B; [17]). Two independent reviewers appraised each study for resiliency from bias and all studies met more than 60% of the quality parameters. Because our goal was to report the quality and make recommendations for future research, rather than synthesizing the data in a meta-analysis we included all studies. This study inclusion approach was consistent with the emerging nature of this research topic. The number of quality parameters met by each study can be found in Appendix C and the implications of unmet quality parameters are examined in the discussion.
RESULTS
Study selection
PubMed and SocINDEX searches identified 1677 unique articles (Figure 1). Of these, 1564 articles were excluded based on title or abstract, leaving 113 articles for full text review; nine were included. Review of reference lists yielded one article, for a total of 10 articles. The primary reasons for exclusion of abstracts were the absence of a measure of early life growth or the examination of early life growth as an outcome. The primary reason for exclusion of full text articles was the use of a population without restriction to, or examination of effect modification by, race/ethnicity or SES.
Figure 1.
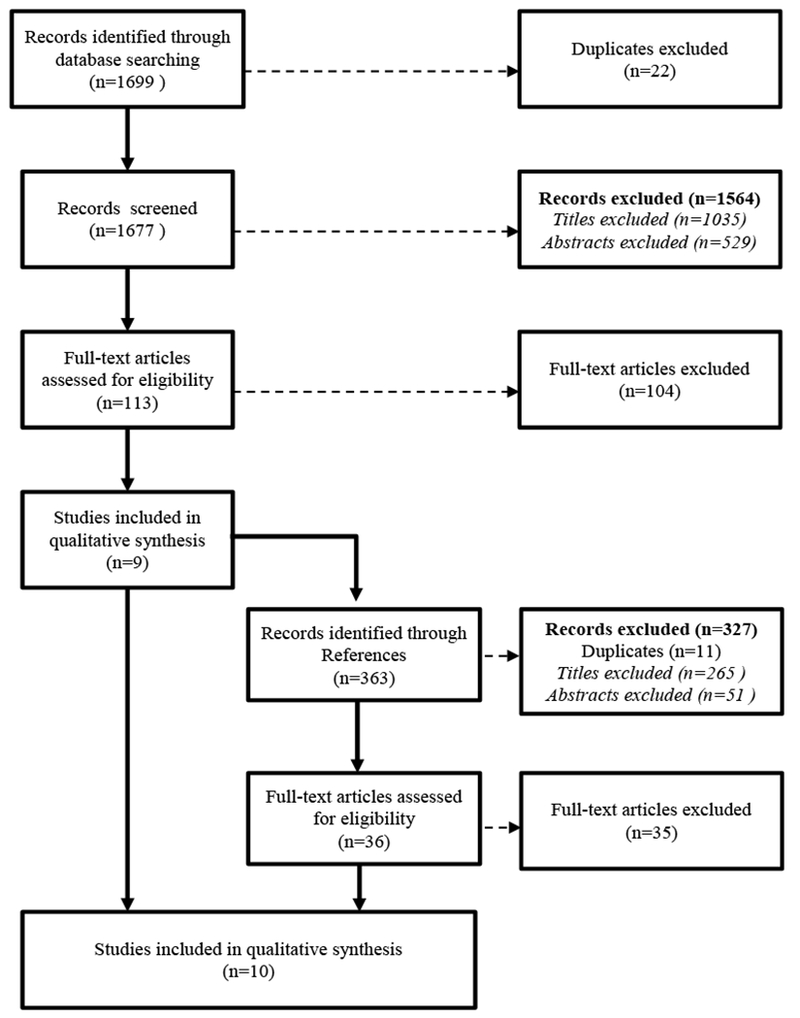
Selection of studies for inclusion in a systematic review of early life growth and later obesity by social divisions, 2000-2016
Study characteristics
With the exception of one German study [18], the studies examined US populations primarily sourced from urban Northeastern hospitals and clinics (Table 1). Studies examined eight unique cohorts of infants born from 1959 through 2010, though most cohorts were born between 1990 and 1999. The majority of studies focused on race/ethnicity or SES subgroups; only four studies involved within-study comparisons [18–21].
Table 1.
characteristics and social divisions examined in the reviewed studies
| First author, year [Reference] | Study name Location |
Setting | Sociodemographic Composition | N1 | Birth Years | Early Life Growth Interval | Obesity-related Outcome Ascertainment |
|---|---|---|---|---|---|---|---|
| Stettler, 2002 [20] |
National Collaborative Perinatal Project Boston, MA; Buffalo, NY; New Orleans, LA; Baltimore, MD; Richmond, VA; Minneapolis, MN; New York, NY; Portland, OR; Philadelphia, PA; Providence, RI ; Memphis, TN |
University Hospitals |
Race/Ethnicity •49% Black Median Maternal Education (range) •11 years (6-16 years) |
12277 | 1959-1965 | 2 d-5 mo 6-11 mo 2 d-11 mo 12-23 mo |
4-5 y |
| Stettler, 2003 [19] |
National Collaborative Perinatal Project, Philadelphia Blood Pressure Project Philadelphia, PA |
University Hospitals |
Race/Ethnicity • 100% Black Median Maternal Education (range) • 11 years (7-12 years) |
213 | 1962-1966 | 0-4 mo | 18.0-22.9 y |
| Okihiro, 2012 [23] | Rural Hawaii | Community Health Clinic |
Race/Ethnicity • 66% Native Hawaiian • 22% Samoan • 12% Filipino 76% of clinic families ≤200% FPL |
389 | 1981-1983 1986-1988 1991-1993 1996-1998 |
0-6 mo | 7 y |
| Karaolis-Danckert, 2008 [18] |
Multicenter Allergy Study (MAS-90) Germany (Berlin, Munich, Mainz, Dusseldorf, Freiburg) |
University Hospitals |
Race/Ethnicity2 • Unknown, predominantly Caucasian Parental Education2 • 45.3% <high school • 54.7% ≥High school/GED |
370 | 1990 | 0-24 mo | 2-6 y |
| Shankaran, 2010 [24] |
Maternal Lifestyle Study Providence, RI; Coral Gables, FL; Memphis, TN; Detroit, MI |
University Hospitals |
Race/Ethnicity • 81% Black • 7% Other Mean Maternal Education (SD) • 11.7 years (2 years) |
880 | 1993-1995 | 0-4 mo | 9 y |
| Gaskins, 2010 [25] |
Maternal Lifestyle Study Providence, RI; Coral Gables, FL; Memphis, TN; Detroit, MI |
University Hospitals |
Race/Ethnicity • 80% Black • 3% Hispanic Mean SES, Hollingshead3 (SD) 29.8 (10.1) |
312 | 1993-1995 | 0-12 mo | 11 y |
| Dennison, 2006 [21] | New York, NY | WIC Clinics |
Race/Ethnicity • 31% Hispanic • 19% Non-Hispanic Black Education • 32% <high school • 42% High school/GED 100% low-income |
616 | 1994-1999 | 0-6 mo | 4 y |
| Goodell, 2009 [22] | Hartford, CT | Pediatric Primary Care Clinics & Major Hospitals |
Race/Ethnicity • 32% Black • 54% Hispanic • 4% other 85% Medicaid; 100% low-income |
203 | 1995-1995 and 1998-1999 |
0-4 mo 0-12 mo |
24-38 mo |
| Roy, 2015 [26] |
A Study of the Genetic Causes of Complex Pediatric Disorders Philadelphia, PA |
University Hospital & Satellite Primary Care Clinic |
Race/Ethnicity • 61% Black • 8% other 45% Medicaid |
635 | 2000-2010 | 7-≤408 d | 4 y |
| Karp, 2012 [27] | Brooklyn, NY | Resident Continuity Clinic |
Racial distribution of clinic families • 81% Black (primarily Afro-Caribbean) • 10% Hispanic • 2% Asian • 2% other 31% of clinic families <100% FPL |
154 | Not Defined | 0-3 mo 4-6 mo |
4-6 y |
Abbreviations: WIC, Women, Infants, and Children; mo, months; d, days; y, years; SES, Socioeconomic status; FPL, federal poverty level.
N analytic sample
Information retrieved from an alternative source. Education percentages based on infants in MAS-90 followed up at 1 year [47].
Four-factor index of SES, average score of 29 synonymous to social strata of semiskilled workers based [48].
Relationship between early life growth and later obesity
Overall, nine of the ten studies found that more rapid early life growth velocity was associated with a greater risk of later obesity (Table 2) or higher BMI (Table 3) (ranging from 25 months to 23 years). Study populations for eight studies were either low-SES [21,22] and/or completely [19,23] or mostly (69% to 93%; [22,24–27]) racial and/or ethnic minorities. These items were ascertained using electronic health record (EHR) data in four studies [22,23,26,27], and from maternal self-report surveys [18,21] or interviews [19,20,24,25] in six studies. Items were limited to standard classifications of race/ethnicity, income, and education. Additional facets of race/ethnicity such as language, migration status, and rurality were not reported. Associations between early life growth and later obesity ranged from moderate (OR: 1.17 [95% CI: 1.11, 1.24]; [20]) to strong (OR: 9.24 [95%CI: 3.73, 22.9]; [22]). Stronger associations tended to be in study populations with higher proportions of low-SES and nonwhite children; however, direct comparison was difficult due to differences in exposure definitions. In the four studies that performed tests for effect modification, no evidence of interaction was observed between early life growth and Black race [20], early life growth and Hispanic ethnicity [21], or early life growth and maternal education [18,19]. Interaction terms were not included in final models for these reports.
Table 2.
Summary of studies examining early life growth as a predictor of categorical overweight/obesity status, ranked by OR magnitude & direction
| First Author, Year [Reference] | Exposure1 |
Outcome Life Stage2 | OR (95% CI)3 | Social divisions |
Notable Exclusions | Strengths | Limitations | |||
|---|---|---|---|---|---|---|---|---|---|---|
| Definition | Period | Racial/Ethnic Minorities | Low Income | Low Parental Education | ||||||
| Goodell, 2009 [22] | Rapid Weight Gain | Birth to 12 mo | Toddler | Overweight: 2.06 (0.86,4.92) Obesity: 9.24 (3.73,22.91) |
90% | 100% | ND | • Examined two periods of early life growth | • Minimal adjustment for confounders • 61.6% missing data • Binary exposure • Two different non-consecutive birth cohorts |
|
| Stettler, 2003 [19] | Rapid Weight Gain | Birth to 4 mo | Young Adult |
Obesity: 3.39 (0.94,12.2) Overweight-overfat: 4.92 (1.32,18.3) |
100% | ND | ~50% | • Preterm • Post term • Multiple Births |
• Analytically examined interaction with education • Additional adjustment for important maternal factors • Only 29% missing data |
• Binary exposure |
| Okihiro, 2012 [23] | Severe Rapid Growth | 12 to 23 mo | Preschooler | Obese: 4.36 (1.85,10.27) | 100% | ND | ND | • Enrolled at mandatory pre-k assessment • Examined multiple periods of early life growth • Examined two tiers of rapid growth (moderate and severe) |
• Minimal adjustment for confounders • 32.7% missing data • Multiple non-consecutive birth cohorts; 17 year span |
|
| Gaskins, 2010 [25] | Weight change per month (g/mo) | Birth to 12 mo | Middle childhood |
Overweight: 1.61 (1.07,2.43) Obesity: 2.69 (1.80,4.00) |
88% | ND | ND | • Mothers that were: • Previously institutionalized • <18 years • Not fluent in English |
• Additional adjustment for important maternal factors • Recruited from multiple US regions • Special focus on preterm birth |
• 45.9% missing data |
| Dennison, 2006 [21] | Rate of weight gain (100g/mo) | Birth to 6 mo | Preschooler | At-risk for overweight: 1.41 (1.18,1.68) Overweight: 1.44 (1.35,2.21) |
88% | ND | ND | • Adopted and foster care children • Very low birth weight (<1800 g) |
• Did not exclude preterm, post term or multiple births • Analytically examined interaction with ethnicity |
• 55.3% missing data |
| Stettler, 2002 [20] | Rate of weight gain (100g/mo) | Birth to 6 mo | Middle childhood |
Overweight: 1.17 (1.11,1.24) | 49% | ND | ~50% | • Preterm • Post term • Multiple Births |
• Analytically examined interaction with race • Additional adjustment for important maternal factors • Recruited from multiple US regions |
• 40.2% missing data |
| Roy, 2015 [26] | Velocity to peak (kg/m2/mo) | 7 to ≤408 d4 | Preschooler | Obesity: 0.85 (0.10,7.20) | 69% | 45% | ND | • Preterm • Those with <6 weight measurements in 1st 408 days of life |
• Additional adjustment for important maternal factors • Allowed for early life growth durations unique to each individual • Examined additional components of early life growth: Infancy peak BMI and age at Infancy peak BMI |
• 40.9% missing data |
OR, Odds Ratio; BMI, Body Mass Index; mo, months; y, years; d, days;; ND, not defined; Ideal adjustment included studies that adjusted for at least sex, birth size, and socioeconomic status
All studies have at least one period of early life growth defined as starting between birth and 7 days of age;
Outcome childhood stage: Toddlers, 2-3y; Preschoolers, 3-5y; middle childhood, 6-11y; young teens, 12-14y; teenagers, 15-17y; young adult, 18-35y;[49]
OR corresponds to the most adjusted model presented. For those studies with multiple examined associations correspond to the greatest OR
Duration of early-life growth is based on each individuals age at peak BMI with mean±SD at 8.6 ± 1.4 months
Table 3.
Summary of 3 studies with continuous outcomes, ranked by effect size of β
| First Author, Year [Reference] | Exposure1 | Outcome | β (95% CI)3 | Social divisions | Notable Exclusions | Strengths | Limitations | ||||
|---|---|---|---|---|---|---|---|---|---|---|---|
| Definition | Period | Definition | Life Stage2 | Racial/Ethnic Minorities | Low Income | Low Parental Education | |||||
| Karp, 2012 [27] | Weight Change, 4th quartile <2.5 kg | 4 to 6 mo | Log() | Preschooler | 1.23 (1.07,1.39) | 95% | ND | ND | • Clinic serves a largely inner city immigrant population | • Minimal adjustment for confounders • BMI outcome not standardized to sex and age • % missing data unknown • Birth cohort and sociodemographics of target population undefined |
|
| Karaolis-Danckert, 2008 [18] | Rapid Weight Gain | Birth to 24 mo | BMI SDS trajectory | Toddler - Preschooler | ND, low | ND | 45.30% | • Preterm • Post term • Multiple Births • Low birth weight |
• Analytically examined interactions with education • Additional examination of effect modification and adjustment for important maternal factors • Only 28% missing data |
• Binary exposure | |
| Mother not overweight, not smoker | 0.954 | ||||||||||
| Mother not overweight, smoker | 1.104 | ||||||||||
| Mother overweight, not smoker | 1.014 | ||||||||||
| Mother overweight, smoker | 1.164 | ||||||||||
| Shankaran, 2010 [24] | Weight change per month (g/mo) | Birth to 4 BMI Middle | BMI | Middle Childhood | 88% | ND | ND | Mothers that were: • Previously institutionalized • <18 years • Not fluent in English |
• Additional adjustment for important maternal factors • Did not exclude preterm, isolated stronger association • Recruited from multiple US regions • Large prospective sample |
• 31% missing data | |
| Born preterm | 0.11 (0.05,0.17) | ||||||||||
| Born at term | 0.07 (0.01, 0.13) | ||||||||||
BMI, Body Mass Index; SDS: Standard Deviation Score; mo, months; y, years; d, days; ND, not defined; Ideal adjustment included studies that adjusted for at least sex, birth size, and socioeconomic status
All studies have at least one period of early life growth defined as starting between birth and 7 days of age;
Outcome childhood stage: Toddlers, 2-3y; Preschoolers, 3-5y; middle childhood, 6-11y; young teens, 12-14y; teenagers, 15-17y; young adult, 18-35y;[49]
β corresponds to the most adjusted model presented. For those studies with multiple examined associations correspond to the greatest β
Conditional estimates calculated using adjusted coefficients in Karaolis-Danckert (2008), Table 4[
Study design considerations
Timing.
The majority of studies (70%) focused on a single period of early life growth, capturing growth from birth to, by our definition, as late as 24 months. All studies defined early life growth as growth starting at birth (8 studies) or between 2 and 7 days (2 studies [23,26], with a median growth interval of 6 months (70% with periods of 12 months or shorter). Two studies examined a second period of growth between 4 and 12 months [23,27]. Subsequent obesity was ascertained as early as 25 months and as late as 23 years of age (Median: 4.75 years; 3 to 11 years in 90% of studies).
In our qualitative comparison of findings between studies, the strength and magnitude of the association between early life growth and later obesity did not vary based on period of early life growth. However, for the two studies that examined more than one period of growth, intervals that began at ages 4 to 12 months generated associations of greater strength and magnitude [23,27]. Similarly, the strength and magnitude of the association did not vary based on the age at which subsequent obesity was ascertained.
Classification.
Early life growth was typically characterized as the difference in weight or relative weight between two time points ([18–25,27]; Appendix C). Obesity was typically characterized by standardizing BMI and/or skinfold thickness relative to age- and sex-specific 2001 or 2005 CDC growth chart data, and subsequently categorized [19–23,25,26]. Associations were strongest in the three studies examining a binary indicator of rapid growth as a predictor of categorically-defined obesity [19,22,23]. However, comparison of magnitudes of association among exposure definitions was challenging due to vast differences in scaling of early life growth.
Covariates.
All studies met a minimum of 7 of the 12 quality criteria (Appendix C) and all but one [27] included minimal adjustment for sex, birth size, and SES. Four studies adjusted for breastfeeding during infancy [18,21] or fruit, vegetable, cereal and grain consumption during childhood (>24 months) [24,25] and one study adjusted for maternal substance use (e.g. tobacco; [24]). The effect measures for the relationship between early life growth and later obesity in these studies were attenuated compared to studies that did not adjust for these dietary and maternal substance use factors.
Other effect modifiers.
Associations between rapid infant growth and later obesity were stronger in infants born to mothers who smoked during pregnancy [18], were overweight prior to pregnancy [18], and who gave birth preterm [24].
Exclusion criteria.
Many studies excluded preterm births; associations between rapid infant growth and later obesity were particularly strong in studies that included births irrespective of gestational age [21–23,27] or restricted their sample to preterm births [24,25]. Similarly, infant growth-obesity associations were weaker in studies that excluded multiple births [18–20,24,25], non-biological mother-child pairs [21], and non-English speakers [24,25].
Missing data.
Missing data was the most frequent study quality issue in this review, with all 10 studies reporting greater than 20% missing data. Missingness was attributed to both attrition and incomplete data collection at a single time point. For example, of the 577 eligible infants in Gaskins et al.’s (2010) study, 11-year follow up data was available for 68% (n=393), and 79% (n=312) had complete data for the relevant covariates [25]. In our review, the study composed of the greatest concentration of minority race/ethnicity or lower SES individuals (32% Black, 54% Hispanic, 3% other race; 85% on Medicaid, 100% low-income; [17]) reported the highest amount of missing data (62%; Table 2) and the study with the lowest concentration of minority race/ethnicity or lower SES individuals (exact numbers undisclosed but largely ethnically German; [13]) reported the lowest amount of missing data (28%; Table 2).
DISCUSSION
In this systematic review of published studies on early life growth patterns and later obesity, we found that studies in populations with the highest concentrations of minority race/ethnicity or lower SES showed the strongest, most consistently positive associations. However, the available evidence is predominantly based on subgroup-specific populations with few studies that formally tested effect modification. This summary is based on 10 studies and approximately 15,000 individuals observed since birth.
This study expanded on previous reviews [4–6] by assessing the relationship between early life growth and later obesity within and across racial/ethnic and SES subgroups. As noted in most previous systematic reviews [4,5], meta-analyses was not possible due to the heterogeneity of exposure and outcome definitions. In one exception, Ong and Loos standardized the results of 15 studies, yielding a pooled adjusted odds ratio of 1.84 [6]. In our review, we observed consistency in the direction of the association between early life growth and later obesity irrespective of great inter-study variability, supporting the robustness of these associations.
Potential mechanisms
Reasons that associations between early life growth and later obesity are stronger in minority race/ethnicity or lower SES children are unknown, but could reflect SES or race/ethnic differences in prenatal development, differences in postnatal drivers of growth, or both.
Prenatal development.
Prenatal exposures – indicated by body size at birth, maternal tobacco use and social stature, or other metrics - by way of adverse developmental alterations, may influence associations between early life growth and later obesity in two ways. First, prenatal exposures such as maternal smoking may increase propensity for both rapid infant growth [28] and later obesity [29] through alterations to the fetal brain that lead to appetite and impulse control dysfunction [30,31]. That is, associations between early life growth and later obesity may reflect effects of, for example, smoking-induced prenatal perturbations, rather than early life growth per se. Given that key prenatal exposures such as smoking and maternal obesity are most common in the lowest SES stratum [32], stronger associations between early life growth and later obesity in lower SES groups could reflect differential confounding by prenatal exposures. In our review, the association between early life growth and later obesity was stronger in studies that did not adjust for maternal pre-pregnancy weight or tobacco use [22,23].
Second, prenatal alterations may increase sensitivity to any causal effects of abnormal early life growth patterns [32]. For example, modified glucose and lipid metabolism [33] resulting from adverse prenatal conditions could intensify the impacts of rapid growth on long-term appetite and metabolic regulation. This mechanism is supported by findings that rapid infant growth is more strongly associated with obesity among infants with indicators of adverse prenatal conditions – preterm infants [24] and infants born to mothers who were overweight and/or smoked tobacco during pregnancy [18]. Gestational age at birth can be indicative of maternal exposure to elevated stress levels, poor nutrition, and exposure to environmental toxins [14], all more common in low-income women [13,15,34]. Preterm birth is strongly associated with maternal race and SES [35–37] and is a known risk factor for both rapid infant growth and later obesity [38].
Contributions of maternal exposures to race/ethnicity and/or SES-based differences in the association between early life growth and later obesity require further empirical testing. Further, parsing out the causal role of early life growth from the roles of prenatal drivers of postnatal growth requires expanding multi-disciplinary longitudinal intergenerational cohort study designs – that capture detailed high-quality data on the children, their parents, and potentially their grandparents [39] – to currently underrepresented minority race/ethnicity and lower SES populations [40].
Postnatal drivers of growth.
In our review, the association between early life growth and later obesity was attenuated in studies that adjusted for breastfeeding [18,21]. Infant feeding practices (e.g. breastfeeding, complementary feeding) are perhaps the most established determinants of early life growth [41]. Systemic barriers to meeting recommended breastfeeding practices - such as inadequate paid leave policies and inequitable wages - disproportionately affect the children of racial and ethnic minorities and individuals in lower socioeconomic classes [16]. As a result, infant feeding practices, or other socially patterned drivers of early life growth, may contribute to race/ethnicity and/or SES-based differences in the association between early life growth and later obesity.
Future research needs.
Understanding the mechanisms underlying the strong associations observed in socially disadvantaged populations is critical for designing early intervention strategies that target the most important drivers of obesity in our most disadvantaged children. In particular, further research is needed to disentangle and identify the specific prenatal and postnatal drivers and deterrents of obesity among racial/ethnic minority and low-SES children with special attention to maternal exposures, infant feeding practices, and the role of social policy.
Methodological challenges and implications for future research
Existing research on childhood obesity underrepresents the children most likely to be effected. Yet research in low-SES and racial/ethnic minority children poses several important challenges. These challenges may contribute to subgroup differences in associations between early life growth and later obesity, and limit the field’s ability to advance knowledge in early life determinants of obesity in minority race/ethnicity or lower SES children.
Population inclusivity.
The majority of existing studies of the association between early life growth and later obesity have been conducted in more affluent non-Hispanic white children. We report here evidence from the ten studies that consider the role of race/ethnicity and/or SES, only four of which included within study comparisons. Recruitment and enrollment is challenging in minority race/ethnicity or lower SES subgroups due to factors such as mistrust, language barriers, barriers due to low educational attainment, and competing demands between work and caretaking [42]. Two studies employing data from the Maternal Lifestyle Study had a remarkably low Latina inclusion rate relative to the target populations (e.g. <7% in the study population vs. up to 53.6% among residents of participating cities) [24,25,43], possibly reflecting language or other barriers to study participation. Participatory research approaches, ensuring key supports (e.g., provision of transport vouchers, waiver of clinic fees) [32,33], and provision of study materials in multiple languages [44] are critical for promoting participation in diverse populations. These costly but essential expenses require flexibility and accommodation by research funders.
Characterizing race, ethnicity, and SES.
Race, ethnicity, and SES were characterized broadly and unidimensionally. Additional facets of race/ethnicity, such as country of origin and language, were not reported in any of the eligible studies. This approach to characterization of these factors, while standard, can distort within-group differences that may be important to early life growth and the associations of interest. Different social forces may be operating in different ethnic minority groups, but these cannot be studied without collection of more detailed social factors. Similarly, with the exception of one study that accounted for marital status, education, employment status and occupational prestige in their measure of SES [25], income or education were used as imperfect proxies for SES. Moreover, the current body of literature on racial/ethnic minorities is largely limited to Black and Hispanic women and their children; Asians were underrepresented in eligible literature. Further, incomplete data collection contributed to a large proportion of missingness observed in this review; minority race/ethnicity and lower SES status are disproportionately more likely to be missing [49]. Importantly, EHR is increasingly used and valuable for providing rich longitudinal data on large cohorts, but race, ethnicity, and SES data are routinely captured unidimensionally and less completely in this data source. As such, initiatives that incentivize hospitals to improve their services and provide ample training and infrastructure to staff to accurately collect additional demographic information may be needed to provide critical support for both immediate patient care and future research [46].
Study duration.
Studying the relationship between early life growth and later obesity requires a cohort design of longer than two years in duration. Attrition is expected for any study of that length, but minority race/ethnicity or lower SES populations have higher loss to follow-up [23] than predominantly white and more affluent populations in both prospective and retrospective cohorts. Restriction of analyses to complete cases, as observed in most of the studies in this review, could lead to bias in outcome ascertainment or sample selection. In our review, associations between early life growth and later obesity were generally consistent irrespective of age at outcome ascertainment, suggesting that attrition bias was not a powerful driver of the associations in our review. However, advancing methods to improve study retention are critical in order to investigate later life outcomes, such as prediabetes and diabetes.
Exclusion of preterm births.
Forty percent of included studies restricted their analytic sample to term births [18–20,26]. Given the many common causes of preterm birth, low birth weight, and subsequent growth patterns, exclusion of preterm births could lead to selection bias, attenuating the association between early life growth and later obesity in race/ethnicity and/or SES subgroups. The statistically non-significant race/ethnicity or SES interaction results found in three studies that excluded preterm births [18–20] could reflect this bias. Our findings suggest that future studies on this topic consider including preterm and low birth weight infants as well as analytically testing for interaction by gestational age and birth weight.
Adjustment for potential mechanisms.
Four studies adjusted for breastfeeding status and childhood diet [18,21,24,25] and one study adjusted for maternal tobacco use [24], factors we postulate contribute to race/ethnicity and SES-based differences in the early life growth-later obesity association. The attenuated relationship in these four studies compared to studies that did not adjust for infant feeding or childhood diet is consistent with this hypothesis. The decision to adjust for these factors in future studies comparing race/ethnicity and SES subgroups should explicitly consider the question of interest. Early life-later obesity associations adjusted for these potential mechanisms reflect the estimated effect of early life growth on obesity, independent of the examined mechanisms. Associations adjusted for all hypothesized mechanisms, for example, reflect the biologic effects of rapid growth during infancy. Associations adjusted for one or more selected mechanisms reflect the residual association not explained by the included mechanisms, perhaps to identify additional mechanisms. In contrast, associations not adjusted for primal drivers of growth provides the overall estimated effect of early life growth and its proximal drivers; this estimate is useful for estimating health benefits of promoting healthy growth through breastfeeding and other supports.
Conclusion
The relationship between more rapid early life growth and later obesity is strongest among racial/ethnic minority and/or low-SES individuals. Yet, clinical recommendations and public health guidelines for infant growth are largely informed by research findings from predominantly white and moderate-to-high SES populations. Further research to clarify subgroup differences in associations between early life growth and obesity and to understand the mechanisms driving these differences is necessary to inform policy for obesity prevention and the reduction of health disparities.
Acknowledgements:
The authors would like to acknowledge Laura Zeigen, MA, MLIS, MPH and Andrew Hamilton, MLS, MS for their guidance in the systematic review process. The project described was supported by the National Institute of Digestive Disorders and Nutrition K01DK102857 (JBH).
List of Abbreviations/Acronyms:
- SES
Socioeconomic Status
- BMI
Body Mass Index
Appendix A. Search terms
| Concept | Terms for Pubmed | Terms for SocINDEX |
|---|---|---|
| Growth | Search (“catch-up growth” OR “compensatory growth” OR “growth trajectory” OR “rapid growth” OR “Weight Gain”[Mesh] OR “Body Weight”[Mesh] OR “Adiposity”[Mesh] OR “Growth and Development”[Mesh] OR “weight gain” OR “body weight” OR “adiposity” OR “growth and development”) | Search (“catch-up growth” OR “compensatory growth” OR “growth trajectory” OR “rapid growth” OR “weight gain” OR “body weight” OR “adiposity” OR “growth and development”) |
| Early life | Search “Infant”[Mesh] or “early life” or “infan*” or “neonat*” or “newborn” or “postnatal” OR “early weight gain” | Search “early life” or “infan*” or “neonat*” or “newborn” or “postnatal” OR “early weight gain” |
| Social divisions | Search (“Ethnic Groups”[Mesh] OR “Continental Population Groups”[Mesh] OR “Socioeconomic Factors”[Mesh] OR “Health Status Disparities”[Mesh] OR “Residence Characteristics”[Mesh] OR “Social Environment”[Mesh] OR “Social Welfare”[Mesh] OR “inner-city” or “socioeconomic” or “race” or “ethnic*” or “income” or “social class” or “education” or “occupation”) | Search ( “inner-city” or “socioeconomic” or “race” or “ethnic*” or “income” or “social class” or “education” or “occupation”) |
| Obesity/overweight | Search (“Overweight”[Mesh] or “obes*” or “overweight” or “body mass index”) | Search (“obes*” or “overweight” or “body mass index”) |
| Excluding Locations | Search (“Africa”[Mesh] OR “Asia”[Mesh] OR “Indian Ocean Island”[Mesh] OR “Indonesia”[Mesh] OR “Japan”[Mesh] OR “Macau”[Mesh] OR “Mediterranean Islands”[Mesh] OR “Philippines”[Mesh] OR “Taiwan”[Mesh] OR “Caribbean Region”[Mesh] OR “Central America”[Mesh] OR “Gulf of Mexico”[Mesh] OR “Latin America”[Mesh] OR “South America”[Mesh]) | |
| Restrictions | Filters: Publication date from 2000/01/01 | |
Appendix B. Study extraction and quality assessment tool
| Reviewer | Click here to enter text. |
| First Author | Click here to enter text. |
| Year | Click here to enter text. |
| Journal | Click here to enter text. |
| Title | Click here to enter text. |
| Extraction Component | Details | |
|---|---|---|
| Study characteristics | ||
| Aim/objectives of study | Click here to enter text. | |
| Name (if established cohort) | Click here to enter text. | |
| Study inclusion criteria (e.g. singleton, AGA, healthy) | Click here to enter text. | |
| Recruitment procedures used | Click here to enter text. | |
| Geographic location (Be as specific as possible) | Click here to enter text. | |
| Participant characteristics | ||
| Overall Size (N=?) Analytic sample (N=?) Baseline (N=?) |
Click here to enter text. | |
| Birth year(s) | Click here to enter text. | |
| Social division composition (e.g. % black, % below FPL, WIC) | Click here to enter text. | |
| Setting (e.g. clinic, population) | Click here to enter text. | |
| Exposure and covariates | ||
| Exposure defined | Click here to enter text. | |
| Exposure ascertainment (e.g. linkage to EMR) | Click here to enter text. | |
| Exposure time points | Click here to enter text. | |
| (e.g. Birth to 6 months) | ||
| Adjusting covariates | Click here to enter text. | |
| Modifying variables (e.g., sex, race/ethnicity) | Click here to enter text. | |
| Outcome | ||
| Defined (e.g. Age/sex-specific BMI of 85th percentile – 2000 CDC growth charts) | Click here to enter text. | |
| Age(s) at outcome | Click here to enter text. | |
| Analytic method | Click here to enter text. | |
|
Missing Data (e.g. how did they deal with missing data, what proportion missing, etc) |
Click here to enter text. | |
|
Results (e.g. ORs, RRs, beta coefficients) If subgroup analysis presented, reports for each subgroup If available, present crude and adjusted. |
Click here to enter text. | |
| Notes | Click here to enter text. | |
| Criteria | Yes | No | Other* | Notes |
|---|---|---|---|---|
| 1. Research question or objective clearly stated | □ | □ | Choose an item. | Click here to enter text. |
| 2. Study Population clearly defined | □ | □ | Choose an item. | Click here to enter text. |
| 3. Participation rate of eligible persons at least 50% | □ | □ | Choose an item. | Click here to enter text. |
| 4. All subjects selected from the same or similar populations (including the same time period) | □ | □ | Choose an item. | Click here to enter text. |
| 5. Inclusion and exclusion criteria for being in the study pre-specified and applied uniformly to all participants | □ | □ | Choose an item. | Click here to enter text. |
| 6. Exposures of interest were measured prior to the outcome being measured | □ | □ | Choose an item. | Click here to enter text. |
| 7. For exposures that can vary in amount or level, the study examined different levels of the exposure as related to the outcome (e.g., categories of exposure, or exposure measured as continuous variable) | □ | □ | Choose an item. | Click here to enter text. |
| 8. Exposure measures (independent variables) were clearly defined, valid, reliable, and implemented consistently across all study participants | □ | □ | Choose an item. | Click here to enter text. |
| 9. Outcome measures (dependent variables) were clearly defined, valid, reliable, and implemented consistently across all study participants | □ | □ | Choose an item. | Click here to enter text. |
| 10. Loss to follow-up after baseline was 20% or less | □ | □ | Choose an item. | Click here to enter text. |
| 11. Key potential confounding variables were measured and adjusted statistically for their impact on the relationship between exposure(s) and outcome(s) |
□ | □ | Choose an item. | Click here to enter text. |
CD, cannot determine; NA, not applicable; NR, not reported
Appendix C. Supplemental Table
Table 4.
Study design details
| First author, year | Exposure Definition Period | Outcome Definition Age at Ascertainment | Exclusions | Control Variables | N1 | Proportion of Baseline Included in Analysis, % | Result | No. of Quality Criteria Met2 |
|---|---|---|---|---|---|---|---|---|
| Dennison, 2006 | Rate of weight gain (100g/mo) Birth to 6 months |
BMI ≥ 85th (at-risk for overweight) & BMI ≥ 95th (overweight) age and sex-specific-percentiles4 4 years |
(1) birth weight<1800 grams (2) Breast fed >1 day but <1 month (3) <2 follow-up measurements |
Model 1: Ethnicity, birth weight, sex, breast-feeding history | 616 | 44.7% |
OR (95% CI) At-risk for overweight: 1.43 (1.27,1.60) Overweight: 1.44 (1.26,1.65) |
8 |
| Model 2: Model 1 + maternal BMI | 276 | 20.0% |
OR (95% CI) At-risk for overweight: 1.41 (1.18,1.68) Overweight: 1.44 (1.35,2.21) |
|||||
| Gaskins, 2010 | Weight change per month (g/mo) Birth to 12 months |
BMI ≥ 85th (overweight) & BMI ≥ 95th (obese) age and sex-specific-percentiles4 11 years |
(1) age <18yrs (2) history psychosis or institutionalization for retardation or emotional problems (3) language barriers (4) multiple gestation (5) birthweight <501g (6) gestational age ≥37wks (7) low infant survivability (8) maternal intent to move out of catchment area (9) chromosomal abnormality (10) toxoplasmosis, other agents, rubella, cytomegalovirus, or herpes infection |
Model 1: Site, prepregnancy BMI, pregestational diabetic history, birth weight, sex, race/ethnicity, size for gestational age, exercise, television viewing, fruits and vegetable consumption, grain and cereal consumption. | 312 | 54.1% |
OR (95% CI) Overweight: 1.61 (1.07,2.43) Obese: 2.69 (1.80,4.00) |
9 |
| Goodell, 2009 | Rapid weight gain3 Birth to 4 months & Birth to 12 months |
85th≤BMI≤95th (overweight), 95th≤BMI<97th (obese), and BMI≥97th (extremely obese) age and sex-specific-percentiles5 24-38 months |
Records missing: (1) sex (2) birth weight (3) height and/or weight from same visit at 4 months, 1 years or between 24 and 38 months |
Model 1: Unadjusted | 203 | 38.4% |
OR (95% CI) Rapid weight gain birth to 4 months - Overweight: 2.49 (0.97,6.38) - Obese: 1.94 (0.89,4.21) Rapid weight gain birth to 12 months - Overweight: 2.06 (0.86,4.92) - Obese: 9.24 (3.73,22.91) |
7 |
| Model 2: Sex and birth weight | 203 | 38.4% |
OR (95% CI) Rapid weight gain birth to 12 months - Extremely obese: 11.7 (4.5,30.0) |
|||||
| Karaolis-Danckert, 2008 | Rapid weight gain3 Birth to 24 months |
Body fat % & BMI SDS Trajectories 2-6 years |
(1) multiple gestation (2) gestational age <37 weeks or >42 weeks (3) birth weight ≤2500 g (4) birth weight and length inappropriate-for-gestational age (5) systemic disease, growth disorders (eg, growth hormone deficiency), chromosomal or congenital abnormalities, or abnormalities of the heart, gastrointestinal tract, or urogenital tract; (6) incomplete information on breastfeeding status, maternal anthropometric measures, and in utero tobacco exposure |
Model 1: _Interaction between rapid weight gain and time | 370 | 72.0% |
β ± SE Body fat % -Rapid weight gain: 1.83±0.35 -Time*rapid weight gain: 0.10±0.13 BMI SDS Trajectories -Rapid weight gain: 0.91±0.10 -Time*rapid weight gain: −0.06±0.02 |
8 |
| Model 2: Model 1+ BMI SD score at birth, sex, gestational age group, in utero tobacco exposure, maternal overweight, interactions (in utero tobacco exposure*maternal overweight, rapid weight gain*in utero tobacco exposure, rapid weight gain*maternal overweight; time interactions with sex, in utero tobacco exposure, maternal overweight, bottle-feeding, season of birth, and rapid weight gain; 3-way interactions with time and rapid weight gain with: in utero tobacco exposure and maternal overweight) | 370 | 72.0% |
β ± SE Body fat % -Rapid weight gain: 1.71±0.41 -Rapid weight gain*in utero tobacco exposure: 0.12±0.72 -Rapid weight gain*maternal overweight: −0.34±0.81 -Time*rapid weight gain: −0.42 ± 0.15 -Time*rapid weight gain*in utero tobacco exposure: 0.78±0.28 -Time*rapid weight gain*maternal overweight: 1.01±0.30 BMI SDS Trajectories -Rapid weight gain: 1.07±0.13 -Time*rapid weight gain: −0.12±0.03 -Time*rapid weight gain*in utero tobacco exposure: 0.09±0.06 -Time*rapid weight gain*maternal overweight: 0.13±0.06 |
|||||
| Karp, 2012 | Weight change, quartiles Birth to 3 months & 4 to 6 months |
Mean Log-transformed BMI 4-6 years |
(1) Records missing birth data | Model 1: Sex, age, and birth weight | 154 | Unknown |
β ± SE Weight gain birth to 3 months - Unknown, not significant Weight gain 4 months to 6 months - <1.5 kg: 1.200 ± 0.09 - 1.5 to 1.9kg: 1.201 ± 0.08 - 1.9 to 2.5kg: 1.229 ± 0.09 - >2.5kg: 1.232 ± 0.08 |
7 |
| Okihiro, 2012 | Moderate or severe rapid growth7 2 days-5 months; 6-11 months; 2 days-11 months; 12-23 months |
BMI≤95th (obese) age and sex-specific-percentile4 4-5 years |
(1) Lived outside CHC zip code (2) Did not attend CHC for well-child care (3) Did not have pre-K assessment at CHC |
Model 1: Ethnicity, cohort, and sex | 389 | 67.3% |
OR (95% CI) Obese at 4-5 yrs Rapid weight gain 2 days-5months Moderate: 1.12 (0.61,2.10) Severe: 1.17 (0.62,2.21) Rapid weight gain 6-11 months Moderate: 1.03 (0.38,2.78) Severe: 1.33 (0.39,4.54) Rapid weight gain 2 days-11 months Moderate: 1.35 (0.76,2.38) Severe: 1.44 (0.79,2.62) Rapid weight gain 12-23 months Moderate: 2.20 (1.11,4.37) Severe: 4.36 (1.85,10.27) |
8 |
| Roy, 2015 | Velocity to peak BMI 7 to ≤408 days |
BMI ≥ 95th (Obese) age and sex-specific-percentile3 4 years |
(1) <6 biologically plausible length and weight measurements in first 408 days of life (2) <2 visits at any of the following age ranges (days): 0-88, 89-224, or 225-408 (3) <37 weeks gestation |
Model 1: Sex, race, birth weight, medicaid status, poverty prevalence, maternal gestational diabetes, smoking, ≥ 90th percentile of weight checks, magnitude of peak BMI, timing of peak BMI | 635 | 59.1% | OR (95% CI)Obese: 0.85 (0.10,7.20) | 10 |
| Shankaran, 2010 | Weight change per month (g/mo) Birth to 4 months |
BMI3 9 years |
(1) age <18yrs (2) history psychosis or institutionalization for retardation or emotional problems (3) language barriers (4) born at another hospital (5) multiple gestation (6) birthweight <501g (7) gestational age >42wks (8) attending physician judgment of low infant survivability (9) maternal intent to move out of catchment area (10) chromosomal abnormality (11) toxoplasmosis, other agents, rubella, cytomegalovirus, or herpes infection |
Model 1: Maternal race, education, and weight at delivery, prenatal exposures (cocaine, alcohol, tobacco, opiate, marijuana), clinic site, sex, birth weight, size for gestational age, factors at 9 years of age (exercise, hours watching TV on school days, calories consumed) | 880 | 69.9% |
For each g/mo increase in weight from birth to 4 months Full term babies BMI β ± SE: 0.07 ± 0.03 Pre-term babies BMI β ± SE: 0.11 ± 0.03 |
9 |
| Stettler, 2002 | Rate of weight gain (100g/mo) Birth to 6 months |
BMI ≥ 95th (overweight) age and sex-specific-percentile3 7 years |
(1) <37 or >42 weeks gestation (2) Multiple gestation |
Model 1: Site, age of child at assessment, birth weight (100g), gestational age (wks), sex, race (Black, white), first-born status, maternal BMI and education | 122 77 |
63.3% |
OR (95% CI) Overweight: 1.38 (1.32,1.44) |
8 |
| Model 2: Model 1 + weight at 1 year | 115 95 |
59.8% |
OR (95% CI) Overweight: 1.17 (1.11,1.24) |
|||||
| Stettler, 2003 | Rapid weight gain6 Birth to 4 months |
BMI>30 (obese) & BMI≥25 & skin-fold thickness ≥85th (overweight-overfat) percentile4 18.0-22.9 years |
(1) <37 or >42 weeks gestation (2) Multiple gestation (3) Follow up between age 18 and 23 years |
Model 1: Sex, birth weight, gestational age, firstborn status, birth year, maternal factors (BMI, age, smoking, education) | 213 | 71.0% |
OR (95%CI) Obese: 5.22 (1.55,17.6) Overweight-overfat: 6.72 (1.93,23.4) |
8 |
| Model 2: Model 1+ Overweight status at age 7 years | 213 | 71.0% |
OR (95%CI) Obese: 3.39 (0.94,12.2) Overweight-overfat: 4.92 (1.32,18.3) |
8 |
Abbreviations: BMI, Body Mass Index; SD, Standard Deviation; SDS, Sex- and age-independent SD scores; CHC, community health center; SES, Socioeconomic Status; WIC, Women, Infants, and Children;
N analytic sample ;
Modified version of the NIH Quality Assessment Tool for Observational Cohort and Cross-sectional Studies ([1]; Appendix B);
≥0.67 increase in weight-for-age z-scores SDs;
2000 CDC growth charts;
2005 CDC growth charts;
≥1 increase in weight-for-age z-scores SDs;
Waist for length Z score, moderate defined as ≥ 0.67 and <1.0 SD while severe is defined as ≥ 1.0 SD
Does not adjust for SES but sample restricted to only low SES
Footnotes
Publisher's Disclaimer: This is a PDF file of an unedited manuscript that has been accepted for publication. As a service to our customers we are providing this early version of the manuscript. The manuscript will undergo copyediting, typesetting, and review of the resulting proof before it is published in its final citable form. Please note that during the production process errors may be discovered which could affect the content, and all legal disclaimers that apply to the journal pertain.
REFERENCES
- [1].Skinner AC, Perrin EM, Skelton JA. Prevalence of obesity and severe obesity in US children, 1999-2014. Obesity 2016;24:1116–23. doi: 10.1002/oby.21497. [DOI] [PubMed] [Google Scholar]
- [2].Rogers R, Eagle TF, Sheetz A, Woodward A, Leibowitz R, Song M, et al. The Relationship between Childhood Obesity, Low Socioeconomic Status, and Race/Ethnicity: Lessons from Massachusetts. Child Obes 2015;11:691–5. doi: 10.1089/chi.2015.0029. [DOI] [PMC free article] [PubMed] [Google Scholar]
- [3].Daniels SR, Arnett DK, Eckel RH, Gidding SS, Hayman LL, Kumanyika S, et al. Overweight in children and adolescents: pathophysiology, consequences, prevention, and treatment. Circulation 2005;111:1999–2012. doi: 10.1161/01.CIR.0000161369.71722.10. [DOI] [PubMed] [Google Scholar]
- [4].Monteiro POA, Victora CG. Rapid growth in infancy and childhood and obesity in later life--a systematic review. Obes Rev 2005;6:143–54. doi: 10.1111/j.1467-789X.2005.00183.x. [DOI] [PubMed] [Google Scholar]
- [5].Baird J, Fisher D, Lucas P, Kleijnen J, Roberts H, Law C. Being big or growing fast: systematic review of size and growth in infancy and later obesity. BMJ 2005;331:929. doi: 10.1136/bmj.38586.411273.E0. [DOI] [PMC free article] [PubMed] [Google Scholar]
- [6].Ong KK, Loos RJF. Rapid infancy weight gain and subsequent obesity: systematic reviews and hopeful suggestions. Acta Paediatr 2006;95:904–8. doi: 10.1080/08035250600719754. [DOI] [PubMed] [Google Scholar]
- [7].Chomtho S, Wells JC, Williams JE, Davies PS, Lucas A, Fewtrell MS. Infant growth and later body composition: evidence from the 4-component model. Am J Clin Nutr 2008;87:1776–84. [DOI] [PubMed] [Google Scholar]
- [8].McCarthy A, Hughes R, Tilling K, Davies D, Smith GD, Ben-Shlomo Y. Birth weight; postnatal, infant, and childhood growth; and obesity in young adulthood: evidence from the Barry Caerphilly Growth Study. Am J Clin Nutr 2007;86:907–13. [DOI] [PubMed] [Google Scholar]
- [9].Stettler N, Iotova V. Early growth patterns and long-term obesity risk: Current Opinion in Clinical Nutrition and Metabolic Care 2010;13:294–9. doi: 10.1097/MCO.0b013e328337d7b9. [DOI] [PubMed] [Google Scholar]
- [10].Boone-Heinonen J, Messer L, Andrade K, Takemoto E. Connecting the Dots in Childhood Obesity Disparities: A Review of Growth Patterns from Birth to Pre-Adolescence. Curr Epidemiol Rep 2016;3:113–24. doi: 10.1007/s40471-016-0065-9. [DOI] [PMC free article] [PubMed] [Google Scholar]
- [11].Godfrey KM, Inskip HM, Hanson MA. The long-term effects of prenatal development on growth and metabolism. Semin Reprod Med 2011;29:257–65. doi: 10.1055/s-0031-1275518. [DOI] [PMC free article] [PubMed] [Google Scholar]
- [12].Fenton TR, Chan HT, Madhu A, Griffin IJ, Hoyos A, Ziegler EE, et al. Preterm Infant Growth Velocity Calculations: A Systematic Review. Pediatrics 2017;139:e20162045. doi: 10.1542/peds.2016-2045. [DOI] [PubMed] [Google Scholar]
- [13].Food Research & Action Center. Why Low-Income and Food-Insecure People are Vulnerable to Poor Nutrition and Obesity. Washington, D.C.: 2017. [Google Scholar]
- [14].Murphy DJ. Epidemiology and environmental factors in preterm labour. Best Pract Res Clin Obstet Gynaecol 2007;21:773–89. doi: 10.1016/j.bpobgyn.2007.03.001. [DOI] [PubMed] [Google Scholar]
- [15].Kessler RC, Cleary PD. Social Class and Psychological Distress. American Sociological Review 1980;45:463–78. doi: 10.2307/2095178. [DOI] [PubMed] [Google Scholar]
- [16].Aitken Z, Garrett CC, Hewitt B, Keogh L, Hocking JS, Kavanagh AM. The maternal health outcomes of paid maternity leave: A systematic review. Social Science & Medicine 2015;130:32–41. doi: 10.1016/j.socscimed.2015.02.001. [DOI] [PubMed] [Google Scholar]
- [17].Quality Assessment Tool for Observational Cohort and Cross-Sectional Studies - NHLBI, NIH n.d. http://www.nhlbi.nih.gov/health-pro/guidelines/in-develop/cardiovascular-risk-reduction/tools/cohort (accessed August 15, 2016).
- [18].Karaolis-Danckert N, Buyken AE, Kulig M, Kroke A, Forster J, Kamin W, et al. How pre- and postnatal risk factors modify the effect of rapid weight gain in infancy and early childhood on subsequent fat mass development: results from the Multicenter Allergy Study 90. Am J Clin Nutr 2008;87:1356–64. [DOI] [PubMed] [Google Scholar]
- [19].Stettler N, Kumanyika SK, Katz SH, Zemel BS, Stallings VA. Rapid weight gain during infancy and obesity in young adulthood in a cohort of African Americans. Am J Clin Nutr 2003;77:1374–8. [DOI] [PubMed] [Google Scholar]
- [20].Stettler N, Zemel BS, Kumanyika S, Stallings VA. Infant weight gain and childhood overweight status in a multicenter, cohort study. Pediatrics 2002;109:194–9. [DOI] [PubMed] [Google Scholar]
- [21].Dennison BA, Edmunds LS, Stratton HH, Pruzek RM. Rapid infant weight gain predicts childhood overweight. Obesity (Silver Spring) 2006;14:491–9. doi: 10.1038/oby.2006.64. [DOI] [PubMed] [Google Scholar]
- [22].Goodell LS, Wakefield DB, Ferris AM. Rapid weight gain during the first year of life predicts obesity in 2-3 year olds from a low-income, minority population. J Community Health 2009;34:370–5. doi: 10.1007/s10900-009-9164-6. [DOI] [PubMed] [Google Scholar]
- [23].Okihiro M, Davis J, White L, Derauf C. Rapid growth from 12 to 23 months of life predicts obesity in a population of Pacific Island children. Ethn Dis 2012;22:439–44. [PMC free article] [PubMed] [Google Scholar]
- [24].Shankaran S, Bann C, Bauer CR, Lester B, Bada H, Das A, et al. Prenatal Cocaine Exposure and Body Mass Index and Blood Pressure at 9 Years of Age. J Hypertens 2010;28:1166–75. [PMC free article] [PubMed] [Google Scholar]
- [25].Gaskins RB, LaGasse LL, Liu J, Shankaran S, Lester BM, Bada HS, et al. Small for Gestational Age and Higher Birth Weight Predict Childhood Obesity in Preterm Infants. Am J Perinatol 2010;27:721–30. doi: 10.1055/s-0030-1253555. [DOI] [PMC free article] [PubMed] [Google Scholar]
- [26].Roy SM, Chesi A, Mentch F, Xiao R, Chiavacci R, Mitchell JA, et al. Body mass index (BMI) trajectories in infancy differ by population ancestry and may presage disparities in early childhood obesity. J Clin Endocrinol Metab 2015;100:1551–60. doi: 10.1210/jc.2014-4028. [DOI] [PMC free article] [PubMed] [Google Scholar]
- [27].Karp RJ, Winkfield-Royster T, Weedon J. Relation of growth rate from birth to three months and four to six months to body mass index at ages four to six years. J Nutr Metab 2012;2012:158643. doi: 10.1155/2012/158643. [DOI] [PMC free article] [PubMed] [Google Scholar]
- [28].Monasta L, Batty GD, Cattaneo A, Lutje V, Ronfani L, Van Lenthe FJ, et al. Early-life determinants of overweight and obesity: a review of systematic reviews. Obes Rev 2010;11:695–708. doi: 10.1111/j.1467-789X.2010.00735.x. [DOI] [PubMed] [Google Scholar]
- [29].Sowan NA, Stember ML. Effect of maternal prenatal smoking on infant growth and development of obesity. J Perinat Educ 2000;9:22–9. doi: 10.1624/105812400X87734. [DOI] [PMC free article] [PubMed] [Google Scholar]
- [30].Toschke AM, Ehlin AGC, von Kries R, Ekbom A, Montgomery SM. Maternal smoking during pregnancy and appetite control in offspring. J Perinat Med 2003;31:251–6. doi: 10.1515/JPM.2003.034. [DOI] [PubMed] [Google Scholar]
- [31].Layte R, Bennett A, McCrory C, Kearney J. Social class variation in the predictors of rapid growth in infancy and obesity at age 3 years. Int J Obes 2014;38:82–90. doi: 10.1038/ijo.2013.160. [DOI] [PubMed] [Google Scholar]
- [32].Zheng H, Tumin D. Variation in the effects of family background and birth region on adult obesity: results of a prospective cohort study of a Great Depression-era American cohort. BMC Public Health 2015;15:535. doi: 10.1186/s12889-015-1870-7. [DOI] [PMC free article] [PubMed] [Google Scholar]
- [33].Marciniak A, Patro-Małysza J, Kimber-Trojnar Ż, Marciniak B, Oleszczuk J, Leszczyńska-Gorzelak B. Fetal programming of the metabolic syndrome. Taiwanese Journal of Obstetrics and Gynecology 2017;56:133–8. doi: 10.1016/j.tjog.2017.01.001. [DOI] [PubMed] [Google Scholar]
- [34].Evans GW, Kantrowitz and E. Socioeconomic Status and Health: The Potential Role of Environmental Risk Exposure. Annual Review of Public Health 2002;23:303–31. doi: 10.1146/annurev.publhealth.23.112001.112349. [DOI] [PubMed] [Google Scholar]
- [35].Goldenberg RL, Culhane JF, Iams JD, Romero R. Epidemiology and causes of preterm birth. The Lancet 2008;371:75–84. doi: 10.1016/S0140-6736(08)60074-4. [DOI] [PMC free article] [PubMed] [Google Scholar]
- [36].Morgen CS, Bjørk C, Andersen PK, Mortensen LH, Nybo Andersen A-M. Socioeconomic position and the risk of preterm birth--a study within the Danish National Birth Cohort. Int J Epidemiol 2008;37:1109–20. doi: 10.1093/ije/dyn112. [DOI] [PubMed] [Google Scholar]
- [37].Jansen PW, Tiemeier H, Jaddoe VWV, Hofman A, Steegers E a. P, Verhulst FC, et al. Explaining educational inequalities in preterm birth: the generation r study. Arch Dis Child Fetal Neonatal Ed 2009;94:F28–34. doi: 10.1136/adc.2007.136945. [DOI] [PubMed] [Google Scholar]
- [38].Thomas EL, Al Saud NB, Durighel G, Frost G, Bell JD. The effect of preterm birth on adiposity and metabolic pathways and the implications for later life. Clinical Lipidology 2012;7:275–88. doi: 10.2217/clp.12.32. [DOI] [Google Scholar]
- [39].Lawlor DA, Andersen A-MN, Batty GD. Birth cohort studies: past, present and future. Int J Epidemiol 2009;38:897–902. doi: 10.1093/ije/dyp240. [DOI] [PubMed] [Google Scholar]
- [40].Smid MC, Lee JH, Grant JH, Miles G, Stoddard GJ, Chapman DA, et al. Maternal race and intergenerational preterm birth recurrence. American Journal of Obstetrics and Gynecology n.d. doi: 10.1016/j.ajog.2017.05.051. [DOI] [PubMed] [Google Scholar]
- [41].Arevalos L The influence of exclusive breastfeeding on growth trajectory from birth to year 5 in a WIC cohort. Master’s Theses and Project Reports 2016. [Google Scholar]
- [42].George S, Duran N, Norris K. A Systematic Review of Barriers and Facilitators to Minority Research Participation Among African Americans, Latinos, Asian Americans, and Pacific Islanders. Am J Public Health 2013;104:e16–31. doi: 10.2105/AJPH.2013.301706. [DOI] [PMC free article] [PubMed] [Google Scholar]
- [43].United States Census Bureau. Quick Facts 2015. //www.census.gov/quickfacts/ (accessed October 25, 2016).
- [44].Sudore RL, Landefeld CS, Williams BA, Barnes DE, Lindquist K, Schillinger D. Use of a Modified Informed Consent Process among Vulnerable Patients: A Descriptive Study. J Gen Intern Med 2006;21:867–73. doi: 10.1111/j.1525-1497.2006.00535.x. [DOI] [PMC free article] [PubMed] [Google Scholar]
- [45].Klinger EV, Carlini SV, Gonzalez I, Hubert SS, Linder JA, Rigotti NA, et al. Accuracy of Race, Ethnicity, and Language Preference in an Electronic Health Record. J Gen Intern Med 2015;30:719–23. doi: 10.1007/s11606-014-3102-8. [DOI] [PMC free article] [PubMed] [Google Scholar]
- [46].Lee W-C, Veeranki SP, Serag H, Eschbach K, Smith KD. Improving the Collection of Race, Ethnicity, and Language Data to Reduce Healthcare Disparities: A Case Study from an Academic Medical Center. Perspect Health Inf Manag 2016;13. [PMC free article] [PubMed] [Google Scholar]
- [47].Grüber C, Keil T, Kulig M, Roll S, Wahn U, Wahn V, et al. History of respiratory infections in the first 12 yr among children from a birth cohort. Pediatr Allergy Immunol 2008;19:505–12. doi: 10.1111/j.1399-3038.2007.00688.x. [DOI] [PubMed] [Google Scholar]
- [48].Hollingshead A Four-factor index of social status 1975.
- [49].Centers for Disease Control and Prevention. Positive Parenting Tips. Child Development 2016. https://www.cdc.gov/ncbddd/childdevelopment/positiveparenting/ (accessed December 21, 2016).