

SUMMARY
Autophagy, a lysosomal degradation pathway, plays crucial roles in health and disease. p62/SQSTM1 (hereafter p62) is an autophagy adaptor protein that can shuttle ubiquitinated cargo for autophagic degradation. Here, we show that upregulating the Drosophila p62 homolog ref(2)P/dp62, starting in midlife, delays the onset of pathology and prolongs healthy lifespan. Midlife induction of dp62 improves proteostasis, in aged flies, in an autophagy-dependent manner. Previous studies have reported that p62 plays a role in mediating the clearance of dysfunctional mitochondria via mitophagy. However, the causal relationships between p62 expression, mitochondrial homeostasis, and aging remain largely unexplored. We show that upregulating dp62, in midlife, promotes mitochondrial fission, facilitates mitophagy, and improves mitochondrial function in aged flies. Finally, we show that mitochondrial fission is required for the anti-aging effects of midlife dp62 induction. Our findings indicate that p62 represents a potential therapeutic target to counteract aging and prolong health in aged mammals.
In Brief
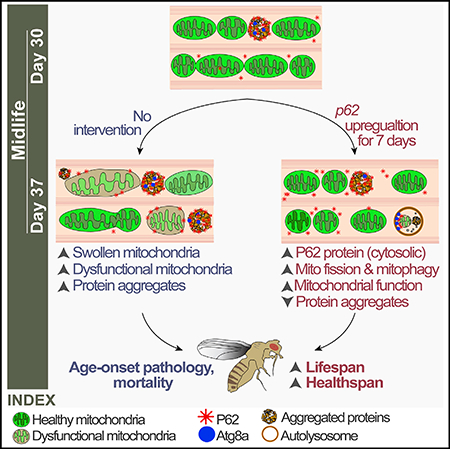
Autophagy has been proposed to promote longevity in diverse species, yet the underlying molecular mechanisms remain poorly understood. Using Drosophila, Aparicio et al. show that upregulating a prototypic autophagy receptor, p62/SQSTM1, from midlife onward slows aging and prolongs health span. Midlife p62 induction promotes mitochondrial fission and mitophagy to slow aging.
Graphical Abstract
INTRODUCTION
Loss of protein homeostasis (proteostasis) and mitochondrial dysfunction are two cellular hallmarks of aging, each of which has been proposed to contribute to age-related health decline (Kaushik and Cuervo, 2015; Sun et al., 2016). Therefore, identifying interventions that could improve proteostasis and/or mitochondrial function when targeted to aged animals could lead to treatments to forestall disease and promote healthy aging. Macroautophagy, hereafter autophagy, is a degradation pathway that plays key roles in development, tissue homeostasis, and disease pathogenesis (Levine and Kroemer, 2008). In this process, cellular materials (referred to as autophagic cargo) are sequestered by double-membrane vesicles known as autophagosomes (APs) and delivered to the lysosome for degradation (Feng et al., 2014). In recent years, autophagy, and more specifically a requirement for autophagy-related genes, has been implicated in genetic, dietary, and pharmacological interventions that extend lifespan in model organisms (Hansen et al., 2018). These findings support the idea that autophagy induction plays a causal role in these prolongevity paradigms. In addition, constitutively increasing basal levels of autophagy, by directly manipulating autophagy-related genes, has been reported to promote longevity in diverse species including mice (Fernández et al., 2018; Hansen et al., 2018; Lapierre et al., 2013; Pyo et al., 2013; Simonsen et al., 2008; Ulgherait et al., 2014). Importantly, however, while autophagy induction is generally considered to be cytoprotective, it has also been linked to cell death and disease pathogenesis (Levine and Kroemer, 2008; Liu and Levine, 2015). Therefore, it is likely that in certain physiological contexts, autophagy can contribute to pathophysiology and, thereby, limit lifespan. Indeed, recent work has shown that inhibition of autophagy-related genes, in post-reproductive C. elegans, can prolong lifespan and health span, leading to the proposal that autophagy switches to a harmful role in aged animals (Wilhelm et al., 2017). Hence, fundamental questions remain unanswered regarding the mechanism(s) by which age-related modulation of autophagy impacts organismal health and lifespan. Critically, there is a relative lack of understanding of how to modulate autophagy in aged animals to improve tissue homeostasis and prolong health.
Autophagy receptors designate substrate specificity through the recognition of specific cargo, including protein aggregates (aggrephagy), mitochondria (mitophagy), and pathogens (xenophagy) (Stolz et al., 2014). Critically, however, an understanding of the role of autophagy cargo receptors in aging and lifespan determination remains elusive. p62 (also known as Sequestosome 1) is a prototypic autophagy adaptor that possesses a C-terminal ubiquitin-binding domain and a short LC3-interacting region responsible for LC3/ATG8 interaction, allowing recruitment of ubiquitinated cargo into nascent APs (Johansen and Lamark, 2011; Pankiv et al., 2007). Studies in Drosophila melanogaster and mice have shown that p62 is required for the aggregation of ubiquitinated proteins and their autophagic clearance (Komatsu et al., 2007; Nezis et al., 2008). In addition, p62 has been shown to play a role in the PINK1/Parkin pathway of mitophagy (Ashrafi and Schwarz, 2013). A key step in mitophagy involves the recruitment of Parkin, an E3 ubiquitin ligase, from the cytosol to a dysfunctional mitochondrion (Narendra et al., 2008). Once there, Parkin ubiquitinates outer mitochondrial membrane proteins and induces mitophagy (Ashrafi and Schwarz, 2013). p62 accumulates on damaged mitochondria and can recognize Parkin-mediated, poly-ubiquitinated chains (Geisleret al., 2010). The question of whether p62 is required for mitophagy remains controversial with some studies in mammalian cells reporting that p62 is required for Parkin-mediated mitophagy (Ding et al., 2010; Geisler et al., 2010; Lee et al., 2010), but not others (Narendra et al., 2010). Consistent with a key role for p62 in mitophagy, Refractory to Sigma P, ref(2)P, the single Drosophila ortholog of p62 has been shown to play an essential role in promoting mitophagy (de Castro et al., 2013). Studies in both flies and mice have shown that genetic inactivation of p62 leads to early-onset mitochondrial dysfunction, neurodegeneration, and reduced lifespan (de Castro et al., 2013; Kwon et al., 2012; Ramesh Babu et al., 2008). However, the consequences of increasing p62 expression, in aging animals, on mitochondrial homeostasis, proteotoxicity, and organismal health are not known.
The proposed roles of p62 in the autophagic clearance of protein aggregates (aggrephagy) and dysfunctional mitochondria (mitophagy) led us to examine whether p62 could modulate tissue and/or organismal aging. To do so, we examined the impact of upregulation of the Drosophila p62 homolog ref(2)P/dp62 (de Castro et al., 2013) at different stages of adulthood. Importantly, we show that midlife induction of dp62 improves markers of health and prolongs lifespan. Short-term, midlife dp62 induction improves proteostasis in aged muscle. Critically, the ability of midlife dp62 induction to improve proteostasis and prolong lifespan is dependent upon autophagy-related genes. In addition, midlife dp62 induction promotes mitophagy and improves markers of mitochondrial function in aged flies. The process of mitophagy is intimately linked to mitochondrial fission/fusion processes (Ashrafi and Schwarz, 2013; Twig and Shirihai, 2011). Here, we show that inhibiting mitochondrial fission, via expression of a dominant-negative Dynamin-related protein 1 (Drp1) transgene, impairs dp62-mediated improvements in mitochondrial function and longevity. Furthermore, knockdown of parkin abrogates dp62-mediated longevity. Together, our findings indicate that activating dp62 expression, in midlife, is an effective approach to improve proteostasis and mitochondrial function and, thereby, prolong healthy lifespan.
RESULTS
Midlife dp62 Induction Prolongs Lifespan and Health Span
Previous studies have reported a decline in p62 mRNA levels in aged mice (Kwon et al., 2012) and in the brains of Alzheimer’s disease patients (Du et al., 2009). To better understand the relationship between p62 expression and aging, we examined mRNA levels of the Drosophila ortholog of p62, ref(2)P (hereafter dp62), in aging flies. qPCR analysis showed that transcript levels of dp62 at first increase early in adult life and then later on, after midlife, show a sharp decrease in expression (Figure 1A). To determine whether dp62 can modulate organismal aging, we examined the impact of dp62 upregulation on Drosophila lifespan. To do so, we used Gene-Switch driver lines to activate a UAS-dp62 transgene created by de Castro et al. (2013). Using the Gene-Switch system eliminates genetic background effects as all flies share the same genetic background and only differ with respect to the presence of the inducing agent (RU486) or diluent (ethanol) in the food (Osterwalder et al., 2001). Using ubiquitous daughterless (da)GS>UAS-dp62 flies, we showed that dp62 transcript and protein levels can be significantly upregulated in midlife upon short-term RU486 treatment (Figures 1B, 1C, and S1A). Next, we set out to examine the impact of temporally defined upregulation of dp62 on fly lifespan. Upregulation of dp62 in early adulthood (days 0–30) had no significant impact on longevity (Figure S1B). However, upregulating dp62 from midlife (day 30) onward significantly extended lifespan in female flies in multiple trials (Figures 1D, S1C, and S1D). Interestingly, however, we failed to observe dp62-mediated lifespan extension in male flies (Figure S1E). Using an independently generated UAS-dp62 transgene (Chang and Neufeld, 2009), we confirmed that midlife dp62 induction prolongs female lifespan (Figures S1F and S1G). Because ubiquitous, midlife dp62 induction in female flies resulted in the most pronounced extension of lifespan, this paradigm was used in all further experiments.
Figure 1. Midlife dp62 Induction Extends Lifespan and Health Span.

(A) qPCR analyses of dp62 mRNA levels on days 10, 28, 37, and 44 in daGS>UAS-dp62 females without RU486. n = 5 biological replicates with 3 flies per replicate; ***p < 0.001; one-way ANOVA/Bonferroni’s multiple-comparisons test.
(B) qPCR analyses of dp62 mRNA levels on day 37 in daGS>UAS-dp62 females with or without RU486 mediated transgene induction for 7 days (day 30 to day 37). n = 5 biological replicates with 3 flies per replicate; ***p < 0.001; unpaired t test.
(C) Western blot detection and quantification of dP62 levels in day 37 daGS>UAS-dp62 females with or without RU486-mediated transgene induction for 7 days (day 30 to day 37). n = 5 biological replicates with 5 flies per replicate. **p < 0.01; unpaired t test.
(D) Survival curves of daGS>UAS-dp62 females with or without RU486-mediated transgene induction from day 30 onward. The shaded area indicates the duration of dp62 induction. p < 0.0001; log-rank test; n > 147 flies.
(E) Capillary feeding assay (CAFE) of 37-day-old daGS>UAS-dp62 females with or without RU486-mediated transgene induction from day 30 to day 37. n = 10 vials of 10 flies per condition; p > 0.05 and is non-significant (n.s.); unpaired t test.
(F) Climbing index as a measure of endurance of 37-day-old daGS>UAS-dp62 females with or without RU486-mediated transgene induction from day 30 to day 37. n = 3 biological replicates with 100 flies per replicate; ***p < 0.001 and *p < 0.05; unpaired t test.
(G) Intestinal integrity during aging of daGS>UAS-dp62 females with or without RU486-mediated transgene induction since midlife (day 30) onward. n = 120 flies on day 10; **p < 0.01, *p < 0.05; one-way ANOVA/Bonferroni’s multiple-comparisons test.
RU486 was provided in the media at a concentration of 25 μg/mL. Error bars represent SEM.
It is important to determine whether interventions that prolong lifespan also extend health span, the functional and disease-free period of life. Hence, we examined a number of markers of health span and behavior in middle-aged (day 37) daGS>UAS-dp62 flies following 7 days of dp62 induction from day 30 onward. As a reduction in food intake can modulate lifespan, we tested whether midlife dp62 induction affects feeding behavior. Using a capillary feeding assay (Ja et al., 2007), we observed no significant change in feeding behavior upon midlife dp62 induction (Figure 1E). Midlife dp62 induction had no effect on the spontaneous physical activity of aged flies (Figures S1H and S1I). Critically, however, short-term midlife dp62 induction produced a significant improvement in an endurance exercise paradigm (Figure 1F). A major goal of geroscience is to identify interventions that can forestall age-onset pathology. Intestinal barrier dysfunction is an evolutionarily conserved pathophysiological marker of aging, which is linked to systemic metabolic defects and mortality (Dambroise et al., 2016; Rera et al., 2012). To determine whether dp62 induction can impact intestinal aging, we examined intestinal integrity during aging via the “Smurf assay” (Rera et al., 2011, 2012). Remarkably, we observed a delay in the onset of intestinal barrier dysfunction upon dp62 induction from day 30 onward (Figure 1G). Importantly, RU486 treatment had no effect on dp62 levels, lifespan, feeding behavior, the endurance paradigm, or the onset of intestinal barrier dysfunction in control flies (Figures S1J–S1O). Collectively, these data demonstrate that midlife dp62 induction improves health span, delays the onset of pathology linked to aging, and increases lifespan.
Midlife dp62 Induction Improves Proteostasis in Aged Flies
The accumulation of damaged and/or aggregated proteins, due to an age-related decline in proteostasis, contributes to aging and multiple age-related diseases (Kaushik and Cuervo, 2015). To determine whether midlife dp62 induction could impact proteostasis in aged animals, we characterized the accumulation of ubiquitinated protein aggregates in aged flight muscles using immunofluorescence (IF) microscopy. Aged Drosophila flight muscles accumulate ubiquitinated protein aggregates consistent with a loss of proteostasis (Figures 2A–2C or 2A″–2C″; quantification in Figure 2E). Remarkably, midlife induction of dp62 for a week, starting at day 30, resulted in reduced levels of aggregated proteins in aged muscles (compare Figure 2C with Figure 2D or Figure 2C″ with Figure 2D″; quantification in Figure 2E). In a complementary approach, we examined the levels of ubiquitinated proteins by western blotting upon short-term, midlife dp62 induction. Consistent with the IF data, we observed that midlife dp62 induced flies display reduced levels of ubiquitinated proteins in the whole flies and detergent-soluble fraction (Figures 2F and S2A). Since p62 is itself an autophagy substrate, impaired autophagy is associated with increased levels of p62 protein in mammals and Drosophila (Klionsky et al., 2016). Indeed, we observed that flight muscles from middle-aged Drosophila show elevated dP62 levels (Figures 2A′–2C′; quantification in Figures S2B and S2C). Interestingly, midlife induction of dp62 for a week from day 30 onward resulted in increased co-localization of dP62 and polyubiquitinated aggregates (compare Figure 2C″ with Figure 2D″; quantification in Figure 2G). Importantly, feeding RU486 to control flies did not alter the accumulation of ubiquitinated proteins during aging (Figures S2D–S2H), the levels of dP62 (Figure S2I), or colocalization of dP62 with the polyubiquitinated aggregates (Figure S2J).
Figure 2. Midlife dp62 Induction Improves Proteostasis in Aged Flies.

(A-D″) Immunostaining of indirect flight muscles from day 10 (A, A′, and A″), 28 (B, B′, and B″), and 37 daGS>UAS-dp62 females with (D, D′, and D″) or without (C, C′, and C″) RU486-mediated transgene induction from day 30 to day 37, showing polyubiquitinated aggregates (green channel, anti-FK2); dP62 (red channel, anti-dP62); and muscles (blue channel stained with phalloidin/F-Actin). Scale bar is 10 μm.
(E) Quantification of polyubiquitin aggregates in muscle as shown in (A)–(D). n > 8 flies; ***p < 0.001 and *p < 0.1; one-way ANOVA/Bonferroni’s multiple-comparisons test.
(F) Western blot detection and densitometry of total ubiquitin-conjugated proteins from day 37 daGS>UAS-dp62 females with or without RU486-mediated transgene induction from day 30 to day 37. n = 5 replicates with 5 flies per replicate; **p < 0.01; unpaired t test.
(G) Quantification of colocalization of dP62 with polyubiquitinated aggregates (anti-FK2) as shown in (C″) and (D″). n > 8 flies; **p < 0.01; unpaired t test. RU486 was provided in the media at a concentration of 25 μg/mL. Error bars represent SEM.
Midlife dp62 Induction Requires Autophagy for Improved Proteostasis and Longevity
Numerous studies have reported a decline in autophagic activity in tissues from aged animals (Hansen et al., 2018). Although an age-related decline in p62 transcript levels have been reported (Kwon et al., 2012), the relationship between p62 expression and autophagy in aged animals is not understood. Endogenous LC3/Atg8 levels are commonly used as steady-state autophagy markers to allow visualization of autophagosomes (APs) (Klionsky et al., 2016). A recent study in C. elegans, using a fluorescently tagged LGG-1 (a C. elegans ortholog of Atg8), reported an age-related increase in AP numbers, reflective of a decline in autophagic activity (Chang et al., 2017). To explore the interplay between midlife dp62 induction and autophagy, we examined the levels of endogenous ATG8a in aging flight muscles using IF microscopy. Consistent with findings in worms (Chang et al., 2017), we observed a striking increase in ATG8a levels in aged (37-day-old) muscle (Figures 3A–3C; quantification in Figure 3E). Using transmission electron microscopy coupled with immunogold labeling, we verified that the Atg8a antibody used above for IF can label APs and autolysosomes (ALs); double-membrane structures enclosing cellular materials (Figures S3A and S3B). Interestingly, short-term, midlife dp62 induction (day 30–37) resulted in a significant decrease in ATG8a levels in aged muscle (compare Figure 3C with Figure 3D; quantification in Figure 3E). In a complementary approach, we used a transgenic reporter line (mCherry-Atg8a; Denton et al., 2012) to assess the effect of short term, midlife dp62 induction (day 30–37) on AP/AL levels in aged muscles. Consistent with the IF data, midlife dp62 induction (day 30–37) resulted in a significant decrease in mCherry-Atg8a levels in the aged muscles (Figures 3F and 3G; quantification in Figure 3H). qPCR analysis revealed that this decrease in the ATG8a protein levels was not accompanied by a change in Atg8a mRNA levels (Figure S3F). Importantly, RU486 treatment had no effect on the ATG8a levels in control flies (Figures S3G and S3H; quantification in Figure S3I).
Figure 3. Midlife dp62 Induction Requires Autophagy to Improve Proteostasis and Lifespan.

(A-D) Immunostaining of indirect flight muscles from day 10 (A), 28 (B), and 37 daGS>UAS-dp62 females with (D) or without (C) RU486-mediated transgene induction from day 30 to day 37, showing Atg8a/LC3 foci (green channel, anti-Atg8a); and muscles (red channel, stained with phalloidin/F-actin). Scale bar is 10 μm.
(E) Quantification of Atg8a/LC3 foci in muscle as shown in (A)–(D). n = 8 flies; ***p > 0.001; one-way ANOVA/Bonferroni’s multiple-comparison tests.
(F and G) Staining of indirect flight muscles from day 37 daGS,mCherry-Atg8a>UAS-dp62 females with (G) or without (F) RU486-mediated transgene induction from day 30 to day 37, showing mCherry-Atg8a foci (red channel, mCherry). Scale bar is 10 μm.
(H) Quantification of mCherry-Atg8a foci in muscle as shown in (F) and (G). n = 14 flies; *p < 0.05; unpaired t test.
(I and J) Western blot detection (I) and quantification (J) of Atg8a levels in thorax extracts from day 10, 28, and 37 daGS>UAS-dp62 females with or without RU486-mediated transgene induction from day 30 to day 37. n > 5 replicates with 5 thoraces per replicate; ***p < 0.001 and **p < 0.01; one-way ANOVA/Bonferroni’s multiple-comparisons test.
(K) Survival curves of daGS>UAS-Atg1RNAi,UAS-dp62 females with or without RU486-mediated transgene induction from day 30 onward. The shaded area indicates the duration of Atg1RNAi and dp62 induction. p > 0.05 and is non-significant (n.s.); log-rank test; n > 205 flies.
(L) Quantification of ubiquitin aggregates in muscle as shown in (M) and (N). n = 16 flies; p > 0.5 and is non-significant (n.s.); unpaired t test.
(M–M″ and N–N″) Immunostaining of indirect flight muscles from day 37 daGS>UAS Atg1RNAi, UAS-dp62 females with (N, N′, and N″) or without (M, M′, and M″) RU486-mediated transgene induction from day 30 to day 37, showing polyubiquitinated aggregates (green channel, anti-FK2); dP62 protein aggregates (red channel, anti-dP62) and muscles (blue channel, stained with phalloidin/F-actin). Scale bar is 10 μm.
RU486 was provided in the media at a concentration of 25 μg/mL. Error bars represent SEM.
LC3/ATG8 can be conjugated to phosphatidylethanolamine (PE) with the non-lipidated and lipidated forms referred to as ATG8/LC3-I and ATG8/LC3-II, respectively (Klionsky et al., 2016). Increased levels of PE-modified Atg8/LC3 (ATG8/LC3-II) can reflect the induction of autophagic sequestration (Klionsky et al., 2016). Short-term, midlife dp62 induction (day 30–37) resulted in a greater ratio of ATG8a-II to ATG8a-I (Figures 3I and S3J; quantification in 3J). In addition, given the interconnection between the lysosome system and autophagy, we examined endogenous levels of the lysosome marker Lamp1 (lysosome-associated membrane protein 1) and detected an overall increase in Lamp1 levels in response to short-term, midlife dp62 induction (Figures S3C and S3D; quantification in Figure S3E). One interpretation of these combined data is that midlife dp62 induction stimulates autophagic activity.
To seek evidence of a causal role for autophagy in midlife-dp62-mediated proteostasis benefits and longevity, we set out to directly manipulate various autophagy-related genes. More specifically, we inhibited multiple autophagy-related genes by RNAi from midlife onward in flies with increased dp62 and compared survivorship to flies with increased dp62 alone. We observed that induced RNAi of Atg1, Atg2, Atg5, or Atg13 from midlife suppressed the lifespan extension associated with dp62 induction (Figures 3K and S3K–S3Q). Moreover, induction of RNAi of these autophagy genes from midlife had no major impact on lifespan in control flies (Figures S4A–S4D). These results demonstrate that midlife dp62-mediated lifespan extension requires functional autophagy-related genes. Atg1, a Ser/Thr protein kinase involved in the initiation of AP formation (Feng et al., 2014), was selected for further studies. More specifically, using daGS>UAS-Atg1R-NAi,UAS-dp62 flies, we verified that RNAi of Atg1 had no effect on the dp62 induction (Figure S4E). Next, we set out to determine whether autophagy is required for dP62-mediated improvements in proteostasis in aged animals. Using daGS>UAS-Atg1-RNAi,UAS-dp62 flies, we examined the accumulation of polyubiquitinated proteins in aged flight muscles using IF microscopy. Interestingly, midlife RNAi of Atg1 from day 30 onward suppressed the dp62-mediated reduction in protein aggregates in aged muscle (compare Figures 3M and 3N with 2C and 2D, or Figures 3M″ and 3N″ with 2C″ and 2D″; quantification of Figures 3M and 3N in Figure 3L). Induced RNAi of Atg1 had no effect on the increase in dP62 levels in aged animals (Figures 3M′ and 3N′; quantification in Figure S4F). RNAi of Atg1 alone had no effect on the polyubiquitin aggregates levels or dP62 levels (Figures S4G and S4H, and S4I and S4J; quantifications in Figures S4K and S4L). Overall, our data indicate that the prolongevity and enhanced proteostasis effects of midlife induction of dp62 are dependent upon the autophagy pathway.
Midlife dp62 Induction Facilitates Mitophagy and Improves Mitochondrial Function
p62 has been proposed to function in the mitophagy pathway (Ashrafi and Schwarz, 2013), but the relationships between p62, mitophagy, and aging are not known. Here, we set out to examine the impact of short-term, midlife dp62 induction on mitochondrial homeostasis in aged flight muscle. In recent years, studies in diverse organisms suggest that mitochondrial dynamics (fission and fusion) and mitophagy are closely related (Ashrafi and Schwarz, 2013; Twig and Shirihai, 2011). Indeed, mitochondrial fission is required for mitophagy in yeast and mammalian cells (Mao et al., 2013; Rambold et al., 2011; Twig et al., 2008; Twig and Shirihai, 2011), leading to the model that the fragmentation of mitochondria facilitates their engulfment by APs. Hence, we utilized IF microscopy to examine the impact of dp62 induction on mitochondrial morphology in aged muscle. Upon dp62 midlife induction for 7 days (day 30–37), we observed that mitochondrial morphology was more circular and less elongated as compared to controls suggesting an increase in mitochondrial fission/decrease in fusion (Figures 4A and 4B; quantification in Figure 4C). Recent work has shown that directly promoting mitochondrial fission in aged Drosophila flight muscle can facilitate mitophagy and improves mitochondrial function (Rana et al., 2017). Hence, we set out to first examine the impact of midlife dp62 induction on mitochondrial function. We examined mitochondrial membrane potential using the potentiometric dye tetramethylrhodamine, ethyl ester (TMRE). Importantly, we observed that midlife induction (from day 30 to day 37) of dp62 leads to a significant increase in TMRE fluorescence in aged flight muscle (Figures 4D and 4E; quantification in Figure 4F). Next, as an additional marker of mitochondrial health and function, we set out to determine the impact of short-term, midlife dp62 induction on mitochondrial reactive oxygen species (ROS) levels. Upon midlife induction of dp62 (from day 30 to day 37), we observed reduced mitochondrial ROS levels in day 37 aged flight muscles as compared to controls (Figures 4G and 4H, and 4G′ and 4H′; quantification in Figure 4I). Importantly, RU486 treatment had no effect on mitochondrial size (Figures S5A–S5C), mitochondrial activity (Figures S5D–S5F), or ROS levels in the control flies (Figures S5G–S5I). In recent years, mitohormesis has been shown to promote longevity through mechanisms that may involve elevated ROS levels and induction of mitochondrial unfolded protein response (UPRmt) (Yun and Finkel, 2014). However, we failed to detect an induction of UPRmt genes upon midlife dp62 induction (Figure S5J). These data indicate that midlife dp62 induction does not promote beneficial effects via mitohormesis.
Figure 4. Midlife dp62 Induction Improves Mitochondrial Function.

(A and B) Immunostaining of indirect flight muscles from day 37 daGS>UAS-dp62 females with (B) or without (A) RU486-mediated transgene induction from day 30 to day 37, showing mitochondrial morphology (green channel, anti-ATP5a); muscles (red channel, stained with phalloidin/F-actin). Scale bar is 5 μm.
(C) Quantification of mitochondrial area in muscle as shown in (A) and (B). n = 8 flies; **p < 0.01; unpaired t test.
(D and E) Staining of indirect flight muscles from day 37 daGS>UAS-dp62 females with (E) or without (D) RU486-mediated transgene induction from day 30 to day 37 showing TMRE fluorescence. Scale bar is 10 μm.
(F) Quantification of mitochondrial membrane potential measured by TMRE staining as shown in (D) and (E). n > 15 flies; **p < 0.01; unpaired t test.
(G–H′) Staining of indirect flight muscles from 37-day-old daGS>UAS-dp62 females with (H and H′) or without (G and G′) RU486-mediated transgene induction from day 30 to day 37, showing mitochondria (green channel, Mitotracker green staining) and levels of superoxide radicals (red channel, staining with MitoSOX reagent). Scale bar is 10 μm.
(I) Quantification of free superoxide radicals as shown in (G′) and (H′); n = 14 biological replicates; *p < 0.05; unpaired t test.
RU486 was provided in the media at a concentration of 25 μg/mL. Error bars represent SEM.
Next, we examined additional markers of mitochondrial homeostasis in midlife dp62 induced flies. Mitophagy induction might promote selective turnover of dysfunctional mitochondria or mitochondrial components, thereby resulting in a decrease in mitochondrial content. Indeed, midlife induction of dp62 for a short term (day 30–37) resulted in lower mitochondrial DNA levels in aged flight muscles (Figures 5A and 5B; quantification in Figure 5C). Importantly, RU486 treatment had no effect on the mitochondria DNA content in control flies (Figures S6A–S6C). To further test the idea that midlife dp62 induction facilitates mitophagy, we set out to examine co-localization of an autophagy marker with mitochondria. Midlife dp62 induction for 7 days (day 30–37) resulted in a significant increase in ATG8a/LC3 levels in the mitochondrial fraction (Figure 5D). As an increase in P62 levels is linked to impaired autophagy (Klionsky et al., 2016), the recent finding that there is a striking accumulation of dP62 co-localized with mitochondria in midlife is consistent with a decline in mitophagy in aged flies (Rana et al., 2017). Short-term, midlife dp62 induction (day 30–37) resulted in reduced dP62 levels in the mitochondrial fraction from aged flies (Figure 5E).
Figure 5. Midlife dp62 Induction Facilitates Mitophagy.

(A and B) Immunostaining of indirect flight muscles from day 37 daGS>UAS-dp62 females with (B) or without (A) RU486-mediated transgene induction from day 30 to day 37, showing dsDNA (green channel, anti-dsDNA); muscles (red channel, stained with phalloidin/F-actin). Scale bar is 5 μm.
(C) Quantification of mitochondrial DNA in muscle as shown in (A) and (B). n = 8 flies; **p < 0.01; unpaired t test.
(D and E) Western blot detection and densitometry of Atg8a (D) and dP62 (E) levels in isolated mitochondria from day 37 daGS>UAS-dp62 females with or without RU486-mediated transgene induction from day 30 to day 37. n = 5 replicates, 5 flies per replicate; *p < 0.05; **p < 0.01; unpaired t test.
(F–J′) mito-QC of brains from day 37 (F, G, and F′, G′) and day 44 (I, J, and I′, J′) females. Genotypes analyzed were daGS>UAS-dp62, UAS-mito-QC, and daGS>UAS-mito-QC females with RU486-mediated transgene induction from day 30 to day 37 or from day 30 to day 44, showing merged image of GFP and mCherry (F, G, and I, J) and punctate mCherry-only foci (resulting from merged image where GFP has been quenched; mitolysosomes) (F′, G′, I′, and J′). Scale bar is 10 μm.
(H, K, and L) Quantification of mitolysosomes in brains as shown in (F′) and (G′), and (I′) and (J′) at day 37 (H), day 44 (K), and at day 37 and 44 (L). n > 10 flies; **p < 0.01; ***p < 0.001; unpaired t test (H-K). ***p < 0.001 and *p < 0.05; one-way ANOVA/Bonferroni’s multiple-comparisons test (L).
(M and N) Immunostaining of indirect flight muscles from day 37 daGS>UAS-Atg1RNAi,UAS-dp62 females with (N) or without (M) RU486-mediated transgene induction from day 30 to day 37, showing mitochondrial morphology (green channel, anti-ATP5a); muscles (red channel, stained with phalloidin/F-actin). Scale bar is 5 μm.
(O) Quantification of mitochondrial area in muscle as shown in (M) and (N). n = 9 flies; ***p < 0.001; unpaired t test.
(P and Q) Staining of indirect flight muscles from day 37 daGS>UAS-Atg1RNAi,UAS-dp62 females with (Q) or without (P) RU486-mediated transgene induction from day 30 to day 37 showing TMRE fluorescence. Scale bar is 10 μm.
(R) Quantification of mitochondrial membrane potential measured by TMRE staining as shown in (P) and (Q). n > 10 flies; p > 0.05 and is non-significant (n.s.); unpaired t test.
RU486 was provided in the media at a concentration of 25 μg/mL. Error bars represent SEM.
To further characterize the impact of midlife dp62 induction, we used a recently characterized mitophagy reporter line, a tandem GFP-mCherry fusion protein targeted to the outer mitochondrial membrane, called mito-QC (Lee et al., 2018). This system exploits the pH-sensitive properties of GFP to enable the differential labeling of mitochondria in the acidic microenvironment of the lysosome as a readout of mitophagy (McWilliams et al., 2016). More specifically, we analyzed the expression pattern of mito-QC from midlife onward with or without dp62 induction (day 30–37 or day 30–44). In this experiment, appearance of punctate mCherry-only foci (mitolysosomes) is quantified as an index of mitophagy induction. Remarkably, midlife induction of dp62, starting at day 30, resulted in increased levels of mitolysosomes (mCherry-only foci) in aged brains (Figures 5F–5L). Similarly, midlife dp62 induction increased the numbers of mitolysosomes (mCherry-only foci) in intestinal cells (Figures S6D–S6J).
Next, we set out to determine whether autophagy is required for dp62-mediated improvements in mitochondrial function in middle-aged flies. More specifically, we inhibited Atg1 by RNAi from midlife onward in flies with increased dp62 and analyzed mitochondrial morphology and function. Interestingly, we found that Atg1 is not required for dp62-mediated mitochondrial fission (Figures 5M and 5N; quantification in Figure 5O). Importantly, however, we found that induced RNAi of Atg1 in midlife suppressed the improvement in TMRE fluorescence associated with midlife dp62 induction (Figures 5P and 5Q; quantification in Figure 5R). Taken together, these findings indicate that short-term induction of dp62 in midlife facilitates mitophagy leading to improved mitochondrial function in aged animals.
Midlife dp62 Induction Requires Mitochondrial Fission for Mitochondrial Function and Lifespan Benefits
There is an emerging understanding that mitochondrial fission is a prerequisite for mitophagy (Cho et al., 2019; Rana et al., 2017; Twig and Shirihai, 2011). Hence, we set out to better understand the role of mitochondrial fission and mitophagy in dp62-mediated improvements in mitochondrial function and longevity. To do so, we directly manipulated Drp1, a dynamin-related protein that promotes mitochondrial fission (Hoppins et al., 2007). More specifically, we inhibited mitochondrial fission, by inducing a dominant-negative Drp1 (Drp1K38A) transgene (Park et al., 2009), from midlife onward in flies with increased dp62 levels and examined the impact on mitochondrial morphology, mitochondrial function, and compared survivorship to flies with increased dp62 alone. We confirmed that inducing dominantnegative Drp1 (Drp1K38A) from midlife onward in flies with increased dp62 levels (Figure S7A) prevented an increase in mitochondrial fission (Figures 6A and 6B; quantification in Figure 6C). Next, these flies were examined for mitochondrial membrane potential using the potentiometric dye TMRE. Flies with induced Drp1K38A from midlife onward along with increased dp62 levels failed to show any improvement in TMRE fluorescence (Figures 6D and 6E; quantification in Figure 6F) as compared to when dp62 alone was induced (Figures 4D–4F). Next, we set out to determine whether mitochondrial fission is required for dp62-mediated longevity. Critically, we found that inhibiting mitochondrial fission in flies with midlife dp62 induction resulted in reduced lifespan (Figures 6G and S7B). In addition, we find that induced RNAi of parkin suppressed the lifespan extension associated with midlife dp62 induction (Figures 6H, S7C, and S7D). Moreover, RNAi of parkin from midlife did not shorten lifespan in control flies (Figure S7E). Taken together, these results indicate that the anti-aging and prolongevity effects of midlife dp62 induction depend upon mitochondrial fission-mediated mitophagy.
Figure 6. Mitochondrial Fission Is Required for Beneficial Effects of Midlife dp62 Induction.

(A and B) Immunostaining of indirect flight muscles from day 37 daGS>UAS-dp62,UAS-Drp1K38A females with (B) or without (A) RU486-mediated transgene induction from day 30 to day 37, showing mitochondrial morphology (green channel, anti-ATP5a) and muscles (red channel, stained with phalloidin/F-actin). Scale bar is 5 μm.
(C) Quantification of mitochondrial area in muscle as shown in (A) and (B). n > 11 flies; p > 0.05 and is n.s.; unpaired t test.
(D and E) Staining of indirect flight muscles from day 37 daGS>UAS-dp62,UAS-Drp1K38A females with (E) or without (D) RU486-mediated transgene induction from day 30 to day 37 showing TMRE fluorescence. Scale bar is 10 μm.
(F) Quantification of mitochondrial membrane potential measured by TMRE staining as shown in (D) and (E). n = 13 flies; p > 0.05 and is nonsignificant (n.s.); unpaired t test.
(G) Survival curves of daGS>UAS-dp62,UAS-Drp1K38A females with or without RU486-mediated transgene induction from day 30 onward. The shaded area indicates the duration of dp62 and Drp1K38A induction. p < 0.0001, log-rank test; n > 186 flies.
(H) Survival curves of daGS>UAS-dp62,UAS-ParkinRNAi females with or without RU486-mediated transgene induction from day 30 onward. The shaded area indicates the duration of dp62 and ParkinRNAi induction. p = 0.183 and is non-significant (n.s.), log-rank test; n > 125 flies.
RU486 was provided in the media at a concentration of 25 μg/mL. Error bars represent SEM.
DISCUSSION
Numerous lines of evidence indicate that aging is linked to alterations in the activity of the autophagy pathway (Hansen et al., 2018). However, the underlying mechanisms that lead to these changes and the causal relationships between altered autophagic activity and age-related health decline remain subject to speculation. Critically, the question of whether increasing the expression of autophagy-related genes in aged animals can slow tissue aging and/or promote longevity remains largely unexplored. In this study, we used the fruit fly Drosophila as a model organism to address the question of whether p62, a prototypic autophagy cargo receptor, can modulate tissue and/or organismal aging. Using an inducible gene expression system, we show that upregulation of dp62 from midlife onward leads to a significant increase in fly lifespan. Furthermore, we show that induction of dp62 in middle-aged animals improves several markers of organismal health and delays age-onset pathology. Induction of dp62 in young flies did not produce a prolongevity effect, indicating that dp62 expression levels are not limiting for health in early life. Our findings reveal that p62 represents a therapeutic target to counteract aging and, thereby, prolong health span in aged animals. It is interesting to note that an 8-fold induction of dp62 mRNA levels was associated with lifespan extension.
As P62 is a multifunctional protein that serves as a signaling hub for a myriad of cellular processes including amino acid sensing, immunity, and the oxidative response (Avila et al., 2002; Bangham et al., 2007; Katsuragi et al., 2015), there exist several potential candidate mechanisms that could underlie the beneficial effects of midlife dp62 induction. Critically, we show that the anti-aging effects of midlife dp62 induction, both at the tissue and organismal level, are dependent upon autophagy-related genes. More specifically, we show that midlife dp62 induction reduces proteotoxicity in aged muscles and promotes longevity in an Atg1-dependent manner. Moreover, we find that midlife dp62 induction leads to a shift toward mitochondrial fission and improves mitochondrial function in an Atg1-dependent fashion. To better understand the importance of mitochondrial fission in dp62-mediated longevity, we set out to simultaneously inhibit mitochondrial fission and upregulate dp62 in midlife. Consistent with the idea that mitochondrial fission is important in facilitating mitophagy in aged animals (D’Amico et al., 2019; Rana et al., 2013, 2017), we find that inhibiting mitochondrial fission abrogates the beneficial effects of midlife dp62 induction on mitochondrial function and longevity. Studies in yeast have shown that upon mitophagy induction, Dnm1 (yeast Drp1 ortholog) is recruited to the degrading mitochondria via the scaffold protein Atg11 to induce fission (Mao et al., 2013). Future work could focus on elucidating the molecular mechanisms by which increased dp62 expression promotes mitochondrial fission in aged animals. In addition, we show that dp62-mediated longevity requires parkin, a key component of the mitophagy pathway (Ashrafi and Schwarz, 2013). Our findings, therefore, indicate that the selective clearance of mitochondria, via mitophagy, is key to midlife dp62-mediated longevity.
The autophagy pathway represents an attractive therapeutic target to promote healthy aging in humans. However, the question of when and how to manipulate autophagy in aging mammals, in order to prolong health, is not understood. A recent study reported that a gain-of-function mutation in a core autophagy gene, Becn1, can extend mammalian lifespan (Fernández et al., 2018). However, it is not clear whether targeting approaches of this kind to aged mammals can promote longevity. Recent findings, in C. elegans, have shown that inhibiting genes involved in early stages of autophagy in aged animals can prolong lifespan (Wilhelm et al., 2017). As a result, it has been proposed that dysfunctional autophagy in aged animals, linked to blockage of autophagy at a late stage, may contribute to age-onset health decline (Wilhelm et al., 2017). Hence, it is possible that interventions that induce early stages of autophagy, including AP formation, may not promote health when targeted to aged animals. In contrast, our findings suggest that midlife up-regulation of the autophagy adaptor protein, p62, can promote the autophagic clearance of protein aggregates and mitochondria in aged animals. Hence, increasing p62 expression by pharmacological means, in midlife, may be an effective approach to prolong health span in mammals.
STAR★METHODS
LEAD CONTACT AND MATERIALS AVAILABILITY
Further information and requests for resources and reagents should be directed to and will be fulfilled by the Lead Contact, David W. Walker (davidwalker@ucla.edu).
EXPERIMENTAL MODEL AND SUBJECT DETAILS
Drosophila melanogaster
Male flies were used in Figure S1E. Female flies were used in all other figures.
Fly Stocks
The fly line w1118;UAS-dp62-HA was kindly provided by L. Martins (University of Leicester, UK). w1118;UAS-dp62-GFP was provided by Thomas P. Neufeld (University of Minnesota, USA). UAS-Drp1K38A was provided by J. Chung (Korea Advanced Institute of Science and Technology, Republic of Korea). daughterless-GeneSwitch (daGS) was provided by H. Tricoire (Université Paris Diderot–Paris7, Paris, France), and Elav-GeneSwitch (ElavGS) was provided by H. Keshishian (Yale University, New Haven, CT, USA). UAS-mito-QC was provided by Alexander J. Whitworth (University of Cambridge, UK) (Lee et al., 2018). mCherry-Atg8a stock was provided by S Kumar (Centre for Cancer Biology, Adelaide, Australia) (Denton et al., 2012). white1118 (3605) and UAS-GFP-dsRNA (9330) were provided by the Bloomington Stock Center. UAS-Atg1-RNAi (16133), UAS-Atg2-RNAi (108447), UAS-Atg5-RNAi (104461), UAS-Atg13-RNAi (103381) and UAS-parkin-RNAi (104363) lines were received by Vienna Drosophila RNAi Center (VDRC).
Fly Husbandry and Lifespan Analysis
Flies were reared in vials containing cornmeal medium (1% agar, 3% yeast, 1.9% sucrose, 3.8% dextrose, 9.1% cornmeal, 1.1% acid mix, and 1.5% methylparaben, all concentrations given in wt/vol). Flies were collected under light nitrogen-induced anesthesia and housed at a density of 30 female flies per vial. All flies were kept in a humidified, temperature-controlled incubator with 12 h on/off light cycle at 25°C. RU486 was dissolved in ethanol and administered in the media while preparing food. Flies were flipped to fresh vial every 2–3 days and scored for death.
METHOD DETAILS
Capillary Feeding Assay (CAFE Assay)
Food intake was analyzed at day 37 using the CApillary FEeding (CAFE) assay as described previously (Rana et al., 2013) with modification. 100 flies per condition were tested, 10 flies were placed in vials with wet tissue paper at the bottom and a capillary food source [5% sucrose, 5% yeast extract, 2.5% FD&C Blue No. 1 (SPS Alfachem)]. Feeding was monitored for 10 hours, during light time and 30 min. after lights go off, feeding amount was recorded every 1–2 hours and the capillaries were replaced frequently.
Spontaneous physical activity assay
10 adult female flies were placed in a Drosophila activity monitor (TriKinetics). Movements were recorded continuously under normal culturing conditions for 36 h on a 12-h:12-h dark:light cycle. Bar graphs represent mean activity per fly per hour and the scatterplot shows spontaneous activity per fly during 12-h:12-h dark:light cycle. Triplicate samples were used for each activity measurement.
Climbing activity
100 adult female flies were placed in 100 ml glass cylinder. Cylinder was tapped quickly and flies were allowed to settle for 2 min. This step was repeated eight times. Then cylinder was tapped quickly and after 1 min, the number of flies in upper, middle, and lower 1/3rd part of the cylinder was recorded.
Intestinal barrier dysfunction (Smurf) assay
Intestinal integrity assay was performed as previously described in Rera et al. (2012). Flies were aged in normal food until the day of the assay (day 10, 28, 37, 44, and 51). The day before to the assay flies were transferred to new vials containing standard medium with 2.5% wt/vol F&D blue dye # 1 (SPS Alfachem). Flies were kept in this medium for 16 hours and flies with dye coloration outside the gut (smurf flies) were counted.
Immunostaining and Image analysis
Flies were fixed in 3.7% formaldehyde in PBS for 20 minutes. After fixation hemi-thoraces were dissected and fixed again for 5 min. Samples were then rinsed 3 times for 10 min. with 0.2% Triton X-100 in PBS (PBST) and blocked in 3% BSA in PBST (PBST-BSA) for 1 hour. Primary antibodies were diluted in PBST-BSA and incubated overnight at 4°C. Primary antibodies used were: mouse-anti-FK2 1:250 (BML-PW8810–0500, ENZO); rabbit-anti-dP62 1:250 (Rana et al., 2017); rabbit-anti-atg8a 1:250 (Rana et al., 2017); mouse-anti-atp5a 1:250 (15H4C4, abcam); mouse-anti-dsDNA 1;250 (ab27156, abcam) and rabbit-anti-Lamp1 1;200 (ab30687, abcam). Hemi-thoraces were then rinsed 3 times in PBST for 10 min. and incubated with the secondary antibodies and/or stains at room temperature for 3 hours. Secondary antibodies used were: anti-rabbit or anti-mouse AlexaFluor-488 1:500 (Invitrogen); anti-rabbit or antimouse AlexaFluor-555 1:500 (Invitrogen); To-Pro-3 DNA stain 1:500 (Invitrogen); phalloidin AlexaFlour-568 1:250 (Invitrogen). Finally, samples were rinsed 3 times with PBST for 10 min. and mounted in Vectashield Mounting Medium (Vector Lab). Images were taken using Zeiss LSM780 confocal microscope and analyzed using the ImageJ software to measure mitochondrial and aggregates sizes.
Immunogold Labeling and Electron Microscopy
Flies were fixed in 3.7% formaldehyde in PBS for 20 minutes. After fixation hemi-thoraces were dissected and fixed again for 5 min. Samples were then rinsed 3 times for 10 min with 0.2% Triton X-100 in PBS (PBST) and blocked in 3% BSA in PBST (PBST-BSA) for 1 hour. Primary antibodies, rabbit-anti-Atg8a 1:250 (Rana et al., 2017), were diluted in PBST-BSA and samples were incubated overnight at 4°C. Hemi-thoraces were then rinsed 3 times in PBST for 10 min. and incubated with the secondary antibody at room temperature for 3 hours. Secondary antibodies used were Protein A-gold conjugates diluted in blocking solution 1:80 (AC-10–05 Cytodiagnostic). Samples were then rinsed 3 times with PBST. Again samples were rinsed 3 times for 10 min in 0.1MPB. Sample fixation was done in 1% OsO4 in 0.1MPB for 1 hour at RT. Samples were rinsed for 3 times, 10 minutes with ddH2O. Then samples were dehydrated for 15 min each in 30%, 50%; 70%; 95% ethanol and 2 times for 10 min in 100% ethanol. Samples were transferred to propylene oxide (PO) two times for 15 min each and then to 1:1 mix of PO:epon resin for 1 hour. Then samples were transferred to 1:2 mix of PO:epon for several hours capped. Samples were then uncapped and left overnight. Then samples were transferred to fresh epon and placed in vacuum for several hours and allowed to polymerize at 60°C for 48hours. Semi-thin sections (1.5 μm) were cut on an ultramicrotome and stained with toluidine blue. The muscle area of interest was identified from these sections. For EM, sections of 70 nm thickness were prepared from the identified area, placed on formvar coated copper grids and stained with uranyl acetate and Reynolds’ lead citrate. The grids were examined using a JEOL 100CX transmission electron microscope at 60 kV(Electron Microscopy Facility, UCLA Brain Research Institute).
TMRE Staining
Flies were anesthetized and dissected in cold Drosophila Schneider’s Medium (DSM). Hemi-thoraces were incubated in TMRE staining solution (100nm TMRE (T669, Thermo Fisher Scientific) in DSM) for 12 min. at room temperature. After staining samples were rinsed once in wash solution (25nm TMRE in DSM) for 30 s. Hemi-thoraces were mounted in wash solution. Images were acquired in a Zeiss LSM780 confocal using identical setting for each condition. TMRE intensity was quantified using ImageJ software.
MitoSox staining
Flies were anesthetized and dissected in cold Drosophila Schneider’s Medium (DSM). Hemi-thoraces were incubated in staining solution (5 μM MitoSoxTM Red (M36008, Thermo Fisher Scientific) and 100nM MitoTracker® Green (M7514, Thermo Fisher Scientific) for 12 min. at room temperature. Hemi-thoraces were rinsed two times for 30 s at room temperature with DSM. Samples were mounted in DSM solution. Images were acquired in a Zeiss LSM780 confocal using identical setting for each condition. MitoSox intensity was quantified using ImageJ software.
Mito-QC staining
Flies were anesthetized and dissected in cold Drosophila Schneider’s Medium (DSM). Brains and guts were mounted in DSM solution. Images were acquired in a Zeiss LSM780 confocal using identical setting for each condition. Mitolysosomes (mCherry-only foci) were quantified using same parameters in the image calculator option in ImageJ software
Western Blot Assay
Whole flies (5 flies per sample) were homogenized in Lysis Buffer (PBS 1X, Protease Inhibitors 1X, NuPAGE LDS Sample Buffer 1X, and DTT (Dithitreitol) 0.05M). For Triton fraction, 10 flies were homogenized in Triton Buffer (Triton X-100 1%, PBS 1X and Protease Inhibitor 1X). Samples were spun at 13000 × g for 5 min. at 4°C, then supernatant (Triton fraction) was transferred to a new vial containing 4X Buffer (NuPAGE LDS Sample Buffer 4X, and DTT 0.05M). Samples from whole flies or Triton fraction were separated by SDS-PAGE gels and proteins were transferred to Nitrocellulose membranes. Samples were collected and lysates were separated by SDS-PAGE using standard procedures. Membranes were probed with antisera against: anti-α-actin peroxidase conjugated 1:15000 (A3854, Sigma), mouse-anti-VDAC1 / Porin 1:10000 (ab14734, Abcam), rabbit-anti-dP62 1:2500 (3), anti-GABARAP (ab109364, Abcam), rabbit-anti-HA (3724, Cell Signaling) and mouse-anti-ubiquitin (P4D1) 1:1000 (3936, Cell Signaling). Anti-Rabbit or anti-Mouse Horseradish peroxidase conjugated antibodies were used for detection at 1:10000 dilution. Amersham ECL Prime Western Blotting Detection Reagent (GE life sciences) was used to visualize the presence of horseradish peroxidase, and the chemiluminescent signal was recorded using Syngene Pxi Western Blot Imager. Image analysis was done using ImageJ.
Mitochondria Purification
Whole flies (25 flies per sample) were gently homogenized in cold mitochondrial isolation medium (MIM) [250Mm sucrose, 10mM Tris·HCl (pH 7.4), 0.15 mM MgCl2] using a plastic pestle homogenizer and then spun twice at 500 × g for 5 min at 4°C to remove debris. The supernatant was then spun at 5,000 × g, for 5 min at 4°C. The pellet, containing the mitochondria, was stored at −80°C and dissolved in Lysis Buffer as previously described.
RNA extraction, cDNA synthesis and Quantitative Real-Time PCR
Total RNA was extracted from whole flies. Samples were treated with DNase, and then cDNA synthesis was carried out using the First Strand cDNA Synthesis Kit from Fermentas. PCR was performed with PowerUP SYBR Green Master Mix (Ref#A25777, Applied Biosystems) on a BioRad Real Time PCR system. Cycling conditions were as follows: 95°C for 10 minutes; 95°C for 15 s then 60°C for 60 s, cycled 40 times, and equalized amplicons of Actin5C were used as a reference to normalize.
QUANTIFICATION AND STATISTICAL ANALYSIS
Prism5 (GraphPad) was used to perform the statistical analysis and graphical display of the data. Significance is expressed as p values. For comparisons of two groups, an unpaired t test was used. For comparisons of more than two groups, ANOVA with Bonferroni post hoc test was performed. Bar graph depicts mean ± SEM. Boxplots display the first and third quartile, with the horizontal bar at the median and whiskers showing the most extreme data point, which is no more than 1.5 times the interquartile range from the box. The difference between two groups was defined as statistically significant for the following p values: * < 0.05, ** < 0.01, *** < 0.001. The number (n) of biological samples used in each experiment and what n represents can be found in each figure legend. Log-rank (Mantel-Cox) test was used for survival curves comparison. The difference between survival curves was defined as statistically significant as follow: Significant < 0.0001 and non significant > 0.0001.
For comparison of survival curves, Log-rank (Mantel-Cox) test was used. Physiological and biochemical results were compared by Student’s t test or ANOVA with Bonferroni post hoc tests. No methods were used to determine whether the data met assumptions of the statistical approach.
Supplementary Material
KEY RESOURCES TABLE.
| REAGENT or RESOURCE | SOURCE | IDENTIFIER |
|---|---|---|
| Antibodies | ||
| Mouse anti-mono- and polyubiquitinylated conjugates (FK2) | Enzo Life Sciences | Cat# BML-PW8810–0100 |
| Rabbit anti-dP62 | Rana et al., 2017 | N/A |
| Rabbit anti-Atg8a | Rana et al., 2017 | N/A |
| Mouse ant-ATP5a | Abcam | Cat# ab14748; RRID: AB_301447 |
| Mouse anti-dsDNA | Abcam | Cat# ab27156; RRID: AB_470907 |
| Rabbit anti-Lamp1 | Abcam | Cat# ab30687; RRID: AB_775973 |
| Mouse anti VDAC1/Porin | Abcam | Cat# ab14734; RRID: AB_443084 |
| Rabbit anti-GABARAP+GABARAPL1 +GABARAPL2 | Abcam | Cat# ab109364; RRID: AB_10861928 |
| Mouse anti-ubiquitin (P4D1) | Cell Signaling | Cat# 3936; RRID: AB_331292 |
| Rabbit anti-HA Tag | Cell Signaling | Cat# 3724; RRID: AB_1549585 |
| Rabbit anti-GFP | Cell Signaling | Cat# 2956; RRID: AB_1196615 |
| Mouse anti-Actin-Peroxidase | Sigma-Aldrich | Cat# A3854; RRID: AB_262011 |
| Goat anti-Mouse IgG (H+L) Alexa Fluor 488 | Thermo Fisher Scientific | Cat# A-11001; RRID: AB_2534069 |
| Goat anti-Rabbit IgG (H+L) Alexa Fluor 488 | Thermo Fisher Scientific | Cat# A-11008; RRID: AB_143165 |
| Goat anti-Mouse IgG (H+L) Alexa Fluor 568 | Thermo Fisher Scientific | Cat# A-11031; RRID: AB_144696 |
| Goat anti-Rabbit IgG (H+L) Alexa Fluor 568 | Thermo Fisher Scientific | Cat# A-11036; RRID: AB_143011 |
| Goat anti-Mouse IgG (H+L) Alexa Fluor 647 | Thermo Fisher Scientific | Cat# A-32728; RRID: AB_2633277 |
| Goat anti-Rabbit IgG (H+L) Alexa Fluor 647 | Thermo Fisher Scientific | Cat# A-32733; RRID: AB_2633282 |
| Alexa Fluor™ 488 Phalloidin | Thermo Fisher Scientific | Cat# A12379; RRID: AB_2315147 |
| Alexa Fluor™ 568 Phalloidin | Thermo Fisher Scientific | Cat# A12380 |
| Alexa Fluor™ 647 Phalloidin | Thermo Fisher Scientific | Cat# A22287; RRID: AB_2620155 |
| Goat anti-Mouse (Whole molecule) peroxidase | Sigma-Aldrich | Cat# A4416; RRID: AB_258167 |
| Goat anti-Rabbit (Whole molecule) peroxidase | Sigma-Aldrich | Cat# A6154; RRID: AB_258284 |
| Chemicals, Peptides and Recombinant Proteins | ||
| Agar | Genesee Scientific | Cat# 66–104 |
| Yeast | MP Biomedicals | 290331225 |
| Sucrose | Genesee Scientific | Cat# 62–112 |
| Dextrose | Genesee Scientific | Cat# 62–113 |
| Cornmeal | Genesee Scientific | Cat# 62–100 |
| Propionic Acid | Sigma Aldrich | Cat# P1386 |
| Phosphoric Acid | Sigma Aldrich | Cat# 438081 |
| Tegosept (Methylparaben) | Genesee Scientific | Cat# 20–259 |
| Mifeprestone (RU486) | Cayman Chemicals | Cat# 10006317 |
| FD&C Blue Dye #1 | SPS Alfachem | N/A |
| Formaldehyde | Sigma Aldrich | Cat# F1635 |
| PBS (10X), pH 7.4 | Thermo Fisher Scientific | Cat# 70011044 |
| DL-Dithiothreitol | Sigma Aldrich | Cat# 43815 |
| NuPAGE LDS Sample Buffer (4X) | Thermo Fisher Scientific | Cat# NP0008 |
| TRIzol Reagent | Thermo Fisher Scientific | Cat# 15596018 |
| Chloroform | Sigma Aldrich | Cat# C2432 |
| Bovine Serum Albumin | Sigma Aldrich | Cat# A2153 |
| Triton X-100 | Sigma Aldrich | Cat# T8787 |
| Vectashield Mounting Medium | Vector | Cat# H1000 |
| Scheneider’s Drosophila Medium | Thermo Fisher Scientific | Cat# 21720024 |
| Tetramethylrhodamine, Ethyl Ester, Perchlorate (TMRE) | Thermo Fisher Scientific | Cat# T669 |
| Sucrose | Sigma Aldrich | Cat# S9378 |
| Tris Base | Sigma Aldrich | Cat# 10708976001 |
| Magnesium Chloride | Sigma Aldrich | Cat# M8266 |
| Critical Commercial Assays | ||
| cOmplete ULTRA Tablets, Mini, EDTA-free, EASYpack Protease Inhibitor Cocktail | Sigma Aldrich | Cat# 5892791001 |
| Protein A conjugated 10nm gold nanoparticles | Cytodiagnostics | Cat# AC-10–05 |
| MitoSOX™ | Thermo Fisher Scientific | Cat# M36008 |
| MitoTracker® Green | Thermo Fisher Scientific | Cat# M7514 |
| RevertAid Reverse Transcriptase | Thermo Fisher Scientific | Cat# EP0442 |
| RiboLock RNase Inhibitor | Thermo Fisher Scientific | Cat# E0382 |
| DNase I, RNase-free | Thermo Fisher Scientific | Cat# EN0521 |
| Random Hexamer Primer | Thermo Fisher Scientific | Cat# SO142 |
| dNTP Set 100 mM Solutions | Thermo Fisher Scientific | Cat# R0181 |
| EDTA (0.5 M), pH 8.0 | Thermo Fisher Scientific | Cat# R1021 |
| PowerUp SYBR Green Master Mix | Thermo Fisher Scientific | Cat# A25777 |
| ECL Prime Western Blotting System | Sigma Aldrich | Cat# GERPN2232 |
| Experimental Models: Organisms/Strains | ||
| D. melanogaster: w1118;UAS-dp62-HA | de Castro et al., 2013 | N/A |
| D. melanogaster: w1118;UAS-dp62-GFP | Thomas P. Neufeld (University of Minnesota, USA) | N/A |
| D. melanogaster: UAS-Drp1K38A | Park et al., 2009 | N/A |
| D. melanogaster: daughterless-GeneSwitch | H. Tricoire (University Paris Diderot-Paris7, Paris, France) | N/A |
| D. melanogaster: Elav-GeneSwitch(ElavGS) | H. Keshishian (Yale University, New Haven, CT, USA) | N/A |
| D. melanogaster: UAS-mito-QC | Lee et al., 2018 | N/A |
| D. melanogaster: mCherry-Atg8a | Denton et al., 2012 | N/A |
| D. melanogaster: white1118 | Bloomington Drosophila Stock Center | BDSC: 3605 |
| D. melanogaster: UAS-GFP-dsRNA | Bloomington Drosophila Stock Center | BDSC: 9330 |
| D. melanogaster: UAS-Atg1-RNAi | Vienna Drosophila RNAi Center | VDRC: 16133 |
| D. melanogaster: UAS-Atg2-RNAi | Vienna Drosophila RNAi Center | VDRC: 108447 |
| D. melanogaster: UAS-Atg5-RNAi | Vienna Drosophila RNAi Center | VDRC: 104461 |
| D. melanogaster: UAS-Atg13-RNAi | Vienna Drosophila RNAi Center | VDRC: 103381 |
| D. melanogaster: UAS-parkin-RNAi | Vienna Drosophila RNAi Center | VDRC: 104363 |
| Oligonucleotides | ||
| Primer for Act5C (Fwrd) | TTGTCTGGGCAAGAGGATCAG | N/A |
| Primer for Act5C (Rev) | ACCACTCGCACTTGCACTTTC | N/A |
| Primer for Dp62 (Fwrd) | CGTAAGGACCTTCTGGATCG | N/A |
| Primer for Dp62 (Rev) | GTGCATATTGCTCTCGCACT | N/A |
| Primer for Atg8a (Fwrd) | AGTCCCAAAAGCAAACGAAG | N/A |
| Primer for Atg8a (Rev) | TTGTCCAAATCACCGATGC | N/A |
| Primer for Hsp60 (Fwrd) | TGATGCTGATCTCGTCAAGC | N/A |
| Primer for Hsp60 (Rev) | TACTCGGAGGTGGTGTCCTC | N/A |
| Primer for Hsc 70–5 (Fwrd) | GGAATTGATATCCGCAAGGA | N/A |
| Primer for Hsc 70–5 (Rev) | TCAGCTTCAGGTTCATGTGC | N/A |
| Primer for Hsp10 (Fwrd) | CCCGCATCTAGCGAGAATAG | N/A |
| Primer for Hsd10 (Rev) | CTCCTTTCGTCTTGGTCAGC | N/A |
Highlights.
Upregulating p62 from midlife onward prolongs fly lifespan and health span
Midlife p62 induction improves proteostasis, in aged flies, via autophagy
Midlife p62 induction promotes mitochondrial fission and mitophagy in aged flies
Mitochondrial fission and autophagy are required for midlife p62-mediated longevity
ACKNOWLEDGMENTS
We thank L. Miguel Martins and Alex Whitworth (University of Cambridge), Vienna Drosophila RNAi Center, and the Drosophila Stock Center (Bloomington) for fly stocks; Mary C. Onglatco and Lyndon C. Bui for help with fly work; and Chunni Zhu for help with immunogold labelling and electron microscopy. Stocks obtained from the Bloomington Drosophila Stock Center (NIH P40OD018537) were used in this study. This work was supported by NIH grants (R01AG037514, R01AG049157, and R01AG040288) to D.W.W. This research was conducted while D.W.W. was a Julie Martin Mid-Career Awardee in Aging Research supported by The Ellison Medical Foundation and AFAR.
Footnotes
DECLARATION OF INTERESTS
The authors declare no competing interests.
SUPPLEMENTAL INFORMATION
Supplemental Information can be found online at https://doi.org/10.1016/j.celrep.2019.06.070.
REFERENCES
- Ashrafi G, and Schwarz TL (2013). The pathways of mitophagy for quality control and clearance of mitochondria. Cell Death Differ. 20, 31–42. [DOI] [PMC free article] [PubMed] [Google Scholar]
- Avila A, Silverman N, Diaz-Meco MT, and Moscat J (2002). The Drosophila atypical protein kinase C-ref(2)p complex constitutes a conserved module for signaling in the toll pathway. Mol. Cell. Biol 22, 8787–8795. [DOI] [PMC free article] [PubMed] [Google Scholar]
- Bangham J, Obbard DJ, Kim KW, Haddrill PR, and Jiggins FM (2007). The age and evolution of an antiviral resistance mutation in Drosophila melanogaster. Proc. Biol. Sci 274, 2027–2034. [DOI] [PMC free article] [PubMed] [Google Scholar]
- Chang YY, and Neufeld TP (2009). An Atg1/Atg13 complex with multiple roles in TOR-mediated autophagy regulation. Mol. Biol. Cell 20, 2004–2014. [DOI] [PMC free article] [PubMed] [Google Scholar]
- Chang JT, Kumsta C, Hellman AB, Adams LM, and Hansen M (2017). Spatiotemporal regulation of autophagy during Caenorhabditis elegans aging. eLife 6, e18459. [DOI] [PMC free article] [PubMed] [Google Scholar]
- Cho HM, Ryu JR, Jo Y, Seo TW, Choi YN, Kim JH, Chung JM, Cho B, Kang HC, Yu SW, et al. (2019). Drp1-Zip1 interaction regulates mitochondrial quality surveillance system. Mol. Cell 73, 364–376.e8. [DOI] [PubMed] [Google Scholar]
- D’Amico D, Mottis A, Potenza F, Sorrentino V, Li H, Romani M, Lemos V, Schoonjans K, Zamboni N, Knott G, et al. (2019). The RNA-binding protein PUM2 impairs mitochondrial dynamics and mitophagy during aging. Mol. Cell 73, 775–787.e10. [DOI] [PMC free article] [PubMed] [Google Scholar]
- Dambroise E, Monnier L, Ruisheng L, Aguilaniu H, Joly JS, Tricoire H, and Rera M (2016). Two phases of aging separated by the Smurf transition as a public path to death. Sci. Rep 6, 23523. [DOI] [PMC free article] [PubMed] [Google Scholar]
- de Castro IP, Costa AC, Celardo I, Tufi R, Dinsdale D, Loh SH, and Martins LM (2013). Drosophila ref(2)P is required for the parkin-mediated suppression of mitochondrial dysfunction in pink1 mutants. Cell Death Dis. 4, e873. [DOI] [PMC free article] [PubMed] [Google Scholar]
- Denton D, Chang TK, Nicolson S, Shravage B, Simin R, Baehrecke EH, and Kumar S (2012). Relationship between growth arrest and autophagy in midgut programmed cell death in Drosophila. Cell Death Differ. 19, 1299–1307. [DOI] [PMC free article] [PubMed] [Google Scholar]
- Ding WX, Ni HM, Li M, Liao Y, Chen X, Stolz DB, Dorn GW 2nd, and Yin XM (2010). Nix is critical to two distinct phases of mitophagy, reactive oxygen species-mediated autophagy induction and Parkin-ubiquitin-p62-mediated mitochondrial priming. J. Biol. Chem 285, 27879–27890. [DOI] [PMC free article] [PubMed] [Google Scholar]
- Du Y, Wooten MC, Gearing M, and Wooten MW (2009). Age-associated oxidative damage to the p62 promoter: implications for Alzheimer disease. Free Radic. Biol. Med 46, 492–501. [DOI] [PMC free article] [PubMed] [Google Scholar]
- Feng Y, He D, Yao Z, and Klionsky DJ (2014). The machinery of macroautophagy. Cell Res. 24, 24–41. [DOI] [PMC free article] [PubMed] [Google Scholar]
- Fernández AF, Sebti S, Wei Y, Zou Z, Shi M, McMillan KL, He C, Ting T, Liu Y, Chiang WC, et al. (2018). Disruption of the beclin 1-BCL2 autophagy regulatory complex promotes longevity in mice. Nature 558, 136–140. [DOI] [PMC free article] [PubMed] [Google Scholar]
- Geisler S, Holmström KM, Skujat D, Fiesel FC, Rothfuss OC, Kahle PJ, and Springer W (2010). PINK1/Parkin-mediated mitophagy is dependent on VDAC1 and p62/SQSTM1. Nat. Cell Biol 12, 119–131. [DOI] [PubMed] [Google Scholar]
- Hansen M, Rubinsztein DC, and Walker DW (2018). Autophagy as a promoter of longevity: insights from model organisms. Nat. Rev. Mol. Cell Biol 19, 579–593. [DOI] [PMC free article] [PubMed] [Google Scholar]
- Hoppins S, Lackner L, and Nunnari J (2007). The machines that divide and fuse mitochondria. Annu. Rev. Biochem 76, 751–780. [DOI] [PubMed] [Google Scholar]
- Ja WW, Carvalho GB, Mak EM, de la Rosa NN, Fang AY, Liong JC, Brummel T, and Benzer S (2007). Prandiology of Drosophila and the CAFE assay. Proc. Natl. Acad. Sci. USA 104, 8253–8256. [DOI] [PMC free article] [PubMed] [Google Scholar]
- Johansen T, and Lamark T (2011). Selective autophagy mediated by autophagic adapter proteins. Autophagy 7, 279–296. [DOI] [PMC free article] [PubMed] [Google Scholar]
- Katsuragi Y, Ichimura Y, and Komatsu M (2015). p62/SQSTM1 functions as a signaling hub and an autophagy adaptor. FEBS J. 282, 4672–4678. [DOI] [PubMed] [Google Scholar]
- Kaushik S, and Cuervo AM (2015). Proteostasis and aging. Nat. Med 21, 1406–1415. [DOI] [PubMed] [Google Scholar]
- Klionsky DJ, Abdelmohsen K, Abe A, Abedin MJ, Abeliovich H, Acevedo Arozena A, Adachi H, Adams CM, Adams PD, Adeli K, et al. (2016). Guidelines for the use and interpretation of assays for monitoring autophagy (3rd edition). Autophagy 12, 1–222. [DOI] [PMC free article] [PubMed] [Google Scholar]
- Komatsu M, Waguri S, Koike M, Sou YS, Ueno T, Hara T, Mizushima N, Iwata J, Ezaki J, Murata S, et al. (2007). Homeostatic levels of p62 control cytoplasmic inclusion body formation in autophagy-deficient mice. Cell 131, 1149–1163. [DOI] [PubMed] [Google Scholar]
- Kwon J, Han E, Bui CB, Shin W, Lee J, Lee S, Choi YB, Lee AH, Lee KH, Park C, et al. (2012). Assurance of mitochondrial integrity and mammalian longevity by the p62-Keap1-Nrf2-Nqo1 cascade. EMBO Rep. 13, 150–156. [DOI] [PMC free article] [PubMed] [Google Scholar]
- Lapierre LR, De Magalhaes Filho CD, McQuary PR, Chu CC, Visvikis O, Chang JT, Gelino S, Ong B, Davis AE, Irazoqui JE, et al. (2013). The TFEB orthologue HLH-30 regulates autophagy and modulates longevity in Caenorhabditis elegans. Nat. Commun 4, 2267. [DOI] [PMC free article] [PubMed] [Google Scholar]
- Lee JY, Nagano Y, Taylor JP, Lim KL, and Yao TP (2010). Disease-causing mutations in parkin impair mitochondrial ubiquitination, aggregation, and HDAC6-dependent mitophagy. J. Cell Biol 189, 671–679. [DOI] [PMC free article] [PubMed] [Google Scholar]
- Lee JJ, Sanchez-Martinez A, Zarate AM, Benincá C, Mayor U, Clague MJ, and Whitworth AJ (2018). Basal mitophagy is widespread in Drosophila but minimally affected by loss of Pink1 or parkin. J. Cell Biol 217, 1613–1622. [DOI] [PMC free article] [PubMed] [Google Scholar]
- Levine B, and Kroemer G (2008). Autophagy in the pathogenesis of disease. Cell 132, 27–42. [DOI] [PMC free article] [PubMed] [Google Scholar]
- Liu Y, and Levine B (2015). Autosis and autophagic cell death: the dark side of autophagy. Cell Death Differ. 22, 367–376. [DOI] [PMC free article] [PubMed] [Google Scholar]
- Mao K, Wang K, Liu X, and Klionsky DJ (2013).The scaffold protein Atg11 recruits fission machinery to drive selective mitochondria degradation by autophagy. Dev. Cell 26, 9–18. [DOI] [PMC free article] [PubMed] [Google Scholar]
- McWilliams TG, Prescott AR, Allen GF, Tamjar J, Munson MJ, Thomson C, Muqit MM, and Ganley IG (2016). mito-QC illuminates mitophagy and mitochondrial architecture in vivo. J. Cell Biol 214, 333–345. [DOI] [PMC free article] [PubMed] [Google Scholar]
- Narendra D, Tanaka A, Suen DF, and Youle RJ (2008). Parkin is recruited selectively to impaired mitochondria and promotes their autophagy. J. Cell Biol 183, 795–803. [DOI] [PMC free article] [PubMed] [Google Scholar]
- Narendra D, Kane LA, Hauser DN, Fearnley IM, and Youle RJ (2010). p62/SQSTM1 is required for Parkin-induced mitochondrial clustering but not mitophagy; VDAC1 is dispensable for both. Autophagy 6, 1090–1106. [DOI] [PMC free article] [PubMed] [Google Scholar]
- Nezis IP, Simonsen A, Sagona AP, Finley K, Gaumer S, Contamine D, Rusten TE, Stenmark H, and Brech A (2008). Ref(2)P, the Drosophila melanogaster homologue of mammalian p62, is required for the formation of protein aggregates in adult brain. J. Cell Biol 180, 1065–1071. [DOI] [PMC free article] [PubMed] [Google Scholar]
- Osterwalder T, Yoon KS, White BH, and Keshishian H (2001). A conditional tissue-specific transgene expression system using inducible GAL4. Proc. Natl. Acad. Sci. USA 98, 12596–12601. [DOI] [PMC free article] [PubMed] [Google Scholar]
- Pankiv S, Clausen TH, Lamark T, Brech A, Bruun JA, Øutzen H, 0ver-vatn A, Bjørkøy G, and Johansen T (2007). p62/SQSTM1 binds directly to Atg8/LC3 to facilitate degradation of ubiquitinated protein aggregates by autophagy. J. Biol. Chem 282, 24131–24145. [DOI] [PubMed] [Google Scholar]
- Park J, Lee G, and Chung J (2009). The PINK1-Parkin pathway is involved in the regulation of mitochondrial remodeling process. Biochem. Biophys. Res. Commun 378, 518–523. [DOI] [PubMed] [Google Scholar]
- Pyo JO, Yoo SM, Ahn HH, Nah J, Hong SH, Kam TI, Jung S, and Jung YK (2013). Overexpression of Atg5 in mice activates autophagy and extends lifespan. Nat. Commun 4, 2300. [DOI] [PMC free article] [PubMed] [Google Scholar]
- Rambold AS, Kostelecky B, Elia N, and Lippincott-Schwartz J (2011). Tubular network formation protects mitochondria from autophagosomal degradation during nutrient starvation. Proc. Natl. Acad. Sci. USA 108, 10190–10195. [DOI] [PMC free article] [PubMed] [Google Scholar]
- Ramesh Babu J, Lamar Seibenhener M, Peng J, Strom AL, Kemppainen R, Cox N, Zhu H, Wooten MC, Diaz-Meco MT, Moscat J, and Wooten MW (2008). Genetic inactivation of p62 leads to accumulation of hyperphosphorylated tau and neurodegeneration. J. Neurochem 106, 107–120. [DOI] [PubMed] [Google Scholar]
- Rana A, Rera M, and Walker DW (2013). Parkin overexpression during aging reduces proteotoxicity, alters mitochondrial dynamics, and extends lifespan. Proc. Natl. Acad. Sci. USA 110, 8638–8643. [DOI] [PMC free article] [PubMed] [Google Scholar]
- Rana A, Oliveira MP, Khamoui AV, Aparicio R, Rera M, Rossiter HB, and Walker DW (2017). Promoting Drp1-mediated mitochondrial fission in midlife prolongs healthy lifespan of Drosophila melanogaster. Nat. Commun 8, 448. [DOI] [PMC free article] [PubMed] [Google Scholar]
- Rera M, Bahadorani S, Cho J, Koehler CL, Ulgherait M, Hur JH, Ansari WS, Lo T Jr., Jones DL, and Walker DW (2011). Modulation of longevity and tissue homeostasis by the Drosophila PGC-1 homolog. Cell Metab. 14, 623–634. [DOI] [PMC free article] [PubMed] [Google Scholar]
- Rera M, Clark RI, and Walker DW (2012). Intestinal barrier dysfunction links metabolic and inflammatory markers of aging to death in Drosophila. Proc. Natl. Acad. Sci. USA 109, 21528–21533. [DOI] [PMC free article] [PubMed] [Google Scholar]
- Simonsen A, Cumming RC, Brech A, Isakson P, Schubert DR, and Finley KD (2008). Promoting basal levels of autophagy in the nervous system enhances longevity and oxidant resistance in adult Drosophila. Autophagy 4, 176–184. [DOI] [PubMed] [Google Scholar]
- Stolz A, Ernst A, and Dikic I (2014). Cargo recognition and trafficking in selective autophagy. Nat. Cell Biol 16, 495–501. [DOI] [PubMed] [Google Scholar]
- Sun N, Youle RJ, and Finkel T (2016). The mitochondrial basis of aging. Mol. Cell 61, 654–666. [DOI] [PMC free article] [PubMed] [Google Scholar]
- Twig G, and Shirihai OS (2011). The interplay between mitochondrial dynamics and mitophagy. Antioxid. Redox Signal 14, 1939–1951. [DOI] [PMC free article] [PubMed] [Google Scholar]
- Twig G, Elorza A, Molina AJ, Mohamed H, Wikstrom JD, Walzer G, Stiles L, Haigh SE, Katz S, Las G, et al. (2008). Fission and selective fusion govern mitochondrial segregation and elimination by autophagy. EMBO J. 27, 433–46. [DOI] [PMC free article] [PubMed] [Google Scholar]
- Ulgherait M, Rana A, Rera M, Graniel J, and Walker DW (2014). AMPK modulates tissue and organismal aging in a non-cell-autonomous manner. Cell Rep. 8, 1767–1780. [DOI] [PMC free article] [PubMed] [Google Scholar]
- Wilhelm T, Byrne J, Medina R, Kolundžić E, Geisinger J, Hajduskova M, Tursun B, and Richly H (2017). Neuronal inhibition of the autophagy nucleation complex extends life span in post-reproductive C. elegans. Genes Dev. 31, 1561–1572. [DOI] [PMC free article] [PubMed] [Google Scholar]
- Yun J, and Finkel T (2014). Mitohormesis. Cell Metab. 19, 757–766. [DOI] [PMC free article] [PubMed] [Google Scholar]
Associated Data
This section collects any data citations, data availability statements, or supplementary materials included in this article.