

Summary
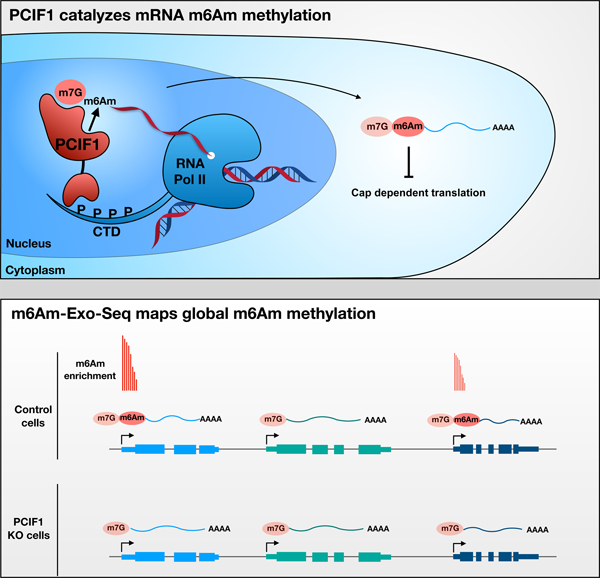
mRNA modifications play important roles in regulating gene expression. One of the abundant mRNA modifications is N6,2-O-dimethyladenosine (m6Am). Here, we demonstrate that m6Am is an evolutionarily conserved mRNA modification mediated by the Phosphorylated CTD Interacting Factor 1 (PCIF1), which catalyzes m6A methylation on 2-O-methylated adenine located at 5’ ends of mRNAs. Furthermore, PCIF1 catalyzes only 5’ m6Am methylation of capped mRNAs, but not internal m6A methylation in vitro and in vivo. To study the biological role of m6Am, we developed a robust methodology (m6Am-Exo-Seq) to map its transcriptome-wide distribution, which revealed no global crosstalk between m6Am and m6A under assayed conditions, suggesting that m6Am is functionally distinct from m6A. Importantly, we find that m6Am does not alter mRNA transcription or stability, but negatively impacts cap-dependent translation of methylated mRNAs. Together, we identify the only human mRNA m6Am methyltransferase and demonstrate a mechanism of gene regulation through PCIF1-mediated m6Am mRNA methylation.
Keywords: mRNA modifications, m6Am, PCIF1, translational regulation, transcriptional regulation, epitranscriptomics, cap-dependent translation, gene expression, m6Am-Exo-Seq
Graphical Abstract
eTOC Blurb
mRNA modifications play an important role in regulating gene expression. Sendinc et al. show that PCIF1 is the only human methyltransferase capable of generating a methylated base known as m6Am, which is restricted at the beginning of mRNA. Transcripts that have m6Am show reduced translation, in comparison with un-methylated transcripts, which suggests that this mark is important for gene regulation.
Introduction
An important step in the regulation of gene expression is accomplished through chemical modifications of mRNAs. One of the best studied internal mRNA modifications is N6-methyladenosine (m6A), which is present on a diverse set of mRNAs, typically clustered around stop codons (Dominissini et al., 2012; Meyer et al., 2012). m6A is catalyzed by METTL3/METTL14 complex, and this modification regulates gene expression by influencing localization, stability, splicing or translation of mRNAs (Yang et al., 2018). Another abundant mRNA modification is N6,2-O-dimethyladenosine (m6Am), which occurs near the mRNA cap (Wei et al., 1975). 5’ ends of eukaryotic mRNAs typically carry a 7-methylguanosine (m7G) cap linked to the rest of the mRNA by a triphosphate linkage. The first nucleotide after the m7G cap can be methylated on the ribose sugar. If this first nucleotide is 2-O-methyladeonisine (Am), it can be further methylated at its N6 position to generate m6Am (Figure 1A). While the methylase mediating Am methylation is known, the methyltransferase responsible for generating m6Am had not been identified (Keith et al., 1978; Mauer et al., 2017). As a consequence, the impact of m6Am on gene regulation is still largely unexplored.
Figure 1. m6Am is an evolutionarily conserved RNA modification that is restricted to 5’ end of mRNAs.
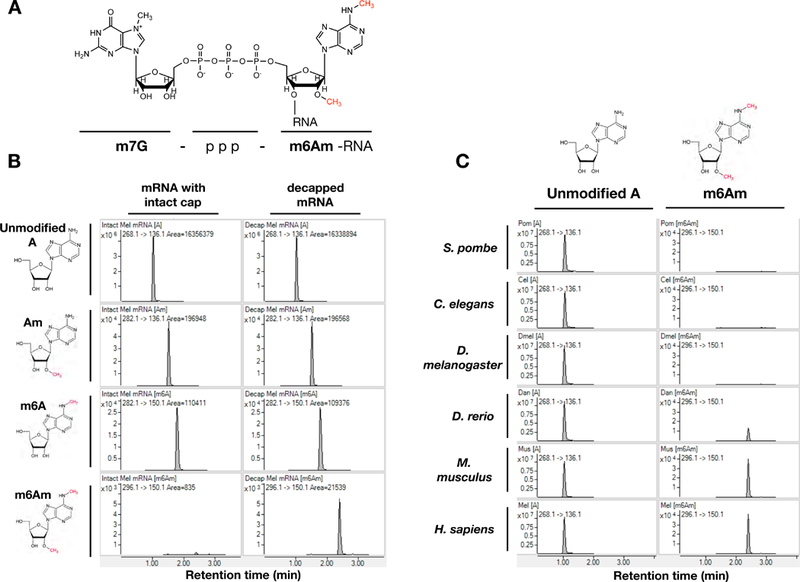
1A. Chemical structure of 5’ end of eukaryotic mRNA with m6Am methylation. 1B. MS spectra of mRNA from MEL624 human melanoma cell line with or without treatment by de-capping enzyme to remove m7G cap prior to digestion for MS analysis. m6Am is detectable only when mRNA is de-capped. 1C. MS spectra of de-capped mRNAs isolated from indicated organisms. Se also Figure S1.
Using multiple approaches, we provide both in vitro and in vivo evidence supporting Phosphorylated CTD Interacting Factor 1 (PCIF1) as the one and only mammalian mRNA m6Am methyltransferase. In order to investigate the distribution of m6Am on mRNAs, we developed a transcription-wide mapping technique we name m6Am-Exo-Seq. PRO-Seq, RNA-Seq and m6Am-Exo-Seq analyses carried out in wildtype and PCIF1 null cells show that mRNA stability of m6Am-enriched genes is largely unaffected by the loss of PCIF1. In contrast, reporter assays using mRNA transcripts with or without m6Am suggest that m6Am may function to suppress protein translation. Importantly, quantitative proteomics analyses of control and PCIF1 null cells also suggest a suppressive role for PCIF1 on protein translation. Taken together, our findings identify an enzyme that mediates m6Am methylation in the nucleus, which impacts translation in the cytoplasm.
Results
m6Am is an evolutionarily conserved RNA modification
To study the biological significance of m6Am, we developed a highly sensitive mass spectrometry approach (LC-MS/MS) to detect and quantify m6Am (Figure S1). The triphosphate bond between the m7G cap and the first nucleotide of the mRNA is not cleaved by the enzymes typically used to generate single nucleosides for LC-MS/MS analysis. Therefore, without the removal of the m7G cap, only the internal m6A and Am modifications are detectable in human mRNA (Figure 1B). On the other hand, m6Am is detectable only after treatment with a de-capping enzyme, indicating that m6Am is restricted to the first nucleotide adjacent to the m7G cap of the mRNA (Figure 1B) (Linder et al., 2015). Using this protocol, we analyzed mRNA isolated from various model organisms by LC-MS/MS. While m6Am was not detected in fission yeast, nematode or Drosophila samples, mRNA isolated from zebrafish, mouse and human cells yielded m6Am, indicating that m6Am is a conserved mRNA methylation in all vertebrate organisms we tested (Figure 1C).
PCIF1 is required for mRNA m6Am methylation in vivo
A putative methyltransferase enzyme that is conserved in zebrafish, mouse and human, but absent in yeast and nematodes, is PCIF1 (Phosphorylated CTD Interacting Factor (Figure S2) (Iyer et al., 2016). PCIF1 contains a N-terminal WW domain, which is believed to mediate interactions with RNA Polymerase II (Pol II) phospho-CTD, and also a putative C-terminal methyltransferase domain (Ebmeier et al., 2017; Fan et al., 2003). To determine whether PCIF1 is a m6Am methyltransferase, we generated several independent PCIF1 knockout (KO) clonal cell lines in human melanoma MEL624 cells and determined mRNA m6Am levels by LC-MS/MS (Fig. 2A and 2B). mRNA isolated from a control MEL624 cell line yielded around 0.04% m6Am/A ratio. Strikingly, knocking out PCIF1 resulted in a complete loss of this modification in mRNA samples (Figure 2B). We further verified the absence of m6Am in PCIF1 KO cells by performing thin layer chromatography (TLC) (Figures 2C and S3A). Although PCIF1 KO resulted in a complete loss of m6Am, global m6A levels did not change, suggesting that PCIF1 is not required for m6A modification and that m6A is not dependent on m6Am levels (Figure S3B).
Figure 2. PCIF1 is required for mRNA m6Am methylation in vivo.
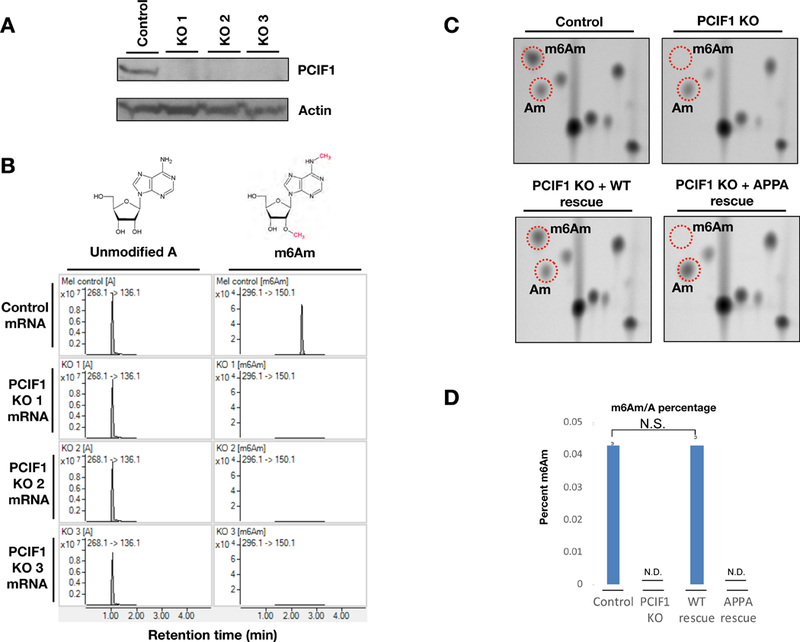
2A. Western blot analysis of control and three independent PCIF1 KO MEL624 cell lines with antibodies against endogenous PCIF1. Beta-actin is shown as a loading control. 2B. MS spectra of de-capped mRNA from control and three independent PCIF1 KO MEL624 cell lines. 2C. Thin-layer chromatography analysis of cap-adjacent nucleotides from mRNA isolated from control, PCIF1 KO and KO cells rescued with wild type or catalytic mutant PCIF1 (APPA). 2D. HPLC-MS/MS m6Am/A percentages of mRNAs from control, PCIF1 KO and KO cells rescued with wild type or catalytic mutant PCIF1 (APPA). (N.D., Not Detected; N.S., Not Significant with p<0.05). (n=3). Error bars depict standard error. See also Figure S2 and S3.
To determine whether it is the intrinsic enzymatic activity of PCIF1 that is responsible for m6Am methylation, we carried out rescue experiments by introducing either wild-type (WT) or catalytically inactive PCIF1 (APPA) back into the KO cells. While the expression of wild-type PCIF1 restored the global m6Am level in the KO cells, expression of the catalytic mutant with the conserved methyltransferase NPPF motif altered to APPA did not result in m6Am detectable by mass spectrometry or TLC (Figures 2C and 2D). PCIF1 contains a nuclear localization signal and has been suggested to be a nuclear protein (Ebmeier et al., 2017; Fan et al., 2003; Hirose et al., 2008). Consistently, we confirmed that PCIF1 is predominantly nuclear localized in both rescue cell lines by immunofluorescence (Figure S3C). These results indicate that PCIF1 is required for mRNA m6Am modification, which likely takes place in the nucleus.
Recombinant PCIF1 methylates capped mRNA in vitro
To determine whether this putative methyltransferase can directly catalyze m6Am, we purified full length recombinant PCIF1 from bacteria (Figure S4A) and performed in vitro methylation assays employing firefly luciferase mRNA with m7G-Am 5’ cap as a substrate. Wild-type recombinant enzyme generated m6Am efficiently, whereas the APPA catalytic mutant did not show any activity (Figures 3A and S4B). Furthermore, PCIF1 did not generate m6A or Am modifications. On the other hand, the generation of m6Am was accompanied by a decrease in the Am level, indicating that PCIF1 catalyzed conversion of Am to m6Am (Figure 3A). Consistent with previous findings (Kruse et al., 2011; Mauer et al., 2017), we failed to detect cap-adjacent m6A by TLC and PCIF1 KO cells show a greater accumulation of cap-adjacent Am (Figure S3A). These in vitro and in vivo data collectively suggest that PCIF1 specifically methylates Am-marked mRNAs.
Figure 3. Recombinant PCIF1 methylates capped mRNA in vitro.
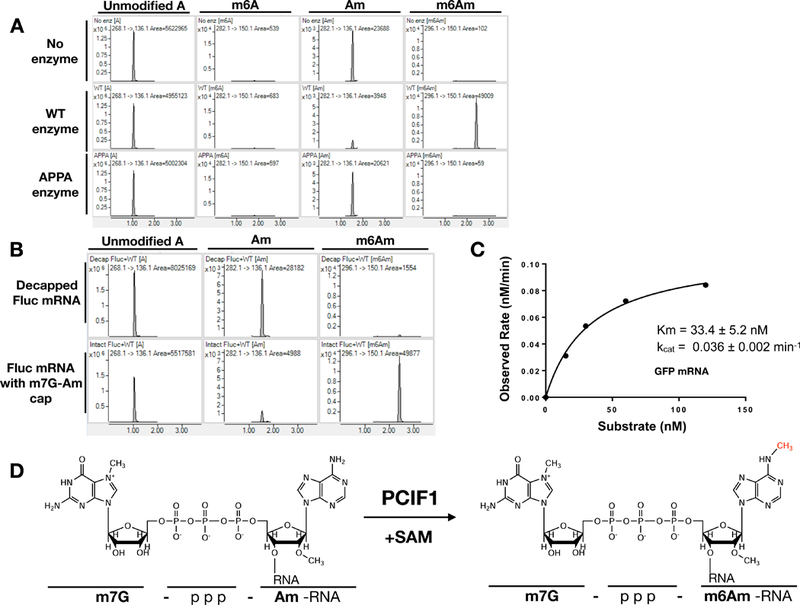
3A. Firefly luciferase mRNA with m7G-Am cap structure is methylated with wild-type or catalytic mutant recombinant PCIF1 in vitro. The methylation pattern of mRNA was analyzed by LC-MS/MS. 3B. In vitro methylation assays were performed with recombinant PCIF1 enzyme using de-capped firefly luciferase mRNA or mRNA with intact m7G-Am cap. 3C. Michaelis–Menten kinetics of recombinant PCIF1 was determined using m7G-Am capped GFP mRNA by LC-MS/MS analysis. 3D. Chemical structures of PCIF1 substrate and product. See also Figure S4.
We next investigated whether the m7G cap structure is required for the catalytic activity of PCIF1, using de-capped luciferase mRNA with 5’ Am in in vitro methylation assays. The Am residue next to the intact m7G cap was readily converted to m6Am by recombinant PCIF1. In contrast, the Am residue on de-capped mRNA was not converted to m6Am, indicating that m7G cap is required for PCIF1 catalytic activity (Figure 3B). We then determined the methylation kinetics of PCIF1 using a full-length capped GFP mRNA. PCIF1 was able to efficiently methylate the full-length mRNA with a Km of 33.4 nM and Kcat at 0.036 min−1 (Figure 3C). Moreover, a capped RNA dinucleotide (m7G-AmG) can also be methylated, albeit less efficiently ( Km =208 nM and Kcat =0.34 min−1) (Figure S4B). Given that PCIF1 requires mRNA cap for its enzymatic activity (Figure 3B) and capping of nascent mRNA occurs when it is at least ~20–25 nucleotides in length (Shatkin and Manley, 2000), we believe the relevant in vivo substrate for this enzyme to be capped nascent RNA that is at least ~20–25 nucleotides in length and Am methylated. Since recombinant PCIF1 efficiently methylates capped mRNAs in vitro and deletion of PCIF1 results in a complete loss of mRNA m6Am methylation in vivo, we conclude that PCIF1 is the only mRNA m6Am methyltransferase in human cells.
Loss of PCIF1 does not affect global mRNA m6A distribution in vivo
In order to identify the mRNAs that carry m6A and m6Am, we performed MeRIP-Seq with an antibody against m6A in control and PCIF1 KO cell lines. Given that m6A and m6Am are structurally similar, antibodies against m6A are expected to enrich for m6Am at the 5’ end of the mRNAs, as has been previously suggested (Linder et al., 2015). However, although we were able to identify internal m6A loci enriched around stop codons, as reported previously for other cell lines (Dominissini et al., 2012; Meyer et al., 2012), we observed a very modest enrichment at the 5’ end of mRNAs that was mostly maintained in the PCIF1 KO cells (Figures 4 and 5A). Therefore, it appears that the regular m6A MeRIP-Seq protocol does not efficiently capture m6Am-enriched transcripts. In agreement with our in vitro and in vivo results (Figures 3A and S3B), global m6A distribution did not change in two independent PCIF1 KO lines, compared to control cells (Figure 4A and 4B). Deletion of PCIF1, and hence complete loss of m6Am, altered neither global m6A level (Figure S3B) nor genome-wide m6A distribution (Figure 4A), suggesting that m6A and m6Am are independent mRNA modifications. Our results, however, do not exclude possible interactions of these two modifications under other conditions such as stress.
Figure 4. Loss of PCIF1 does not affect global mRNA m6A distribution in vivo.
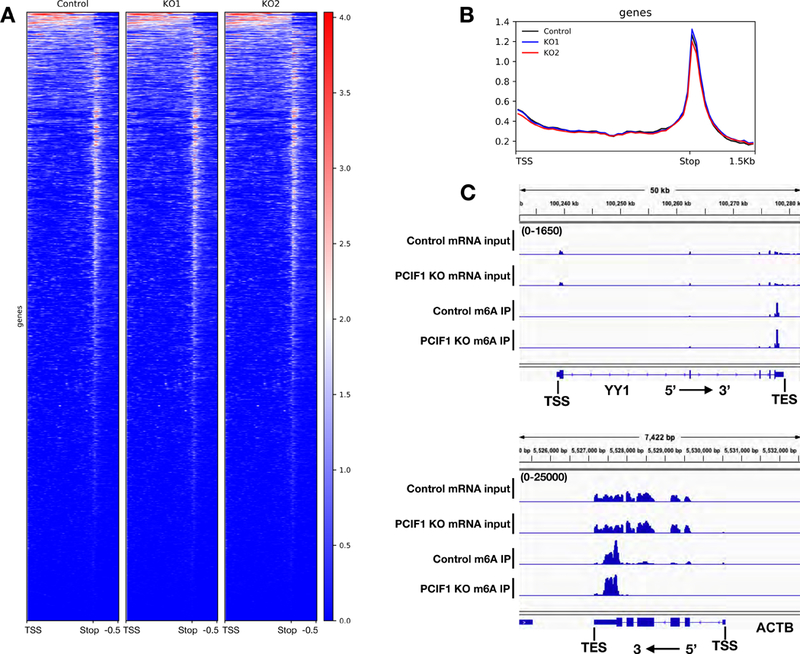
4A. Heat map of m6A enrichment over Input of genes overlapping with m6A peaks (n=4,460) in MEL624 cell line determined by m6A MeRIP-Seq in control and two independent PCIF1 KO cell lines. 4B. Metagene plots of m6A enrichment over Input of genes overlapping with m6A peaks (n=4,460) in MEL624 cell line determined by m6A MeRIP-Seq in control and two independent PCIF1 KO cell lines. 4C. Genome browser views of two examples genes with m6A enrichment near stop codon. Scale for top tracks: 0–1,650 FPKM. Scale for bottom tracks: 0–25,000 FPKM.
Figure 5. m6Am-Exo-Seq as a robust methodology that enables global m6Am mapping.
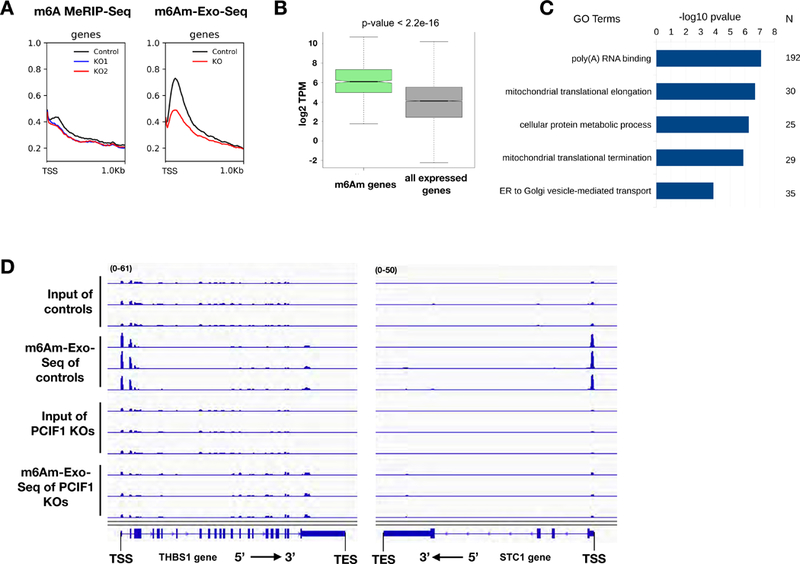
5A. Metagene plots of m6A(m) enrichment over Input near TSS of all expressed genes (n=15,258) in MEL624 cells employing either m6A MeRIP-Seq or m6Am-Exo-Seq methodology in control and PCIF1 KO cells. 5B. Boxplots of expression level (log2 TPM) of m6Am mRNAs (n=1,521) vs. all mRNAs expressed in MEL624 cell line (n=15,258). The observed difference is significant (p-value < 2.2e-16) using a Mann-Whitney test. Box plots show the 25th–75th percentiles and error bars depict the 10th–90th percentiles. 5C. Biological process Gene Ontology (GO) terms which have FDR<0.05 identified by DAVID 6.8 5D. Genome browser views of 2 example genes with m6Am enrichment using m6Am-Exo-Seq. Scale for left tracks: 0–61 FPKM. Scale for right tracks: 0–50 FPKM. See also Figure S5 and Table S1.
Development of m6Am-Exo-Seq as a robust methodology that enables global m6Am mapping
To be able to map m6Am modification transcriptome-wide, we developed an exonuclease assisted high-throughput sequencing methodology that we call m6Am-Exo-Seq (Figure S5). We reasoned that enrichment of mRNA 5’ ends would enrich for m6Am and deplete the internal m6A loci located mostly around stop codons. To achieve that, mRNA is uniformly fragmented and treated with a 5’ exonuclease to eliminate uncapped fragments, resulting in a pool of capped mRNA 5’ end fragments enriched for m6Am and depleted for internal 3’ m6A. To further enhance m6Am recognition by the m6A antibody, capped RNA 5’ end fragments are de-capped to expose the m6Am residues. The resulting RNA is immunoprecipitated using a m6A antibody and analyzed by high throughput sequencing (Figure S5A). We performed m6Am-Exo-Seq on mRNA from control and PCIF1 KO cells using 8 different m6A antibodies. Our technique allowed us to observe a clear enrichment of 5’ ends immediate to transcription start sites only in mRNAs from control cells, but not in mRNAs from PCIF1 KO cells, suggesting that m6Am-Exo-Seq specifically pull-down m6Am-enriched transcripts (Figure 5A). Seven out of the eight m6A antibodies tested with m6Am-Exo-Seq resulted in a significant enrichment of m6Am only in control mRNA, demonstrating the robustness of this methodology (Figure S5B).
To globally map m6Am, we applied m6Am-Exo-Seq with a monoclonal m6A antibody in MEL624 cell line using three biological replicates of control and PCIF1 KO cells (Figure 5). We identified 1,521 genes that are enriched for this modification (Table S1). These transcripts are among the highly expressed genes in MEL624 cell line (Figure 5B), and are in diverse pathways including poly(A) RNA binding, protein metabolic processes and mitochondrial translation (Figures 5B and 5C). m6Am was also mapped in HEK293T cells previously (Linder et al., 2015). While ~50% of the m6Am transcripts are methylated in both HEK293T and MEL624 cells, the other half of m6Am transcripts are unique to MEL624 cells (Figure S6A). Since m6Am can be removed by FTO (Mauer et al., 2017; Wei et al., 2018), our results suggest that m6Am is a dynamic epitranscriptomic mark with cell-type specific patterns.
PCIF1-mediated deposition of m6Am does not alter transcription or stability of target genes.
PCIF1 interacts with the phosphorylated C-terminal domain (CTD) of Pol II, and has been implicated in negative regulation of gene expression (Ebmeier et al., 2017; Fan et al., 2003; Hirose et al., 2008). However, recent studies suggest that deposition of m6Am stabilizes mRNA or stimulates translation (Mauer et al., 2017), both of which would increase the expression of target genes. On the other hand, a separate study failed to find a correlation between m6Am methylation and mRNA stability (Wei et al., 2018). We thus wished to investigate the mechanism of m6Am activity in our system, where we can precisely abolish m6Am by PCIF1 KO, without perturbing m6A levels. We first performed RNA-Seq in PCIF1 KO MEL624 cells and a control cell line. We defined 236 mRNA species that were significantly more abundant in both PCIF1 KO cell lines, and 304 mRNAs with reduced abundance (Figure 6A, Tables S2 and S3). Notably, these changes in mRNA levels could be due to altered transcription mediated by m6Am, or altered RNA stability, without concomitant changes in transcription. To distinguish between these possibilities, we performed PRO-Seq in control and PCIF1 KO cells. PRO-Seq specifically measures engaged Pol II across the genome, providing definitive information on levels of nascent transcription (Kwak et al., 2013). These assays were spike normalized to enable accurate quantification and comparisons between samples (see methods). PRO-Seq signals across the 236 up-regulated genes from RNA-Seq revealed that these genes were more highly transcribed in PCIF1 KO cells (Figure 6B). Likewise, down-regulated genes were less actively transcribed (Figure 6B). Importantly, there was a strong correlation between the changes observed in RNA-Seq and PRO-Seq, indicating that changes in RNA abundance could be explained fully by altered transcription (r=0.67, Figure 6C), without evidence for RNA stability changes.
Figure 6. PCIF1-mediated deposition of m6Am does not alter transcription or stability of target genes.
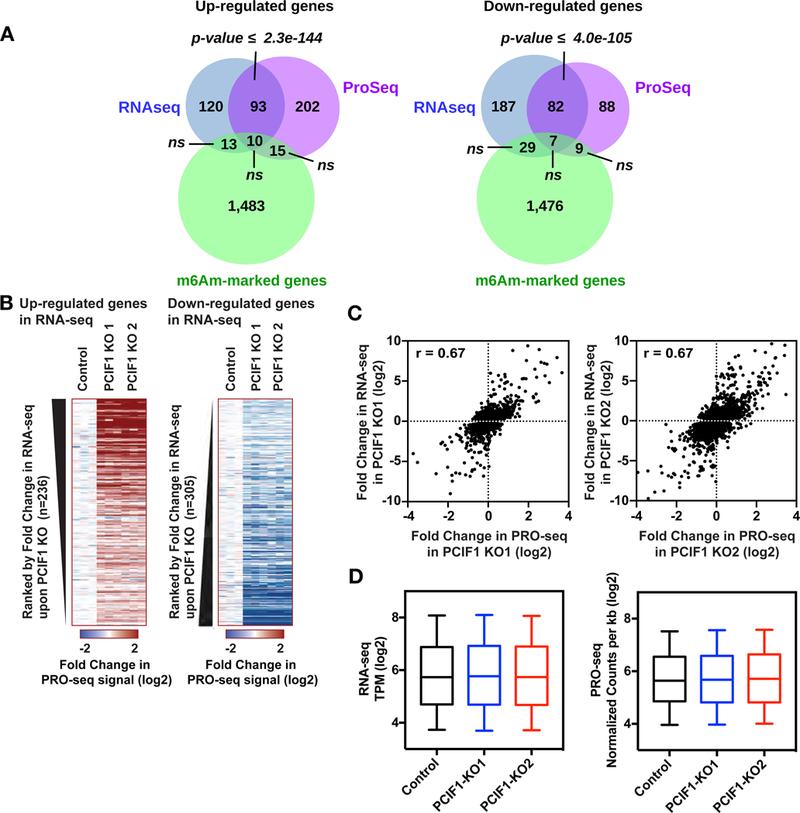
6A. Venn diagrams displaying overlap between m6Am-enriched genes in MEL624 cells and genes identified as significantly upregulated (left) or downregulated (right) in both PCIF1 KO MEL624 cell lines, by RNA-Seq and PRO-Seq. P-values are calculated with a hypergeometric test. 6B. Heatmaps of PRO-Seq signal at genes found to be up- or down-regulated using RNA-Seq in PCIF1 KO cells. Shown are the fold changes in PRO-Seq signal across the bodies of genes up-regulated in RNA-Seq (left) or down-regulated in RNA-Seq (right). Genes are ranked from most upregulated to least (at left) and least down-regulated to most (at right), demonstrating that PRO-Seq signal scales with results from RNA-seq. 6C. Scatter plots displaying the correlation of RNA-Seq vs PRO-Seq KO/control fold change signal. Only genes that have a fold change > 1.2 according to RNA-Seq in KO1 or KO2 were plotted. The total number of genes used in KO1 plot is 5,774 and KO2 is 5,580. Both KOs have the same Pearson correlation value of 0.67. 6D. RNA-Seq signal (left) and normalized PRO-Seq signal (right) within 1,521 m6Am-enriched genes in Control MELF624 cells, as compared to PCIF1 KO cells. Box plots show the 25th–75th percentiles and error bars depict the 10th–90th percentiles. Differences are not significant (P > 0.01). P-values were calculated using the Mann-Whitney test. See also Figure S6 and Tables S2, S3, S4 and S5.
Interestingly, we noted no significant overlap between m6Am-enriched genes and genes with significantly altered signals in RNA-Seq or PRO-Seq assays (Figure 6A, Tables S1-S5). PCIF1 KO did not change RNA-Seq or PRO-Seq signal within m6Am-enriched genes as compared to controls (Figure 6D). Moreover, the loss of PCIF1 did not alter Pol II levels or distribution at noncoding snRNA genes that are marked by m6Am (Figure S6B) (Mauer et al., 2018; Wei et al., 2018). Taken together, our data suggest that although PCIF1 has been reported to bind RNA Pol II, it does not play a significant role in transcription at m6Am target genes. Moreover, steady-state transcript levels of m6Am-marked genes, as determined by RNA-Seq in PCIF1 KO cells, are not affected by the loss of this modification, suggesting that globally the stability of m6Am-marked mRNAs is not significantly affected by PCIF1-mediated methylation.
m6Am suppresses cap-dependent translation
mRNA 5’ cap plays an important role during eukaryotic translation initiation. We thus hypothesized that modification of the cap-adjacent adenine by PCIF1 to form m6Am may affect translation at the initiation step. To test this, we used well-established reporter assays to analyze the effect of m6Am on translation efficiency (Petersen et al., 2006). We first transfected PCIF1 KO cells or KO cells rescued with PCIF1 APPA catalytic mutant with EGFP mRNA with either m7G-Am or m7G-m6Am 5’ ends and determined the GFP signal by microscopy and flow cytometry (Figure 7A and S7A-D). Although both mRNAs are transfected with similar efficiencies, m6Am-EGFP transfected cells showed diminished GFP signal (Figures 7A–D, S7A and S7B), suggesting that m6Am-containing transcripts are translated less efficiently than the unmethylated counterparts in vivo. To further validate the effect of m6Am on translation and to investigate whether this effect is independent of the mRNA sequence, we performed in vitro translation assays using varying amounts of firefly luciferase mRNAs with cap adjacent Am or m6Am modifications, followed by luminometric quantification. Similar to our in vivo reporter assays, m6Am suppressed translation of luciferase mRNA in vitro (Figure 7E). Next, we investigated whether m6Am-mediated suppression is specific to cap-dependent translation by employing Am or m6Am methylated bi-cistronic mRNA transcripts in in vitro translation assays. m6Am suppressed the translation of cap-dependent firefly luciferase whereas IRES mediated translation of renilla luciferase was unaffected, indicating that m6Am specifically suppresses cap-dependent translation (Figure 7F).
Figure 7. m6Am suppresses cap-dependent translation.
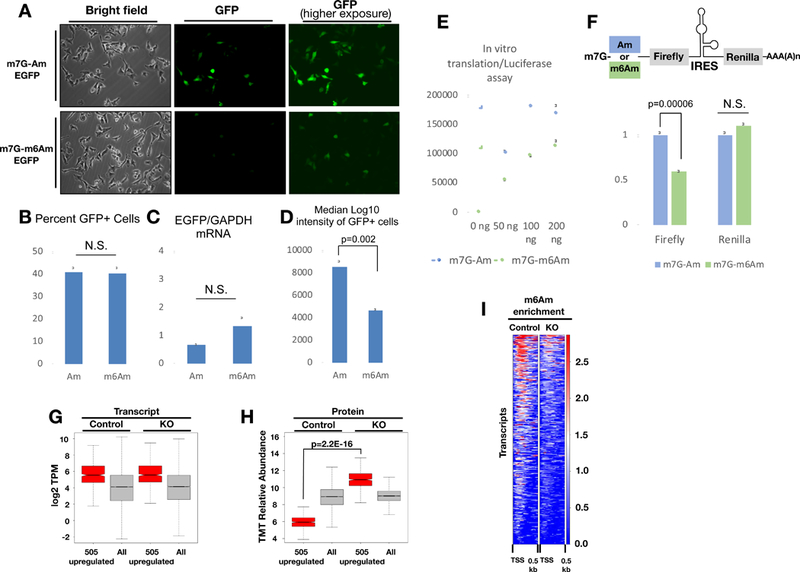
7A. EGFP mRNA that starts with either m7G-Am or m7G-m6Am was transfected into PCIF1 KO MEL624 cells. GFP signal was determined by fluorescence microscopy 24 hours post-transfection. 7B. The percentage of GFP positive cells from the experiment in 7A determined by flow cytometry (n=3 replicates). 7C. EGFP mRNA level from the cells in experiment 7A as determined by RT-qPCR. (n=3 replicates). 7D. Median fluorescence intensity of the cells from the experiment in 7A determined by flow cytometry. P-values in 7B-D are calculated using unpaired t-tests. (n=3 replicates). 7E. In vitro translation assays were carried out with indicated amounts of luciferase mRNA starting with m7G-Am or m7G-m6Am using rabbit reticulocyte system. Resulting luciferase signal was quantified on a plate reader. (n=4 replicates) 7F. In vitro translation assays were carried out with bicistronic construct that starts with m7G-Am or m7G-m6Am using rabbit reticulocyte system. Resulting firefly and renilla luciferase signals were quantified on a plate reader. (n=4 replicates). The p-values were calculated with an unpaired t-test. All error bars in this figure depict standard error. 7G. Boxplot displaying RNA-Seq transcript levels of all the expressed genes and also 505 proteins that are at least 50% upregulated in PCIF1 KO cells 7H. Boxplot displaying protein abundance (TMT relative abundance) corresponding to all detected proteins (5894) and also 505 proteins that are at least 50% upregulated in PCIF1 KO cells based on TMT based proteomic analysis of control and PCIF1 KO MEL624 cells. P-value was calculated using the Mann-Whitney test. 7I. Heatmap displaying m6Am-Exo-Seq based m6Am enrichment over Input of transcripts that correspond to the 505 proteins that are upregulated in PCIF1 KO cells. See also Figure S7 and Table S6.
To determine if PCIF1 plays a role in translation regulation in vivo, we performed Tandem Mass Tag (TMT) proteomic quantification in control and PCIF1 KO cells, which resulted in quantitative proteomics data on 5,894 proteins. After filtering out the proteins which show a significant transcript level change according to RNA-Seq data (60 of the detected proteins), we generated a list of proteins which significantly change in abundance specfically at the protein level but not at transcript level (Figure S7E). Strikingly, we found 505 proteins were significantly upregulated in PCIF1 KO cells, while only 17 showed a decrease in protein abundance with at least 50% change (Figure 7G and 7H, Table S6). Interestingly, m6Am enrichment in control cells was observed in transcripts from most of the upregulated proteins, while this enrichment is lost in the KO cells according to m6Am-Exo-Seq (Figure 7I). Thus, loss of PCIF1 and hence m6Am, correlates with increased protein abundance from a set of genes that are not altered at the transcript level. Indeed, we observed a significant overlap between all m6Am-enriched genes and translationally upregulated genes without transcriptional changes (Figure S7F). In summary, both our in vitro reporter assays and in vivo proteomics data strongly implicate PCIF1-mediated m6Am in negatively regulating translation in vivo (Figure S7E).
Discussion
In this study, we uncovered a regulatory mechanism of m6Am deposition on mRNAs mediated by PCIF1. Our in vivo and in vitro data demonstrate that PCIF1 is the only methyltransferase necessary and sufficient for the conversion of cap-Am mRNAs to cap-m6Am mRNAs in human cells. Moreover, we provide evidence that m6Am negatively regulates cap-dependent translation in vitro and in vivo. Our findings highlight a previously unknown translational regulatory pathway that begins with a modification in the nucleus, opening avenues of investigation in the epitranscriptome and translation fields.
Given that m6Am marks diverse transcripts including long-noncoding RNAs, snRNAs and histone mRNAs that are translated independently of cap, we predict that this modification will play diverse functions, which include but are not limited to protein translation. m6Am has been suggested to play a role in regulating the stability of modified mRNAs in HEK293T cells (Mauer et al., 2017). However, our analyses show that neither transcription nor abundance of m6Am-enriched transcripts are affected in PCIF1 KO MEL624 cells (Figure 6). A recent preprint publication measured transcript stability by SLAM-seq in PCIF1 KO HEK293T cells (Boulias et al., 2018). In line with our findings, the stability of most m6Am-marked genes remains unchanged in PCIF1 KO cells. However, we cannot rule out a potential role of m6Am in regulating mRNA stability under conditions that were not tested in this study or for a particular subset of m6Am-marked genes. Likewise, our global m6Am and m6A maps revealed no global crosstalk between m6Am and m6A deposition. However, whether m6A and m6Am could perform concerted functions under particular conditions such as stress or differentiation remains to be determined.
During the preparation of this manuscript, 3 independent groups reported the finding of PCIF1 as a m6Am methyltransferase (Akichika et al., 2019; Boulias et al., 2018; Sun et al., 2019). Although those reports validate most of the findings presented here, some key aspects remain controversial, particularly in regards to the function of m6Am in translation. While Boulias et al. observe a statistically significant, but modest global increase in translation upon PCIF1 KO, in line with our own reporter assays, Akichika et al. report a small subset of m6Am genes that behave in the opposite way. One of the key differences between the results reported by other groups and our experiments is that we employed well established reporter assays to dissect the effect of m6Am on translation in vivo and in vitro. Our results indicate that m6Am acts as an inhibitory signal, which is further supported by our quantitative proteomics data. However, it remains to be explored if this effect is maintained, diminished or enhanced in different biological contexts such as stress, differentiation or development. Furthermore, it is likely that the RNA sequence and structure, the binding of potential m6Am reader proteins or other regulatory mechanisms will alter the biological effect of m6Am in a transcript-specific manner.
Rather than altering mRNA stability, we discovered that m6Am suppresses cap-dependent translation. Given that regulation of translational has been implicated in diverse biological settings, from stress to tumorigenesis, the identification of PCIF1 as the sole, evolutionarily conserved, mRNA m6Am methyltransferase is expected to open avenues for investigating the impact of PCIF1 on gene expression of m6Am-marked transcripts in diverse biological contexts.
STAR Methods
Contact for Reagent and Resource sharing
Further information and requests for resources and reagents should be directed to and will be fulfilled by the Lead Contact Yang Shi (yang_shi@hms.harvard.edu).
Experimental Model and Subject details
MEL624 (RRID: CVCL_8054) and HEK293T (RRID:CVCL_0063) cells are grown in DMEM (Gibco) supplemented with 10% FBS and 1x pen/strep solution (Gibco) at 37°C in a CO2 incubator. Cells are split once they reach ~90% confluence with a 1:8 ratio. Cells are routinely checked for mycoplasma infection.
Method Details
mRNA purification
Total RNA is isolated from MEL624 cells with TRIzol reagent following manufacturer’s instructions. 200 ug of total RNA are subjected to two rounds of Poly(A) mRNA purification using the magnetic mRNA isolation kit from (NEB). 100 µL of oligo d(T) magnetic beads are used per purification. mRNA is eluted in a final volume of 50 µL, in elution buffer.
Processing of RNA Samples for Mass Spectrometry
250 or 500 ng of mRNA is de-capped with 0.5U of Cap-Clip enzyme (Cellscript) in 20 µL reaction volume for an hour at 37°℃. Then the RNA is digested with 0.5U of nuclease P1 (Sigma) in P1 buffer in 50 uL reaction at 37°℃ for 2 hours. To dephosphorylate the single nucleotides, 1U of rSAP (NEB) is added to a final reaction volume of 100 µL with CutSmart buffer (NEB) and incubated for an hour at 37°℃. The 100 µL samples are filtered with Millex-GV 0.22u filters.
HPLC-MS/MS Analysis for RNA
10 uL from each sample is injected into Agilent 6470 Triple Quad LC/MS instrument. The samples are run in mobile phase buffer A (water with 0.1% Formic Acid) and 2 to 20% gradient of buffer B (Methanol with 0.1% Formic Acid). MRM transitions are measured for adenosine (268.1 to 136.1, retention time 1.03 min), guanosine (284.1 to 152.1, retention time 1.15 min), 2’-O-methyladenosine (Am) (282.1 to 136.1, retention time 1.52 min), N6-methyladenosine (m6A) (282.1 to 150.1, retention time 1.79 min), N6,2-O-dimethyladenosine (m6Am) (296.1 to 150.1, retention time 2.40 min). The concentrations of each compound in the samples are calculated using calibration curves constructed with standard compounds of adenosine (Abcam), N6-methyladenosine (Abcam), N6,2’-O-dimethyladenosine (Toronto Research Chemicals). For LC/MS-MS data collection and analysis, Agilent Mass Hunter LC/MS Data Acquisition Version B.08.00 and Quantitative Analysis Version B.07.01 softwares are used.
mRNA purification from different species
Total RNA was extracted with TRIzol from the following sources: Human: MEL624 melanoma cell line (RRID: CVCL_8054)
Mouse: C2C12 mice myoblast cell line (ATCC Cat# CRL-1772, RRID:CVCL_0188)
Zebrafish: WT adult whole fish (ZFIN Cat# ZDB-GENO-990623–3, RRID:ZFIN_ZDB-GENO-990623–3)
Worm: Adult N2 (WT) C. elegans (WB Cat# N2, RRID:WB-STRAIN:N2)
Fly: KC drosophila cell line (RRID:CVCL_Z833)
Yeast: S. pombe, WT strain (ATCC 24843).
mRNA was extracted from 50–100ug of total RNA as described above.
Generation of PCIF1 KO cell lines
Two complementary strategies are followed to generate clonal PCIF1 MEL624 cell lines. 3 sgRNAs were cloned into the lentiCRISPR V2 vector (RRID:Addgene_52961):
PCIF1 sgRNA-1: TAGCGGTAAAGGAGCCACTG
PCIF1 sgRNA-2: CGGTTGAAAGACTCCCGTGG
PCIF1 sgRNA-3: ATTCACCAACCAGTCCCTGT
Additionally, a random non-targeting sgRNA was cloned into lentiCRISPR V2 as a control:
Random sgRNA-1: ATCGTTTCCGCTTAACGGCG
For the first strategy, 1 µg of lentiCRISPR V2 plus 0.5 µg of psPAX2 (RRID:Addgene_12260) and 0.2 µg of pMD2.G (RRID:Addgene_12259) packaging plasmids were mixed with 3 µg of polyethylenimine (PEI) in 100 ul of OptiMEM (Gibco) and added into 6-well plates of 30% confluent HEK293T cells (RRID:CVCL_0063). 4 hours post-transfection, the transfection media was replaced with 1.5 mL of regular media (DMEM, 10% FBS, 1X pen/strep). 48 hours post-transfection the media containing viral particles was passed through a 0.45 um filter and the viral particles from the 3 PCIF1 sgRNAs were combined. 200 µL of the pooled viral particles were used to infect a 6-well plate of ~30% confluent MEL624. At the same time, another 6-well plate was infected with 200 µl from the non-targeting sgRNA. Under these conditions we reached an infection rate of ~50%. 12 hours post-infection, cells were washed with PBS and media with 1 µg/mL of puromicyn was added to select infected cells. 48 hours post-selection, cells were grown with regular media for additional 48 hours and single-cell sorted in a 96-well plate in a FACS Aria cell sorter. Individual clones were validated as true KOs by western blot with a PCIF1 specific antibody (Bethyl A304–711A, RRID:AB_2620906). This strategy generated PCIF1 KO1 and PCIF1 KO2 cell lines, as well as the control cell line from the non-targeting sgRNA clones.
In the second strategy, and to avoid integration of cas9 into the genome, 2 µg of lentiCRISPRv2 from the PCIF1 sgRNA-2 were transfected into a ~30% confluent 6-well plate of MEL624 cells using 4 µl of lipofectamine 2000 according to manufacturer’s instructions. 24 hours post-transfection, cells were selected with 1 µg/mL of puromycin for 48 hours and growth for additional 48 hours without selection. Cells were single-cell sorted and evaluated as described above. This strategy generated the PCIF1 KO used for the rescues and m6Am mapping experiments.
PCIF1 KO cell line rescue
WT and catalytic-deficient versions of PCIF1 coding sequence were cloned into the PHAGE-puro lentiviral plasmid with a C-terminal HA-FLAG tag. Lentiviruses were prepared as described above. 500 µL of lentiviral particles were used to infect ~30% confluent MEL624 KO cells. 12 hours post-infection, viruses were washed out with PBS and cells were selected with media containing 1 µg/mL of puromycin for 48 hours. After selection, rescue cell lines were continuously growth in media containing 0.5 µg/mL of puromycin to avoid the silencing of PCIF1 transgene.
PCIF1 immunofluorescence
PCIF1 KO and rescue cell lines were seeded in a 96-well plate to a ~70% confluence. Cells are fixed for 10 mins in 3.7% formaldehyde in PBS at room temperature. Cells are washed twice with PBS and permeabilized for 10 mins with 0.1% saponin in PBS. Cells are blocked at room temperature for 1 hour with IF blocking buffer (10% BSA, 0.3% triton in PBS) and then are incubated overnight at 4°C with a monoclonal anti-FLAG antibody (Sigma-Aldrich Cat #F1804, RRID:AB_262044) diluted 1:500 in IF buffer (10% FBS, 1% BSA, 0.3% triton in PBS). Primary antibody is washed three times with 0.05% PBS-Tween. Cells are incubated with Alexa 488 goat anti-Mouse (Thermo Fisher Scientific Cat #A-11029, RRID:AB_2534088) 1:1000 in IF buffer for 1 h at room temperature in the dark. DAPI is added to a final concentration of 0.2 µg/mL and incubated for additional 10 mins. Cells are washed three times with 0.05% PBS-Tween, once with PBS and then imaged in a Nikon Eclipse Ti fluorescent microscope. Pictures of representative fields are taken with a S Plan Fluor 20X/0.45 objective with the NIS Elements v4.20 software (DAPI channel exposure: 500 msec. GFP channel exposure: 600 msec.).
Thin Layer Chromatography
Thin Layer Chromatography is performed as previously described (Kruse et al., 2011; Mauer et al., 2017) with minor modifications: 1 µg of mRNA is treated with 10U of T4 PNK (NEB #M0201S) in T4 ligase buffer in a final volume of 20 µL for 30 mins at 37°C. This will phosphorylate uncapped transcripts. Then, the mRNA is treated with 1U of Terminator 5’-Phosphate-Dependent Exonuclease (Lucigen #TER51020) for 1 h at 30°C in a FV of 30 µL of 1X Exonuclease buffer A. This step will remove all uncapped and sheared transcripts. The RNA is purified with the RNA clean and concentrator-5 kit (Zymo Research #R1016) and eluted in 10 µL. Cap is removed by incubating mRNA with 1U of Cap-Clip (Cellscript #C-CC15011H) for 1 h at 37°C in a final volume of 50 µl in Cap-Clip buffer. 1 unit of rSAP (NEB #M0371S) us added to remove the 5’ phosphate by incubating for 30 mins at 37°C. RNA is purified again with the RNA clean and concentrator-5 kit and eluted in 10 uL. mRNA is labeled by incubating with 1 U of T4 PNK and 1 µl of γ32-ATP (10mM, 3000 Ci/mmol) in a final volume of 20 µL in T4 PNK buffer for 1h at 37°C. Unincorporated isotope is eliminated by passing the RNA through a Illustra MicroSpin G-25 column (GE Healthcare #27532501). 1U of P1 nuclease (Sigma-Aldrich N8630–1VL) is added and volume is increased to 30 µL with 1X P1 buffer and incubated for 2 h at 37°C. 3 uL (10%) are loaded into a TLC cellulose glass plate and first and second dimensions are run for 14 and 19 hours, respectively. Plates are exposed to a phosphor imager screen for 24 hours and read in a Typhoon scanner. Pictures are analyzed and quantified using Fiji v2.0.0 (RRID:SCR_002285).
Preparation of mRNA Constructs
Am methylated EGFP and Firefly luciferase mRNAs are purchased from Trilink (CleanCap EGFP mRNA (L-7601) and CleanCap Fluc mRNA (L-7602)). m6Am methylated versions of these mRNAs are generated by in vitro methylation using full length human recombinant PCIF1 protein. The methylation levels are verified with mass spectrometry.
Bicistronic Firefly-IRES-Renilla mRNA is in vitro transcribed from pFR_CrPV_xb, which was a gift from Phil Sharp (RRID:Addgene_11509) (Petersen et al., 2006). The m7G-Am 5’ end is generated co-transcriptionally using m7GpppAmG CleanCap Reagent AG (TriLink L-7113). For in vitro transcription, a PCR product amplified from pFR_CrPV_xb is used. It contains Class II T7 promoter sequence that allows in vitro transcripts to start with adenosine. The following primers are used for T7 template production. Class II T7 Fluc for CleanCap TAATACGACTCACTATTAGGAACACCGAGCGACCCTGCAG T7 luc with polyA reverse TTTTTTTTTTTTTTTTTTTTTTTTTGTTAACTTGTTTATT The in vitro transcription is carried out with purified PCR generated DNA template for 3 hours at 37°C. Am methylated bicistronic construct is further in vitro methylated to m6Am using recombinant PCIF1. The RNA constructs are column purified using Zymo RNA Clean & Concentrator-5 kit after each transcription and in vitro methylation step.
Recombinant Protein Purification
Full-length human PCIF1 gene is cloned into pGEX-4T1 vector. It is expressed overnight in 500 mL Rosetta bacteria (Novagen) culture induced with 0.1 mM IPTG at 18°C. The cells are lysed in 15 mL cold lysis buffer (50 mM Tris pH 7.4, 150 mM NaCl, 0.05% NP-40, 1mM PMSF) with 0.25 mg/mL chicken lysozyme on ice for 30 min. The cell lysate is sonicated on ice and cleared with centrifugation for 20 min at 10000 rpm at 4°C. The GST tagged recombinant protein is bound to Glutathione Sepharose 4B beads (GE Healthcare) at 4°C with rotation for 3 hours. The beads are washed with lysis buffer containing 500 mM NaCl. The untagged recombinant protein is eluted off the beads with overnight rotation at room temperature with 5U of thrombin in thrombin cleavage buffer (50 mM Tris pH 8.0, 150 mM NaCl, 5mM CaCl2). The protein preparation is supplemented with 10% glycerol and stored at −80°C.
Enzyme Kinetics
The enzymatic parameters for m7G-Am methylation were determined by incubating full-length untagged recombinant PCIF1 enzyme (3 nM) with increasing concentrations of m7G-AmG dinucleotide (CleanCap Reagent AG (TriLink L-7113)) (10 – 500 nM) at 37 C in 50 mM Tris-HCl (pH 7.5 @ 25 °C), 5 mM β-ME, 10 mM EDTA and 80 µM S-adenosylmethionine (SAM) buffer. Aliquots were withdrawn at t = 0, 2, 5, 10, 30 and 60 min and boiled for 3 min to stop all enzymatic activity. The aliquots were further processed as described in Processing of RNA samples for mass spectrometry methods section. The levels of the final product (m7G-m6AmG) formed at each time point was determined using mass spectrometry by monitoring the amount of m6Am in each aliquot. The observed rate of product formation (kobs) was determined by plotting the concentration of m6Am against time for each concentration of the substrate (10, 25, 50, 100, 250, 500 nM). The kobs vs substrate concentration curve was fit to the Michaelis-Menten equation using the Graphpad Prism software to obtain the final enzymatic parameters. The same protocol was followed for kinetics using EGFP mRNA with indicated concentrations.
In vivo translation assays
200 ng of either Am-, or m6Am-EGPF mRNA are transfected into a 6-well plate with MEL624 at ~30% confluence. Transfection is done with 1 ul of lipofectamin 2000 according to manufacturer’s instructions. Untransfected wells are used as negative controls. 24 h post-transfections, cells are imaged in a Nikon Eclipse Ti fluorescent microscope and pictures of representative fields are taken with a S Plan Fluor 20X/0.45 objective with the NIS Elements v4.20 software (GFP channel low exposure: 500 msec. GFP channel high exposure: 3 sec. bright field exposure: 20–40 msec.). At the same time, a second set of transfected wells is trypsinized, washed once with PBS and resuspended in 500 µl of PBS for flow cytometry. Cells are analyzed in a FACS Canto II and percentages of GFP positive cells as well as GFP intensity values are calculated with FlowJo 8.7. Finally, a third set of transfected wells is lysed with 200 µL of TRIzol and total RNA is purified following manufacturer’s instructions. Quantitative PCR is performed with primers specific for GFP and GAPDH as internal control in order to determine the level of mRNA that was transfected into the cells.
In vitro Translation
In vitro translation reactions are carried out using Retic Lysate IVT kit (Invitrogen Ambion) in 25 µL or 10 µL reactions with varying indicated mRNA concentrations (50, 100 or 200 ng). The translation is carried out at 30°C for 1 hour. For the firefly luciferase mRNA (Trilink) translation reactions, luciferase reagent supplied by Firefly Luc One-Step Glow Assay Kit (Pierce Thermo Fisher Scientific) is used. For the in vitro transcribed bicistronic firefly-IRES-renilla luciferase mRNA translation reactions, luciferase reagents supplied by Dual-Luciferase Reporter Assay System (Promega) are used and luminescence is measured on a plate reader.
m6A MeRIP-Seq
m6A MeRIP experiments were performed following the recommendations from the EpiMark N6-Methyladenosine Enrichment Kit (NEB #E1610) with some modifications: 10 µg of mRNA in 50 µL are mixed with 250 µL of fragmenting buffer (10 mM Tris pH 7.4, 10 mM ZnCl2). The RNA is fragmented by incubation at 98ºC for 3 min. Fragmentation was stopped by the addition of EDTA to a final concentration of 70 mM. Volume was increased to 500 uL with reaction buffer and 10% of the volume is taken as Input. 50 µL of Protein G Dynabeads (Invitrogen) are incubated with 1 uL (250 ug) of anti-m6A rabbit monoclonal antibody from the EpiMark kit (Cell Signaling Technologies, distributed with the kit by NEB) at 4°C for 30 mins. The beads/antibody slurry is added to the fragmented mRNA and incubated in rotation for 1 h at 4°C. Beads were washed twice with 200 µL of reaction buffer, twice with 200 µL of low salt buffer and twice with 200 µL of high salt buffer. Immunoprecipitated RNA was eluted by incubating the beads with 200 µL of TRIzol for 5 min at room temperature. TRIzol was recovered and RNA was purified with the RNA clean and concentrator Kit −5 and eluted in 10 µL. Illumina sequencing libraries are prepared with the NEBNext Ultra II Directional Library Prep Kit for Illumina from NEB (#E7760), following manufacture’s instructions. RNA-Seq libraries are generated from three biological replicates for Input (RNA-Seq) and m6A-immunoprecipitated mRNA. Libraries are sequenced in a HiSeq 2000 with an average coverage of 20 million reads per sample.
PRO-Seq sequencing
Control or PCIF1-KO (KO1 and KO2) MEL624 cells were permeabilized at 4°C or on ice unless otherwise specified. Briefly, cells were washed once in ice-cold 1x PBS and resuspended in Buffer W (10 mM Tris-HCl pH 8.0, 10% glycerol, 250 mM sucrose, 10 mM KCl, 5 mM MgCl2, 0.5 mM DTT, protease inhibitors cocktail (Roche), and 4 u/mL RNase inhibitor [SUPERaseIN, Ambion]) at the cell density of 2 × 10⁷ cells/mL. 9x volume of Buffer P (10 mM Tris-HCl pH 8.0, 10% glycerol, 250 mM sucrose, 10 mM KCl, 5 mM MgCl2, 0.5 mM DTT, 0.1% Igepal, protease inhibitors cocktail (Roche), 4 u/mL RNase inhibitor [SUPERaseIN, Ambion]) was then immediately added. Cells were gently resuspended and incubated for up to 2 min on ice. Cells were then recovered by centrifugation (800 x g for 4 min) and washed in Buffer F (50 mM Tris-HCl pH 8.0, 40% glycerol, 5 mM MgCl2, 0.5 mM DTT, 4 u/mL RNase inhibitor [SUPERaseIN, Ambion]). Washed permeabilized cells were finally resuspended in Buffer F at a density of 1×10⁶ cells/30 µL and immediately frozen in liquid nitrogen. Permeabilized cells were stored in −80°C until usage.
PRO-seq run-on reactions were carried out as follows: 1 × 10⁶ permeabilized cells spiked with 4 × 10⁴ permeabilized Drosophila S2 cells were added to the same volume of 2x Nuclear Run-On reaction mixture (10 mM Tris-HCl pH 8.0, 300 mM KCl, 1% Sarkosyl, 5 mM MgCl2, 1 mM DTT, 200 µM biotin-11-A/C/G/UTP (Perkin-Elmer), 0.8 u/µL SUPERaseIN inhibitor [Ambion]) and incubated for 5 min at 30°C. Nascent RNA was extracted using a Total RNA Purification Kit following the manufacturer’s instructions (Norgen Biotek Corp.). Extracted nascent RNA was fragmented by base hydrolysis in 0.25 N NaOH on ice for 10 min and neutralized by adding 1x volume of 1 M Tris-HCl pH 6.8. Fragmented nascent RNA was bound to 30 µL of Streptavidin M-280 magnetic beads (Thermo Fisher Scientific) in Binding Buffer (300 mM NaCl, 10 mM Tris-HCl pH 7.4, 0.1% Triton X-100). The beads were washed twice in High salt buffer (2 M NaCl, 50 mM Tris-HCl pH 7.4, 0.5% Triton X-100), twice in Binding buffer, and twice in Low salt buffer (5 mM Tris-HCl pH 7.4, 0.1% Triton X-100). Bound RNA was extracted from the beads using Trizol (Invitrogen) followed by ethanol precipitation. For the first ligation reaction, fragmented nascent RNA was dissolved in H2O and incubated with 10 pmol of reverse 3’ RNA adaptor (5’p-rGrArUrCrGrUrCrGrGrArCrUrGrUrArGrArArCrUrCrUrGrArArC-/3’InvdT/) and T4 RNA ligase I (NEB) under manufacturer’s conditions for 2 h at 20°C. Ligated RNA was enriched with biotin-labeled products by another round of Streptavidin bead binding and washing (two washes each of High, Binding and Low salt buffers and one wash of 1x Thermo Pol Buffer (NEB)). To decap 5’ ends, the RNA products were treated with RNA 5’ Pyrophosphohydrolase (RppH, NEB) at 37°C for 30 min followed by one wash of High, Low and T4 PNK Buffer. To repair 5’ ends, the RNA products were treated with Polynucleotide Kinase (PNK, NEB) at 37°C for 30 min.
5’ repaired RNA was ligated to reverse 5’ RNA adaptor (5’-rCrCrUrUrGrGrCrArCrCrCrGrArGrArArUrUrCrCrA-3’) with T4 RNA ligase I (NEB) under manufacturer’s conditions for 2 h at 20°C. Adaptor ligated nascent RNA was enriched with biotin-labeled products by another round of Streptavidin bead binding and washing (two washes each of High, Binding and Low salt buffers and one wash of 1x SuperScript IV Buffer [Thermo Fisher Scientific]), and reverse transcribed using 25 pmol RT primer (5’-AATGATACGGCGACCACCGAGATCTACACGTTCAGAGTTCTACAGTCCGA-3’) for TRU-seq barcodes (RP1 primer, Illumina). A portion of the RT product was removed and used for trial amplifications to determine the optimal number of PCR cycles. For the final amplification, 12.5 pmol of RPI-index primers (for TRU-seq barcodes, Illumina) was added to the RT product with Phusion polymerase (NEB) under standard PCR conditions. Excess RT primer served as one primer of the pair used for the PCR. The product was amplified 10~12 cycles and beads size selected (ProNex Purification System, Promega) before being sequenced in NextSeq 500 machines in a high-output 75-bp cycle run. Libraries were sequenced to an average read depth of 50 million mappable reads per sample.
m6Am-Exo-Seq
In order to efficiently map m6Am enrichment we developed a technique called m6Am-Exo-Seq that differs from m6A MeRIP in that mRNA is treated with a 5’-exonuclease before immunoprecipitation to enrich for capped-5’ ends (Extended Data Fig. 6). A detailed protocol for the experiment as well as a description of the bioinformatic analyses to obtain the list of m6Am-enriched genes is provided here.
11 µg mRNA (see mRNA purification for details of how to obtain mRNA) in 60 µL of nuclease-free water are mixed with 300 µL of fragmenting buffer (10 mM Tris pH 7.4, 10 mM ZnCl2) on ice. The mRNA is incubated for exactly 3 min at 98°C in order to generate fragments of 100–150 bp size. Fragmentation is stopped by the addition of EDTA to a final concentration of 70 mM. mRNA is purified with the RNA Clean and Concentrator −5 kit (Zymo Research) and eluted in 10 µL of elution buffer. Uncapped and fragmented transcripts are phosphorylated by treating the mRNA with 20U of T4 PNK (NEB) in T4 ligase buffer in a final volume of 20 µL for 1:30 h at 37°C. Then, 2U of Terminator 5’-Phosphate-Dependent Exonuclease (Lucigen) is added and volume is increased to 40 µL with 1X Exonuclease buffer A. Samples are treated for 3 h at 30°C to remove phosphorylated (ie. uncapped and sheared) transcripts. The RNA enriched for 5’-capped transcripts is purified with the RNA clean and concentrator −5 kit (Zymo Research) and eluted in 15 µL. 3U of Cap-Clip (CellScript) are added and incubated for 2 h at 37°C in 30 µL of CAP-CLIP buffer to remove the cap. RNA is again purified with the RNA clean and Concentrator −5 kit, eluted in 11 uL and quantified in a nanodrop. At this point, approximately 1 µg of uncapped 5’ RNA fragments is obtained. 1 µL of the treated RNA (10%) is saved as input, the rest is diluted to a final volume of 250 µL with reaction buffer (10 mM Tris pH 7.4, 150 mM NaCl, 0.1% Igepal).
100 µL of Protein G Dynabeads (Invitrogen) per sample are washed twice with 250 uL of reaction buffer and resuspended in 250 µl of reaction buffer with 2.5 ug of anti-m6A antibody (see list of antibodies used at the end). Beads and antibody are incubated in rotation for 1 h at 4°C and then washed twice with 250 µL of ice-cold reaction buffer. The beads/antibody slurry is added to the RNA in a final volume of 500 µL of reaction buffer and incubated in rotation for 2 h at 4°C. Beads are washed twice with 200 µL of reaction buffer at room temperature, twice with 200 µL of low salt buffer (10 mM Tris pH 7.4, 50 mM NaCl, 0.1% Igepal) at room temperature and twice with 200 µL of high salt buffer (10 mM Tris pH 7.4, 500 mM NaCl, 0.1% Igepal). Immunoprecipitated 5’ fragments are eluted by incubating the beads with 200 uL of TRIzol for 5 min at room temperature. TRIzol was recovered and RNA is purified with the RNA clean and concentrator Kit −5 and eluted in 10 uL. Illumina sequencing libraries are prepared with the NEBNext Ultra II Directional Library Prep Kit for Illumina from NEB (#E7760), following manufacture’s instructions. RNA-Seq libraries are generated from Input and Immunoprecipitated material are generated for control and PCIF1 KO MEL624 cells for 8 different antibodies. Also, libraries from three independent biological replicates for control and KO cells are generated from material immunoprecipitated with antibody 4 (mouse monoclonal, Synaptic Systems clone 212B11). Libraries are single-end sequenced in a NextSeq 500 with coverage of at least 15 million reads per sample.
The list of m6A antibodies used for m6Am-Exo-Seq is as follow:
Antibody 1: Rabbit Monoclonal antibody from the EpiMark N6-Methyladenosine Enrichment Kit (NEB #E1610, antibody from Cell Signaling)
Antibody 2: Mouse monoclonal antibody, clone 80C9, gift of Synaptic Systems
Antibody 3: Mouse monoclonal antibody, clone 345E11, Synaptic Systems cat # 202 011 (RRID:AB_2619890)
Antibody 4: Mouse monoclonal antibody, clone 212B11, Synaptic Systems cat # 202 111 (RRID:AB_2619891)
Antibody 5: Rabbit polyclonal affinity purified, batch #8699, gift of Synaptic Systems.
Antibody 6: Rabbit polyclonal affinity purified, batch #8700, gift of Synaptic Systems
Antibody 7: Rabbit polyclonal affinity purified, batch #8701, gift of Synaptic Systems
Antibody 8: Rabbit polyclonal affinity purified, batch #8702, gift of Synaptic Systems
Sample preparation for quantitative multiplexed proteomics
The sample preparation was performed as previously reported (Navarrete-Perea et al., 2018). The cell pellets were homogenized in 8M urea complemented with protease inhibitors (complete, Roche). The cell debris were separated by centrifugation at 21 130g for 15 min, then the supernatant was transferred onto a new tube. The protein concentration was measured using the BCA method following the manufacturer’s instructions (ThermoFischer Scientific). Proteins were reduced using 5 mM TCEP for 30 min at room temperature and then alkylated using 10 mM iodoacetamide for 30 min, in the dark. The excess of iodoacetamide was quenched using 10 mM DTT for 15 min at room temperature. Then, the samples were precipitated using the methanol-chloroform method and the protein pellet was resuspended in 200 mM EPPS pH 8.5 and digested overnight using Lys-C at a 100:1 protein-to-protease ratio. Trypsin was added at the same ratio. After TMT labeling and ratio correction, the samples were combined. The pooled sample was desalted before BpH-RP fractionation to produce a total of 96 fractions, which were consolidated into 24 and 12 nonadjacent samples were analyzed in the mass spectrometer.
Liquid Chromatography and Tandem Mass Spectrometry for proteins
Mass spectrometry data were collected using an Orbitrap Fusion mass spectrometer (ThermoFisher Scientific, San Jose, CA) coupled to a Proxeon EASY-nLC 1200 liquid chromatography (LC) pump (ThermoFisher Scientific, San Jose, CA). Peptides were separated on a 100 µm inner diameter microcapillary column packed with ≈40 cm of Accucore150 resin (2.6 µm, 150Å, ThermoFisher Scientific, San Jose, CA). For each analysis, we loaded ≈1–2 µg onto the column and separation was achieved using a 1.5h h gradient of 7 to 27% acetonitrile in 0.125% formic acid at a flow rate of ≈ 550 nL min−1. The Real Time Search-MS3 acquisition was performed as previously reported (Erickson et al., 2019).
Quantification and statistical analyses
Statistical Analyses
Statistical Analyses were performed in R (version 3.3.3). Details of the statistical tests performed for each experiment are given in the figure legends. Unless otherwise specified, non-parametric tests were performed and statistical significance was determined at p<0.05.
m6A MeRIP-seq analysis
MeRIP-seq derived reads are aligned against hg38 genome assembly with hisat 2.0.4 using the following parameters: --no-unal --rna-strandness R. SAM files are sorted and converted to BAM with samtools v1.7. Reads with QS < 10 are excluded, Normalized bigWig files are generated from BAM files with bamCoverage from the deepTools suite v3.0.2 with the following parameters: -bs 20 --normalizeUsing BPM --skipNAs. Reads that overlap with the blacklisted regions from ENCODE project are excluded. Average bigWig files for the biological replicates are generated using the bigwigCompare program from the deepTools suite v3.0.2. m6A-enriched genes are obtained by calling significant peaks form the BAM files with macs2 (v2.1.1) with a q-value < 1e-10 for each individual biological replicate. A gene is considered to be enriched for m6A only if a peak was called in all the replicates. Metagene and heatmap plots were generated with the deepTools suite v3.0.2 and in-house scripts.
PRO-seq analysis
PRO-seq paired-end reads were trimmed to 40 nt. To remove adapter sequence and low quality 3’ ends we used cutadapt 1.14, discarding reads shorter than 20 nt (-m 20 -q 10), and removing a single nucleotide from the 3’ end of all trimmed reads to allow successful alignment with Bowtie 1.2.2. Remaining read pairs were paired-end aligned to the Drosophila dm3 genome index to determine spike-normalization ratios based on uniquely mapped reads. Counts of pairs mapping uniquely to spike-in RNAs (drosophila genome) were determined for each sample. In this case, the samples displayed highly comparable recovery of spike-in reads, thus only depth normalization was used for each bedGraph.
Reads mapped to dm3 were excluded from further analysis, and unmapped pairs were aligned to the hg38 genome assembly. Identical parameters were utilized in each alignment described above: up to 2 mismatches, maximum fragment length of 1000 nt, and uniquely mappable, and unmappable pairs routed to separate output files (-m1, -v2, -X1000, --un). Pairs mapping uniquely to hg38, representing biotin-labeled RNAs were separated, and strand-specific counts of the 3’-end mapping positions determined at single nucleotide resolution, genome-wide, and expressed in bedGraph format with “plus” and “minus” strand labels, as appropriate. Combined bedGraphs were generated after deduplication by summing counts per nucleotide of all 3 replicates for each condition.
Read counts were calculated per gene (from transcription start site to transcription end site), in a strand-specific manner, based on default annotations (ensembl hg38), using featureCounts. Differentially expressed genes were identified using DESeq2 v1.18.1 under R 3.3.1. PRO-Seq size factors were determined based on DESeq2 (for Control: 0.9690449, 0.8752877, 0.9008983; PCIF1-KO1: 1.1669854, 0.9802904, 1.3105898; PCIF1-KO2: 0.9866223, 1.0047620, 0.9516695). At an adjusted p-value threshold of <0.01, 731 affected genes in KO clone 1 and 1406 in KO clone 2 were identified as differentially expressed upon PCIF1-KO in MEL624 cells. After overlapping both lists there are 506 genes that pass the padj < 0.01 threshold, from which 320 are upregulated in both KO clone 1 and clone 2 (Table S4), 182 are downregulated in both clones (Table S5) and 4 are downregulated in KO1 and upregulated in KO2. UCSC Genome Browser tracks were generated from the combined replicates per condition, normalized as in the differential expression analysis.
RNA-Seq analysis
Read counts for the RNA-Seq inputs from the m6A mapping experiment are calculated from BAM files with featureCounts from the Rsubread package v1.22.3 in an R 3.3.3 environment. The read count table is analyzed with edgeR v3.12.1 and log2 TPM measurements are generated. After calculating normalization factors and estimating dispersion, DEG genes between KOs and Control cells were calculated using glm modeling with a FDR < 1e-5. A final list of DEG shared between PCIF1 KO1 and PCIF1 KO2 is generated using in-house scripts, which gives a total of 236 upregulated genes (Table S2) and 305 downregulated genes (Table S3). Boxplots of average expression are generated with R 3.3.3 and in-house scripts from the log2 TPM values calculated in edgeR. Mann-Whitney tests to compare average expression levels between different samples and hyper geometric test to calculate p-values for overlaps between datasets in Venn diagrams are performed in R 3.3.3.
m6Am-exo-Seq analysis
Reads are aligned against hg38 genome assembly with hisat 2.0.4 using the following parameters: --no-unal --rna-strandness R. SAM files are sorted and converted to BAM with samtools v1.7. Reads with QS < 10 are excluded, Normalized bigWig files are generated from BAM files with bamCoverage from the deepTools suite v3.0.2 with the following parameters: -bs 20 --normalizeUsing BPM --skipNAs. Reads that overlap with the blacklisted regions from ENCODE project are excluded. Average bigWig files for the biological replicates are generated using the bigwigCompare program from the deepTools suite v3.0.2. Metagene plots are generated with the deepTools suite v3.0.2 and in-house scripts using the bigWig files. A SAF file containing the coordinates of all coding transcripts from TSS to +300bp from the ensembl genes 93 annotation is generated using in-house scripts. Only transcripts that are expressed on MEL624 according to RNA-Seq are taken into account. Using the SAF file from the previous step, reads that overlap with TSS are counted using featureCounts from the Rsubread package v1.22.3 in a R 3.3.3 environment. The read count table was analyzed with edgeR v3.12.1 and CPM measurements are generated. After calculating normalization factors and estimating dispersion, m6Am replicates are normalized with their respective inputs and transcripts that showed a significantly enrichment over KO cells (FDR < 1e-2) are considered to be true m6Am-enriched transcripts. Using these parameters, a list of 3,170 m6Am-enriched transcripts that belong to 1,521 genes is obtained (Table S1).
TMT proteomics Database searches and determination of up- and downregulated proteins
Mass spectra were processed using a Sequest-based pipeline (Huttlin et al., 2010). Spectra were converted to mzXML using a modified version of ReAdW.exe. Database searching included all entries from the human UniProt database (2018–12-15). This database was concatenated with one composed of all protein sequences in the reversed order and common contaminants were added. Searches were performed using a 50 ppm precursor ion tolerance for total protein-level profiling. The product ion tolerance was set to 0.9 Da. These wide mass tolerance windows were chosen to maximize sensitivity in conjunction with Sequest searches and linear discriminant analysis (Beausoleil et al., 2006; Huttlin et al., 2010). TMT tags on lysine residues and peptide N termini (+229.163 Da) and carbamidomethylation of cysteine residues (+57.021 Da) were set as static modifications, while oxidation of methionine residues (+15.995 Da) was set as a variable modification. Peptide-spectrum matches (PSMs) were adjusted to a 1% false discovery rate (FDR) (Elias and Gygi, 2007). PSM filtering was performed using a linear discriminant analysis, as described previously (Huttlin et al., 2010), while considering the following parameters: XCorr, ∆Cn, missed cleavages, peptide length, charge state, and precursor mass accuracy. For TMT-based reporter ion quantitation, we extracted the summed signal-to-noise (S/N) ratio for each TMT channel and found the closest matching centroid to the expected mass of the TMT reporter ion. PSMs were identified, quantified, and collapsed to a 1 % peptide false discovery rate (FDR) and then collapsed further to a final protein-level FDR of 1%. Moreover, protein assembly was guided by principles of parsimony to produce the smallest set of proteins necessary to account for all observed peptides. Proteins were quantified by summing reporter ion counts across all matching PSMs. PSMs with poor quality or MS3 spectra with more than six TMT reporter ion channels missing were discarded (McAlister et al., 2012). Protein quantitation values were exported for further analysis. Each reporter ion channel was summed across all quantified proteins and normalized assuming equal protein loading of all eight samples.
The resulting TMT Relative Abundance (TRA) is used to calculate the average fold-change difference between control and PCIF1 KO samples. Proteins with a fold-change increase or decrease greater than 50% and a p-value < 0.05 according to a two-sided t-test are considered up- or down-regulated, respectively.
Key Resource Table
Supplementary Material
| REAGENT or RESOURCE | SOURCE | IDENTIFIER |
|---|---|---|
| Antibodies | ||
| Rabbit Monoclonal anti-m6A | EpiMark N6-Methyladenosine Enrichment Kit, NEB | Cat # E1610 |
| Mouse monoclonal anti-m6A | Synaptic Systems | Clone 80C9; gift of Synaptic Systems |
| Mouse monoclonal anti-m6A | Synaptic Systems | Cat # 202 011; RRID:AB_2619890 |
| Mouse monoclonal anti-m6A | Synaptic Systems | Cat # 202 111; RRID:AB_2619891 |
| Rabbit polyclonal anti-m6A | Synaptic Systems | Batch #8699; gift of Synaptic Systems |
| Rabbit polyclonal anti-m6A | Synaptic Systems | Batch #8700; gift of Synaptic Systems |
| Rabbit polyclonal anti-m6A | Synaptic Systems | Batch #8701; gift of Synaptic Systems |
| Rabbit polyclonal anti-m6A | Synaptic Systems | Batch #8702; gift of Synaptic Systems |
| Rabbit Polyclonal anti-PCIF1 | Bethyl | Cat # A304–711A; RRID:AB_2620906 |
| Mouse monoclonal anti-FLAG | Millipore Sigma | Cat # F1804; RRID:AB_262044 |
| Goat anti-Mouse Alexa 488 | Thermo Fisher Scientific | Cat #A-11029; RRID:AB_2534088 |
| Mouse Monoclonal Anti-Actin, Horseradish Peroxidase Conjugated, Clone AC-15 | Millipore Sigma | Cat # A3854; RRID:AB_262011 |
| Bacterial and Virus Strains | ||
| Stbl3 competent E. coli | Thermo Fisher Scientific | Cat # C737303 |
| Rosetta Competent E. coli | Millipore Sigma | Cat # 70953 |
| Chemicals, Peptides, and Recombinant Proteins | ||
| Adenosine | Abcam | Cat # ab120498; CAS: 58–61-7 |
| N6-methyladenosine | Abcam | Cat # ab145715; CAS: 1867–73-8 |
| N6,2’-O-dimethyladenosine | Toronto Research Chemicals | Cat # D447415; CAS: 57817–83-1 |
| CleanCap EGFP mRNA | Trilink | Cat # L-7601 |
| CleanCap Fluc mRNA | Trilink | Cat # L-7602 |
| CleanCap Reagent AG | Trilink | Cat # L-7113 |
| TRIzol | Thermo Fisher Scientific | Cat # 15596026 |
| Polybrene | Millipore Sigma | Cat # H9268 |
| Puromycin | Gold Biotechnology | Cat # P-600–500 |
| Lipofectamin 2000 | Thermo Fisher Scientific | Cat # 11668019 |
| Biotin-11-UTP | Perkin-Elmer | Cat # NEL543001EA |
| gamma-32P ATP (10mM, 3000 Ci/mmol) | Perkin-Elmer | Cat # BLU002A100UC |
| Dynabeads M-280 Streptavidin | Thermo Fisher Scientific | Cat # 11205D |
| Dynabeads Protein G | Thermo Fisher Scientific | Cat # 10003D |
| Cap-Clip Acid Pyrophosphatase | Cellscript | Cat # C-CC15011H |
| P1 nuclease | Sigma-Aldrich | Cat # N8630–1VL |
| rSAP | NEB | Cat # M0371S |
| T4 PNK | NEB | Cat # M0201S |
| Terminator 5’-Phosphate-Dependent Exonuclease | Lucigen | Cat # TER51020 |
| Critical Commercial Assays | ||
| Magnetic mRNA Isolation Kit | NEB | Cat # S1550S |
| RNA clean and concentrator-5 kit | Zymo Research | Cat # R1016 |
| EpiMark N6-Methyladenosine Enrichment Kit | NEB | Cat # E1610 |
| NEBNext Ultra II Directional Library Prep Kit for Illumina | NEB | Cat # E7760 |
| Retic Lysate IVT kit | Thermo Fisher Scientific | Cat # AM1200 |
| Firefly Luc One-Step Glow Assay Kit | Thermo Fisher Scientific | Cat # 16196 |
| Dual-Luciferase Reporter Assay System | Promega | Cat # E1910 |
| MicroSpin G-25 columns | GE Healthcare | Cat # 27532501 |
| Millex-GV 0.22u filters | Millipore Sigma | Cat # SLGV033RS |
| Total RNA Purification Kit | Norgen Biotek Corp. | Cat # 37500 |
| Deposited Data | ||
| PRO-seq, MeRIP-seq, RNA-Seq and m6Am-Exo-Seq | This study | GEO: GSE122803 |
| Original images for western blot, TLC and microscopy | This study | http://dx.doi.org/10.17632/xkkm2xj9tc.1 |
| Experimental Models: Cell Lines | ||
| Human Cell Line: MEL624 | Laboratory of Randall Moon | RRID: CVCL_8054 |
| Human Cell Line: HEK293T | ATCC | Cat # CRL-3216; RRID:CVCL_0063 |
| Mouse Cell Line: C2C12 | ATCC | Cat # CRL-1772; RRID:CVCL_0188 |
| D. Melanogaster Cell Line: Kc | Flybase | Cat # FBtc0000998; RRID:CVCL_Z833 |
| Experimental Models: Organisms/Strains | ||
| Zebrafish: WT strain | ZFIN | Cat # ZDB-GENO-990623–3; RRID:ZFIN_ZDB-GENO-990623–3 |
| C. elegans: N2 Strain | CGC | Cat # N2; RRID:WB-STRAIN:N2 |
| S. pombe: WT strain | ATCC | Cat# 24843; |
| Oligonucleotides | ||
| PCIF1 sgRNA-1: TAGCGGTAAAGGAGCCACTG | This paper | N/A |
| PCIF1 sgRNA-2: CGGTTGAAAGACTCCCGTGG | This paper | N/A |
| PCIF1 sgRNA-3: ATTCACCAACCAGTCCCTGT | This paper | N/A |
| Random sgRNA-1: ATCGTTTCCGCTTAACGGCG | This paper | N/A |
| Class II T7 Fluc for CleanCap: TAATACGACTCACTATTAGGAACACCGAGCGACCCT GCAG | This paper | N/A |
| T7 luc with polyA reverse TTTTTTTTTTTTTTTTTTTTTTTTTGTTAACTTGTTTATT | This paper | N/A |
| Recombinant DNA | ||
| Plasmid: lentiCRISPR V2 | Addgene | Cat # 52961; RRID:Addgene_529 61 |
| Plasmid: psPAX2 | Addgene | Cat # 12260; RRID:Addgene_122 60 |
| Plasmid: pMD2.G | Addgene | Cat # 12259; RRID:Addgene_122 59 |
| Plasmid: pFR_CrPV_xb | Phil Sharp lab | RRID:Addgene_115 09 |
| Plasmid: pGEX-4T1 | GE Healthcare | Cat # 28–9545-49 |
| Plasmid: pHAGE_puro | Addgene | Cat # 118692; RRID:Addgene_118 692 |
| Software and Algorithms | ||
| Mass Hunter LC/MS Data Acquisition Version B.08.00 | Agilent | N/A |
| Quantitative Analysis Version B.07.01 | Agilent | N/A |
| NIS Elements v4.20 | Nikon | https://www.microscope.healthcare.nikon.com/products/software/nis-elements/nis-elements-advanced-research |
| Fiji v2.0.0 | NIH | RRID:SCR_002285 |
| FlowJo 8.7 | FlowJo, LLC | https://www.flowjo.com/ |
| R (version 3.3.3) | The R project | https://www.r-project.org/ |
| hisat v2.0.4 | CCB at JHU | http://www.ccb.jhu.edu/software/hisat/index.shtml |
| deepTools suite v3.0.2 | Max Planck Institute of Immunobiology and Epigenetics | https://github.com/deeptools/deepTools |
Highlights.
PCIF1 is an evolutionarily conserved mRNA m6Am methyltransferase
Loss of PCIF1 leads to loss of m6Am, but m6A level or distribution is not affected
m6am decreases cap dependent translation. No effect on transcription, mRNA stability
m6Am-Exo-Seq is a robust methodology that enables global m6Am mapping
Acknowledgments
We thank members of the Shi lab for helpful discussions. We are especially indebted to the Tufts Genomic Core and Karla F Meza-Sosa for helpful advice and reagents, and to the Harvard Medical School Nascent Transcriptomics Core for assistance with PRO-Seq. We thank Synaptic Systems for kindly providing m6A antibodies. This work was supported by grants from the NIH to Y.S. (R01 GM117264, R35 CA210104–01, and, R21 AI130737–02 and R01 CA118487, both of which are now inactive), funds from Boston Children’s Hospital to Y.S. and Startup Funds provided by Harvard Medical School to K.A. Y.S. is an American Cancer Society Research Professor. This work used the Extreme Science and Engineering Discovery Environment (XSEDE), which is supported by NSF grant number ACI-1548562. Specifically, it used the Bridges system, which is supported by NSF award number ACI-1445606, at the Pittsburgh Supercomputing Center (PSC). D.V-G. was supported by a postdoctoral fellowship from the Mexican Council of Science and Technology (CONACyT, CVU 257385) and is a member of the Mexican National System of Researchers (SNI I). J.N-P. (CVU 289937) was partially supported by the Consejo Nacional de Ciencia y Tecnología (CONACyT) of Mexico.
Footnotes
Publisher's Disclaimer: This is a PDF file of an unedited manuscript that has been accepted for publication. As a service to our customers we are providing this early version of the manuscript. The manuscript will undergo copyediting, typesetting, and review of the resulting proof before it is published in its final citable form. Please note that during the production process errors may be discovered which could affect the content, and all legal disclaimers that apply to the journal pertain.
Declaration of interests
YS is a consultant/advisor for the Institutes of Biomedical Sciences, Fudan University Shanghai Medical School.
Data and Software availability
The Next-Generation Sequencing data generated for this paper (PRO-seq, MeRIP-seq, RNA-Seq and m6Am-Exo-Seq) is accessible through the Gene Expression Omnibus (GEO) with the accession number GSE122803. Original imaging data (western blot, thin layer chromatograpy and microscopy) is available through mendeley data in http://dx.doi.org/10.17632/xkkm2xj9tc.1
Table S1 - Related to Figure 5. List of m6Am-marked genes
Table S2 - Related to Figure 6. List of Upregulated genes according to RNA-Seq
Table S3 - Related to Figure 6. List of Downregulated genes according to RNA-Seq
Table S4 - Related to Figure 6. List of Upregulated genes according to PRO-Seq
Table S5 - Related to Figure 6. List of Upregulated genes according to PRO-Seq
Table S6 - Related to Figure 7. TMT proteomic quantification in Control and PCIF1 KO cells (values represent TMT Relative Abundance)
References
- Akichika S, Hirano S, Shichino Y, Suzuki T, Nishimasu H, Ishitani R, Sugita A, Hirose Y, Iwasaki S, Nureki O, et al. (2019). Cap-specific terminal N6-methylation of RNA by an RNA polymerase II–associated methyltransferase. Science (80-. ) [DOI] [PubMed] [Google Scholar]
- Beausoleil SA, Villén J, Gerber SA, Rush J, and Gygi SP (2006). A probability-based approach for high-throughput protein phosphorylation analysis and site localization. Nat. Biotechnol 24, 1285–1292. [DOI] [PubMed] [Google Scholar]
- Boulias K, Toczydlowska-Socha D, Hawley BR, Liberman-Isakov N, Takashima K, Zaccara S, Guez T, Vasseur J-J, Debart F, Aravind L, et al. (2018). Identification of the m6Am methyltransferase PCIF1 reveals the location and functions of m6Am in the transcriptome. BioRxiv 485862. [DOI] [PMC free article] [PubMed] [Google Scholar]
- Dominissini D, Moshitch-Moshkovitz S, Schwartz S, Salmon-Divon M, Ungar L, Osenberg S, Cesarkas K, Jacob-Hirsch J, Amariglio N, Kupiec M, et al. (2012). Topology of the human and mouse m6A RNA methylomes revealed by m6A-seq. Nature 485, 201–206. [DOI] [PubMed] [Google Scholar]
- Ebmeier CC, Erickson B, Allen BL, Allen MA, Kim H, Fong N, Jacobsen JR, Liang K, Shilatifard A, Dowell RD, et al. (2017). Human TFIIH Kinase CDK7 Regulates Transcription-Associated Chromatin Modifications. Cell Rep 20, 1173–1186. [DOI] [PMC free article] [PubMed] [Google Scholar]
- Elias JE, and Gygi SP (2007). Target-decoy search strategy for increased confidence in large-scale protein identifications by mass spectrometry. Nat. Methods 4, 207–214. [DOI] [PubMed] [Google Scholar]
- Erickson BK, Mintseris J, Schweppe DK, Navarrete-Perea J, Erickson AR, Nusinow DP, Paulo JA, and Gygi SP (2019). Active Instrument Engagement Combined with a Real-Time Database Search for Improved Performance of Sample Multiplexing Workflows. J. Proteome Res 18, 1299–1306. [DOI] [PMC free article] [PubMed] [Google Scholar]
- Fan H, Sakuraba K, Komuro A, Kato S, Harada F, and Hirose Y (2003). PCIF1, a novel human WW domain-containing protein, interacts with the phosphorylated RNA polymerase II. Biochem. Biophys. Res. Commun 301, 378–385. [DOI] [PubMed] [Google Scholar]
- Hirose Y, Iwamoto Y, Sakuraba K, Yunokuchi I, Harada F, and Ohkuma Y (2008). Human phosphorylated CTD-interacting protein, PCIF1, negatively modulates gene expression by RNA polymerase II. Biochem. Biophys. Res. Commun 369, 449–455. [DOI] [PubMed] [Google Scholar]
- Huttlin EL, Jedrychowski MP, Elias JE, Goswami T, Rad R, Beausoleil SA, Villén J, Haas W, Sowa ME, and Gygi SP (2010). A tissue-specific atlas of mouse protein phosphorylation and expression. Cell 143, 1174–1189. [DOI] [PMC free article] [PubMed] [Google Scholar]
- Iyer LM, Zhang D, and Aravind L (2016). Adenine methylation in eukaryotes: Apprehending the complex evolutionary history and functional potential of an epigenetic modification. Bioessays 38, 27–40. [DOI] [PMC free article] [PubMed] [Google Scholar]
- Keith JM, Ensinger MJ, and Moss B (1978). HeLa Cell RNA(2’−0-methyladenosine-W-)-methyltransferase Specific for the Capped &End of Messenger RNA* [PubMed] [Google Scholar]
- Kruse S, Zhong S, Bodi Z, Button J, Alcocer MJC, Hayes CJ, and Fray R (2011). A novel synthesis and detection method for cap-associated adenosine modifications in mouse mRNA. Sci. Rep 1, 126. [DOI] [PMC free article] [PubMed] [Google Scholar]
- Kwak H, Fuda NJ, Core LJ, and Lis JT (2013). Precise maps of RNA polymerase reveal how promoters direct initiation and pausing. Science 339, 950–953. [DOI] [PMC free article] [PubMed] [Google Scholar]
- Linder B, Grozhik AV, Olarerin-George AO, Meydan C, Mason CE, and Jaffrey SR (2015). Single-nucleotide-resolution mapping of m6A and m6Am throughout the transcriptome. Nat. Methods 12, 767–772. [DOI] [PMC free article] [PubMed] [Google Scholar]
- Mauer J, Luo X, Blanjoie A, Jiao X, Grozhik AV, Patil DP, Linder B, Pickering BF, Vasseur J-J, Chen Q, et al. (2017). Reversible methylation of m6Am in the 5′ cap controls mRNA stability. Nature 541, 371–375. [DOI] [PMC free article] [PubMed] [Google Scholar]
- Mauer J, Sindelar M, Guez T, Vasseur J-J, Rentmeister A, Gross S, Pellizzoni L, Debart F, Goodarzi H, and Jaffrey SR (2018). The RNA demethylase FTO targets m 6 Am in snRNA to establish distinct methyl isoforms that influence splicing [Google Scholar]
- McAlister GC, Huttlin EL, Haas W, Ting L, Jedrychowski MP, Rogers JC, Kuhn K, Pike I, Grothe RA, Blethrow JD, et al. (2012). Increasing the Multiplexing Capacity of TMTs Using Reporter Ion Isotopologues with Isobaric Masses. Anal. Chem 84, 7469–7478. [DOI] [PMC free article] [PubMed] [Google Scholar]
- Meyer KD, Saletore Y, Zumbo P, Elemento O, Mason CE, and Jaffrey SR (2012). Comprehensive analysis of mRNA methylation reveals enrichment in 3’ UTRs and near stop codons. Cell 149, 1635–1646. [DOI] [PMC free article] [PubMed] [Google Scholar]
- Navarrete-Perea J, Yu Q, Gygi SP, and Paulo JA (2018). Streamlined Tandem Mass Tag (SL-TMT) Protocol: An Efficient Strategy for Quantitative (Phospho)proteome Profiling Using Tandem Mass Tag-Synchronous Precursor Selection-MS3. J. Proteome Res 17, 2226–2236. [DOI] [PMC free article] [PubMed] [Google Scholar]
- Petersen CP, Bordeleau ME, Pelletier J, and Sharp PA (2006). Short RNAs repress translation after initiation in mammalian cells. Mol. Cell [DOI] [PubMed] [Google Scholar]
- Shatkin AJ, and Manley JL (2000). The ends of the affair: Capping and polyadenylation. Nat. Struct. Biol 7, 838–842. [DOI] [PubMed] [Google Scholar]
- Sun H, Zhang M, Li K, Bai D, and Yi C (2019). Cap-specific, terminal N6-methylation by a mammalian m6Am methyltransferase. Cell Res 29, 80–82. [DOI] [PMC free article] [PubMed] [Google Scholar]
- Wei CM, Gershowitz A, and Moss B (1975). N6, O2’-dimethyladenosine a novel methylated ribonucleoside next to the 5’ terminal of animal cell and virus mRNAs. Nature 257, 251–253. [DOI] [PubMed] [Google Scholar]
- Wei J, Liu F, Lu Z, Fei Q, Ai Y, He PC, Shi H, Cui X, Su R, Klungland A, et al. (2018). Differential m6A, m6Am, and m1A Demethylation Mediated by FTO in the Cell Nucleus and Cytoplasm. Mol. Cell 71, 973–985.e5. [DOI] [PMC free article] [PubMed] [Google Scholar]
- Yang Y, Hsu PJ, Chen Y-S, and Yang Y-G (2018). Dynamic transcriptomic m6A decoration: writers, erasers, readers and functions in RNA metabolism. Cell Res 28, 616–624. [DOI] [PMC free article] [PubMed] [Google Scholar]
Associated Data
This section collects any data citations, data availability statements, or supplementary materials included in this article.