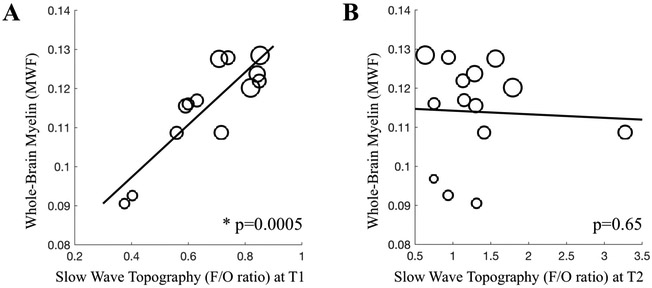
Figure 3. Prediction of whole brain myelin content by slow wave activity topography.
A. Frontal/Occipital ratio (F/O-ratio) of slow wave activity at T1 (Rho=0.84 p=0.0005; with partial correlation Rho=0.70, p=0.01, n=13). B. F/O-ratio of slow wave activity at T2 (p=0.65, n=14; and p=0.33 with n=13). Marker size refers to age, with larger circles indicating older age.

