

Abstract
The Social Approach Task is commonly used to identify sociability deficits when modeling liability factors for autism spectrum disorder (ASD) in mice. It was developed to expand upon existing assays to examine distinct aspects of social behavior in rodents and has become a standard component of mouse ASD-relevant phenotyping pipelines. However, there is variability in the statistical analysis and interpretation of results from this task. A common analytical approach is to conduct within-group comparisons only, and then interpret a difference in significance levels as if it were a group difference, without any direct comparison. As an efficient shorthand, we named this approach EWOCs: Erroneous Within-group Only Comparisons. Here we examined the prevalence of EWOCs and used simulations to test whether this approach could produce misleading inferences. Our review of Social Approach studies of high-confidence ASD genes revealed 45% of papers sampled used only this analytical approach. Through simulations, we then demonstrate how a lack of significant difference within one group often doesn’t correspond to a significant difference between groups, and show this erroneous interpretation increases the rate of false positives up to 25%. Finally, we define a simple solution: use an index, like a social preference score, with direct statistical comparisons between groups to identify significant differences. We also provide power calculations to guide sample size in future studies. Overall, elimination of EWOCs and adoption of direct comparisons should result in more accurate, reliable, and reproducible data interpretations from the Social Approach Task across ASD liability models.
Keywords: mice, social behavior, autism spectrum disorder, 3-chambered social approach task, Statistics, social preference index
Lay Summary
The Social Approach Task is widely used to assess social behavior in mice and is frequently used in studies modeling autism. However, reviewing published studies showed nearly half do not use correct comparisons to interpret these data. Using simulated and original data, we argue the correct statistical approach is a direct comparison of scores between groups. This simple solution should reduce false positives and improve consistency of results across studies.
Introduction
The Social Approach Task is one of the most widely used behavioral assays for investigation of mouse models of liability factors associated with autism spectrum disorder (ASD) (Bader et al., 2011; Chadman et al., 2008; Copping et al., 2017; Dougherty et al., 2013; Feyder et al., 2010; Grabrucker, Boeckers, & Grabrucker, 2016; Lugo, Swann, & Anderson, 2014; Maloney et al., 2018; Page, Kuti, Prestia, & Sur, 2009; Peñagarikano et al., 2015; Samaco et al., 2012; Schwartzer et al., 2013; Stoppel et al., 2018; Won et al., 2012). The use of the Social Approach Task has both helped identify ASD liability models with good face validity, and advanced our understanding of the circuitry underlying social approach deficits. Unlike reciprocal social interaction assays requiring manual scoring, the Social Approach Task is automated, making it ideal for mechanistic studies that require several experiments with different interventions or genetic models. For example, a recent study showed the role of dorsal raphe serotonergic connections to the nucleus accumbens in social approach behavior, and how stimulation of this pathway can correct social deficits in the 16p11.2 deletion model associated with ASD (Walsh et al., 2018). Another group showed NMDAR activation rescued social approach behavior in Shank2−/− and Tbr1+/− mutants (Lee et al., 2015; Won et al., 2012). Together these studies highlight the value in using this task to identify pathways that contribute to social approach behavior and targets that can be further interrogated as potential pharmacotherapy candidates.
The motivation behind development of the Social Approach Task was to improve face validity of murine social behavioral assays with regards to specific social impairments that characterize ASD (Moy et al., 2004; Nadler et al., 2004). Abnormal social approach is one such attribute of the ASD social phenotype. This task was unique in the field because it required the sociability be initiated by the test mouse. Thus, it was, and is, meant to help identify a lack of social interest in mice that may be reminiscent of the social approach deficits in humans with ASD. The typical version of this task comprises two test trials: the sociability trial and the preference for social novelty trial (Moy et al., 2004; Nadler et al., 2004), along with two preceding habituation trials. During the sociability trial, the test mouse can freely explore the 3-chambered apparatus to investigate either a novel conspecific stimulus in a restraining container (inverted wire cup) or an empty but otherwise identical wire cup (Figure 1A). Likewise, in the preference for social novelty trial, a new stimulus mouse is added to the empty cup, and the same test mouse is then assayed to examine preference for the novel mouse over the familiar mouse. The preference for social novelty trial is optional and some study designs require only an investigation of sociability. In addition, there are various deviations often used, including habituation to the wire cups, a novel object placed inside the non-social cup, and a 24-hr inter-trial interval for further social memory assessment (Molosh et al., 2014; Smith, White, & Lugo, 2016; Zhou et al., 2016), among others.
Figure 1. Illustration of the Social Approach Task and two different analytical approaches.
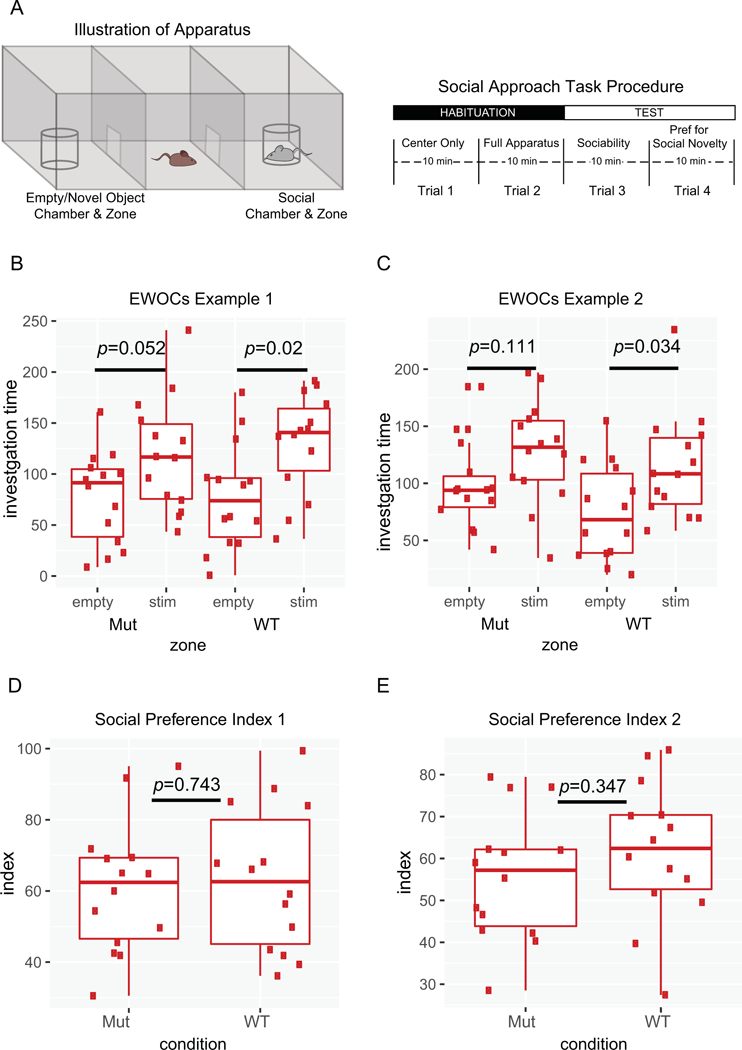
A) Schematic of Social Approach Task apparatus and typical procedure. B,C) Example plots from simulated data using EWOCs. Two arbitrary groups (‘Mut’ and ‘WT’) were tested for a within-group difference between the time spent with the social stimulus (stim) compared to the empty cup (empty). Only the WT group showed significant preference (p<0.05), while the Mut mice did not (p=0.052, or p=0.111). D,E) Example of these same data plotted as a social preference index:. Direct statistical comparison of Mut to WT indices shows no significant difference (p=0.743, 0.347).
The original Social Approach Task studies examined sociability and preference for social novelty in inbred mouse strains (Crawley, 2004; Moy et al., 2004; Nadler et al., 2004). The main purpose of these studies was to establish that most mouse strains exhibit sociability, and thus comparisons in these original studies were the within-group comparisons of time spent in the chamber or time spent sniffing the stimulus mice. As these were not comparisons of two groups, the experimental design of many of these original experiments did not allow for between-subjects comparisons during analysis. Subsequently, as researchers adapted this task to compare across groups, likely consulting these original studies for experimental and statistical design, many failed to incorporate the appropriate between-subjects comparisons needed for their own experimental designs. Thus, since the task was first developed, the within-group only analysis has also been perpetuated across studies of between-group factors, such as mutation of ASD candidate genes.
While it is relatively straightforward to test significance in the Social Approach Task with only one group, where the null hypothesis is ‘the mouse will spend equal time with both stimuli’, there is no gold-standard approach for comparing two different groups. One commonly used approach is to separately test the null hypothesis within each group, and then compare those results between groups. However, the accurate null hypothesis when comparing multiple groups is ‘the social preference of one group equals the other’. Therefore, considering only the within-group null hypothesis results in a flawed interpretation because the accurate null hypothesis is no longer tested. In other words, the lack of a statistically significant preference in one group is interpreted as a statistically significant difference between groups. We labeled this approach Erroneous Within-group Only Comparisons (EWOCs).
To directly test between groups, a commonly used and more statistically appropriate approach is a repeated measures ANOVA with appropriate between-subjects factors to examine stimulus interaction times. A related between-groups approach is to calculate a single value summarizing social preference for each mouse for downstream statistical testing. A commonly used social preference index is , which results in a value from 0 (all time with the empty cup) to 100 (all time with the stimulus mouse), where 50 represents equal time with both. Indices for each mouse can then be compared across groups with a t-test, ANOVA, or appropriate non-parametric test for nonnormal data. However, neither of these two approaches alone is complete. Examination of the original data is still imperative in this situation to confirm the control group demonstrates a preference for time spent with the social stimulus cup versus the empty/novel object cup.
Here, we further demonstrate why EWOCs should not be applied to identify a difference between groups in the Social Approach Task by using data simulations to show how EWOCs can be misleading. We also review recent mouse literature to characterize the widespread use of EWOCs. We further show how direct comparison of an index, like a social preference score, between groups may reduce false positives and improve consistency of results across studies, and provide power estimates, parameterized in data from >400 mice, to guide future studies. Finally, we present a standardized rubric for the analysis of the Social Approach Task between groups. We believe elimination of EWOCs from practice, and adoption of a standardized approach, will result in more robust and reproducible social approach findings when modeling ASD liability factors in mice.
Methods
Simulation studies
We conducted multiple analyses of simulated data to explore the frequency of erroneous inferences when using only EWOCs to determine a difference between groups. First, we collected all Social Approach data previously generated in the lab, which includes 217 mice previously published (Dougherty et al., 2013; Maloney et al., 2018) and an additional 204 mice subsequently tested (see Table 1 for descriptive data). Using these data, we calculated the mean interaction time in seconds (s) with the stimulus mouse (time[stim]; 124.06 ±52.90 [standard deviation, SD]), and the mean time with the empty cup (time[empty]; 87.51 ±40.59 [SD]). We then wrote a simple function in R to generate 1000 random experiments with a sample size of 10 per group using the function rnorm to sample two arbitrary groups (‘Mut’ and ‘WT’) from the same normal distribution with parameters derived from data above (time[stim]=124s, time[empty]=88s, SD=47s). Using this function, we calculated the frequency of incorrect interpretations when using EWOCs (conducting separate t-tests comparing time[stim] to time[empty] for Mut and WT groups and comparing the results) and repeated the thousand-experiment simulation ten times. Incorrect interpretations are any results that do not reveal both groups to have a social preference (e.g. both groups are not social, only Mut is social, or only WT is social). Second, we repeated this method and systematically varied the group sample size (n) from 2 to 30 to illustrate the vulnerability of EWOCs to false positives across n, and what happens when n is mismatched between groups. In this case, a false positive is the conclusion that the experimental group (Mut) is significantly different from the control group (WT), despite the fact that preference data for both groups were drawn from the same distribution and, thus, an appropriate statistical test would reveal they do not significantly differ 95% of the time. Third, we modeled the consequences of varying the magnitude of social preference by changing the mean of the sampled normal distributions across a range of values. We set indices for a range of social preference values from 50 (no preference) to 75 (a 3-fold preference for the stimulus mouse) by setting values of time[stim] from 106 to 159s (and correspondingly adjusted the mean for time[empty]). Fourth, we modeled the effect of differential group variability by increasing the standard deviation of only the Mut group from 47 to 78 but keeping the mean preferences the same for both groups.
Table 1.
Descriptive statistics for simulation analyses data collected in the Dougherty laboratory.
| Total sample size | Sex Distribution | Grouping Distribution | Background Strain | Reference | ||
|---|---|---|---|---|---|---|
| Females | Males | Experimental | Control | |||
| 20 | 0 | 20 | 11 | 9 | C57BL/6J | Dougherty et al. 2013 J Neurosci |
| 197 | 99 | 98 | 113 | 84 | C57BL/6J | Maloney et al. 2018 eNeuro |
| 121 | 69 | 52 | 75 | 46 | Hybrid C57BL/6J × FVB | Kopp et al 2019 BioRxiv [Preprint] |
| 69 | 38 | 31 | 51 | 18 | FVB | Unpublished |
| 14 | 7 | 7 | 0 | 14 | C57BL/6J | Unpublished |
| TOTAL: 421 | 213 | 208 | 250 | 171 | -- | -- |
We then repeated all the above analyses, but instead calculated the frequency of erroneous inferences when transforming the time into a social preference index, defined as , and then conducting a t-test comparing indices of the two groups. In addition, we duplicated all our analyses using simulations based on parameters extracted from a published paper (Filipello et al., 2018), using chamber time instead of investigation zone time, which yielded substantially similar conclusions.
Systematic review of the literature
To assess the potential impact of EWOCs in ASD-related research, we systematically reviewed the literature referenced in the SFARI Animal Models database (Kumar et al., 2011) (accessed July 18, 2018) for genes with a score of 1, classified as High Confidence. We further limited this to the 29 papers that used the Social Approach Task, including both the sociability (all 29 papers) and preference for social novelty (a subset of 25 papers) trials. From these papers, we extracted the results for the sociability and preference for social novelty trials, sample size, and whether EWOCs were used. If a study used both within-group and between-group comparisons, it was not counted as an EWOCs study. Finally, an independent researcher reread all studies to confirm only this interpretation was used.
Power calculations
We estimated the required group sizes with the pwr.t.test function in R, using settings for two samples with a one-tailed hypothesis, where the direction of the effect is predicted prior to the study. We ran the algorithm for three magnitudes of power (.7, .8, and .9) and systematically varied the effect size across a range of plausible values. We parameterized our calculation of effect size (Cohen’s d) using values based on the >420 mice from our lab. Specifically, we set the pooled standard deviation for the social preference index at 15.64 (the standard deviation of our mice), calculated effect sizes assuming a mutant group would have no social preference (a group mean of 50) and varied the corresponding wild-type preference to between 54 to 66. These preference values range from below the group mean of our least social group (54.81) to slightly above our most social group (63.3) and the mean of the reviewed published studies (64.17). Resulting group sizes were then plotted as a function of effect size and desired power.
Results
Interpreting EWOCs as a difference between groups is fundamentally flawed logic.
We first present a simple illustration from simulated data to demonstrate how a within-group only comparative approach to analysis could lead to erroneous inference (Figure 1B). In these simulated data of a sociability trial, the mutant mice do not show a statistically significant social preference, with p=0.052. As this exceeds the critical alpha cutoff of 0.05, it does not result in a rejection of the null hypothesis. The WT mice, however, reach p=0.02, which passes the cutoff. The null hypothesis is rejected, and the WT mice are considered to have shown a statistically significant preference for the social stimulus. Even though the outcome of the tests within the groups are different for mutant and WT mice, does this mean there is a significant difference in the social preference between these groups or is it a false positive? In this example, where p-values are just on either side of the threshold, it becomes obvious that a separate statistical test is necessary to determine if the groups themselves are statistically different. Indeed, calculating a social preference index and comparing them directly for these same data reveals there is no difference between the groups (Figure 1D). However, in an alternate scenario, where WT mice exceed the critical alpha with p=0.034 but mutants only reach p=0.111 (Figure 1C), it may not be obvious, despite the appropriate statistical test revealing there is no significant difference in this case either (Figure 1E). To reiterate, a lack of difference in time spent with each stimulus within one group does not indicate a significant difference in sociability between the groups.
Unfortunately, this simple statistical misinterpretation exists widely in the neuroscience literature and is applied to many kinds of experiments (Nieuwenhuis, Forstmann, & Wagenmakers, 2011). It also exists in key papers evaluating genetic mouse models of ASD liability. In the studies reviewed from the SFARI database, EWOCs were employed in 13 of 29 (44.8%) studies showing a phenotype in the sociability trial, and 11 of the 25 (44.0%) studies that also included the preference for social novelty trial. Thus, use of EWOCs are widespread.
This raises important questions: To what extent might these represent false positive results? Could widespread use of EWOCs account for why there are such challenges in finding reproducible phenotypes in behavioral models (Kafkafi et al., 2018)? In order to determine how vulnerable this approach is to false positive interpretations, we conducted extensive simulation studies as detailed below.
Simulations demonstrate EWOCs result in an elevated rate of false positives, dependent on sample number.
We first modeled how likely false positive results would be when using EWOCs. To base the simulation on real parameters, we examined social approach data from all mice previously tested in our lab to identify typical mean interaction times and standard deviations. We also extracted the data examined in all 29 datasets from the reviewed papers for comparison. We found the median group size was n=16 across the 29 papers (Figure 2A), with studies ranging from 6 to 30. We then generated random data for two groups with no true difference in their social preference (drawing from the same normal distribution) such that both ‘WT’ and ‘Mut’ groups should have a 1.5-fold preference for the social stimulus over the empty cup (social preference index=60; Figure 2B). We then systematically varied the n in each group from 5 to 30 and conducted 10 simulations of 1000 studies at each n. When we simulated n at the median of published studies (i.e. 16 per group), we observed a false positive rate of 25% using EWOCs (Figure 2C). Specifically, a false positive result is when the conclusion is that the two groups are different (e.g. Figure 1B,C), since in these simulated data the two groups were drawn from the same distribution. Even extending n to 25, we still observed a false positive rate of 10%, which is approximately 2 times higher than the false positive rate of 0.05 that is the standard accepted critical alpha in the field. Note that a solution for controlling the false positive rate is quite simple: a t-test assessing the social preference index, with p<0.05 critical alpha cutoff, results in the false positive rate of 5%, regardless of n (Figure 2D). Similar results are also achieved if one analyzes the stimulus interaction times across groups using a mixed ANOVA with between- and within-subjects simple main effects following significant interaction terms (not shown). Importantly, if n is imbalanced, then statistical power is also imbalanced. For example, sometimes mutants are harder to generate than WTs (indeed, ⅓ of the reviewed studies had smaller mutant than WT groups). This might further inflate false positive rates when EWOCs are used. By varying n for ‘Mut’ but keeping n=12 for ‘WT,’ we show this is the case (Figure 2E). Again, this can be corrected by directly comparing groups statistically (Figure 2F).
Figure 2. Using EWOCs can result in substantially elevated false positive rates, especially at low sample sizes.
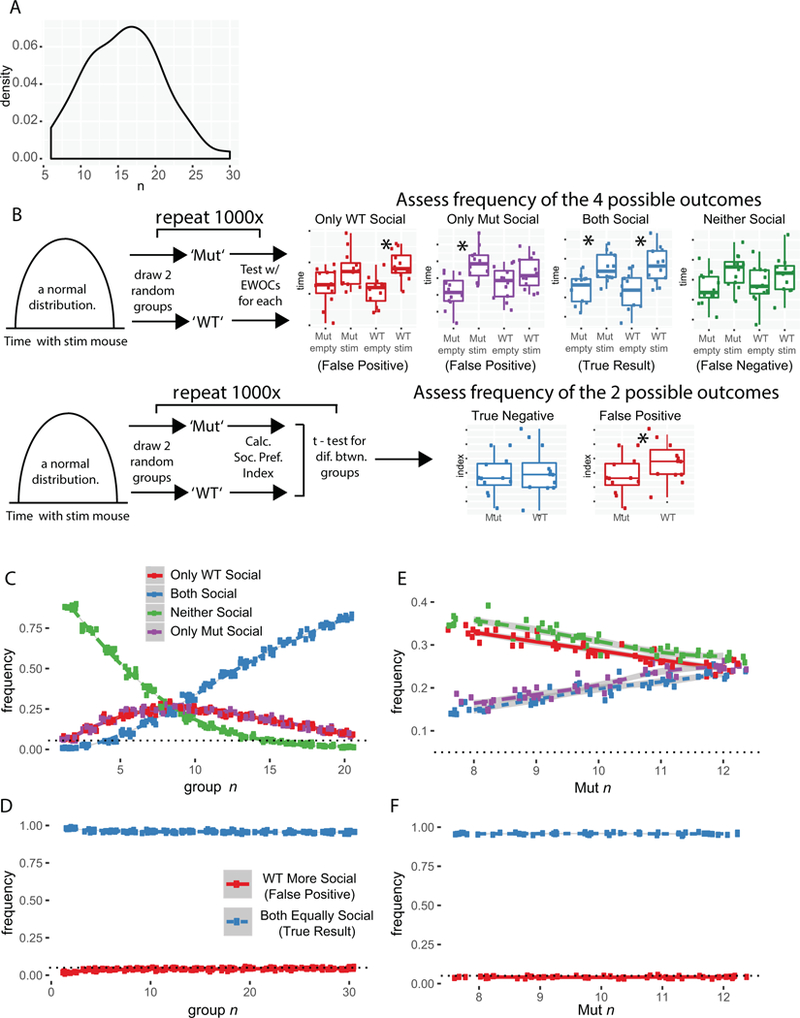
A) Distribution of group sizes (combined for genotype) across 77 groups in 29 papers. B) Cartoon of simulations and possible outcomes. Two groups (‘Mut’ and ‘WT’) are drawn from the same distribution with identical social preference magnitude, and then tested with EWOCs (upper panel) or a social preference index (lower panel). C) Plot of simulations results as function of n, after 10 × 1000 simulated experiments for each n, drawing two groups from the same distribution and analyzing with EWOCs. The true result is both groups are social (Blue), so incorrect conclusions were drawn a substantial proportion of the time. D) Plot of t-test on social preference index, showing false positive rate as a function of n. E) Simulation plot as a function of imbalanced n with WT n=12, and Mut n varied from 8 to 12, using EWOCs. F) Simulation plot as a function of imbalanced n, using t-test on the social preference index.
It is worth noting that even with equal n, other results can also occur. For example, if WT and mutant mice are truly not different, there is an equal chance that the ‘Mut’ mice will show a significant preference for the social stimulus in the same trial that the ‘WT’ mice do not (Figure 2B,C; purple lines). There is also a chance, especially at low n, that neither group will show a significant within-group result (Figure 2B,C; green lines). Given the known bias in published literature for positive over negative results (Matosin, Frank, Engel, Lum, & Newell, 2014), it is likely that either of these possibilities are underreported in the literature. For example, they may simply be considered failed trials by the experimenters and repeated, since the positive control (i.e. a preference for the stimulus mouse in the WT group) did not work. One danger of this repeated EWOCs approach is that it could further increase the possibility of a false positive, as the experiment would be repeated until the outcome is either both groups are social, or only the mutants have a deficit. Overall, even with a single experiment of simulated data at n=16, there is only a <70% chance of correctly identifying both groups as social.
Simulation demonstrates EWOCs false positive rates are also influenced by magnitude of social preference.
Of course, statistical power is also a function of effect size – in this case, the magnitude of the social preference. In our first model, we assumed a 1.5-fold preference for the stimulus mouse over the empty cage, modeling a normal distribution with a mean interaction time of 126 seconds with the stimulus mouse and 86 seconds with the empty cup (giving a social preference index of 60). While this is a plausible social preference magnitude, and slightly higher than the mean we saw in our reanalyzed mice (124.06), it is a bit below the median social preference index of published groups (64.41 [58.96–69.70 interquartile range (IQR)]; across all 77 groups of extractable data from the 29 studies; Figure 3A). Therefore, we also fixed n at 10 and varied the simulated preference of all mice for the social stimulus. This showed a high rate of erroneous inference resulting from EWOCs. Interestingly, a social preference index around 64 was particularly vulnerable to EWOCs false positive interpretation (Figure 3B), with rates at nearly 25%. Note, differences in effect size are also readily controlled by appropriately comparing the two groups statistically (Figure 3C).
Figure 3. Elevation of false positive rates depends on the magnitude of the social preference when EWOCs are used.
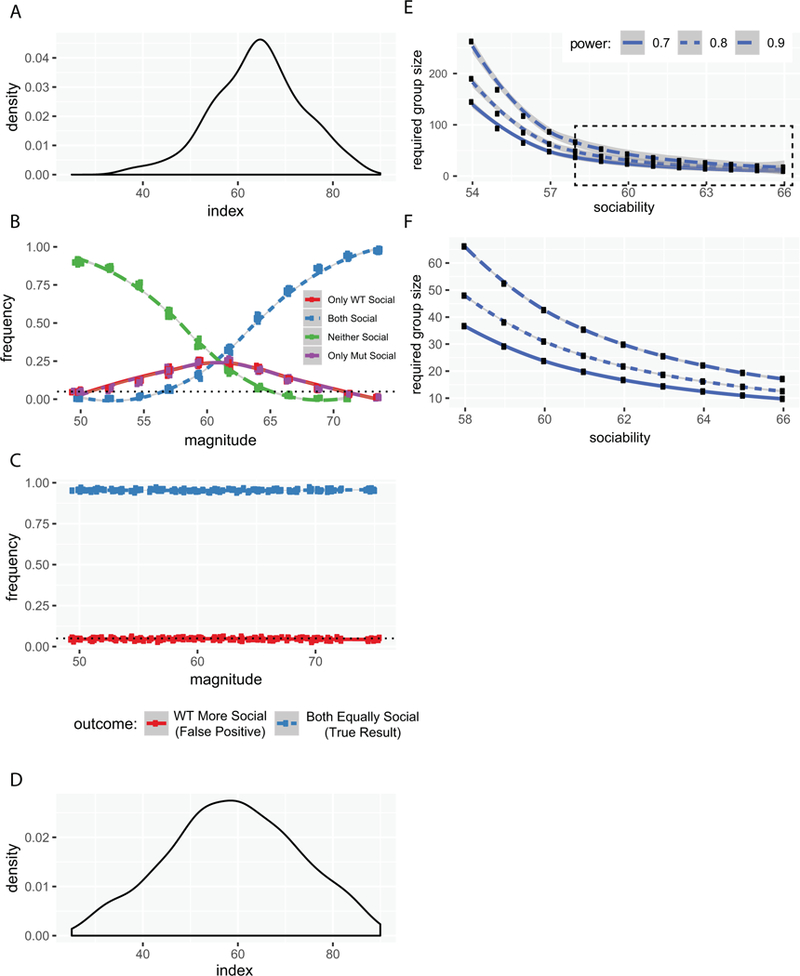
A) Distributions of average magnitudes of social preference indices across groups from the 29 reviewed studies. B) Plot of outcomes as a function of social preference magnitude when using EWOCs. C) Plot of false positive rate as a function of social preference magnitude when using t-test on social preference index. D) Distributions of magnitudes of social preference indices from all mice run in our lab (n=421). E) Power calculations showing required n per group as a function of the WT social preference index, to have 70%, 80%, or 90% power to detect a difference at 0.05. F) Same, replotting boxed region from E.
Also worth discussion is the possibility the published median social preference magnitude is slightly inflated compared to the actual social preference, again, because of the bias towards publication of positive results. Indeed, if we plot the social preference index of the last 421 mice analyzed in our lab (Figure 3D), published or not, we see a median preference of 58.95 (48.95–68.48 IQR) for the sociability trial, and 63.49 (51.69–71.64 IQR) for the mice that were also tested in the preference for social novelty trial (n=325, not shown). We also noticed a commonly used inbred strain (FVB/AntJ, e.g the standard background strain of FMRP mutants) showed a marginally lower social preference index than the more ubiquitous inbred C57BL/6J strain (54.8 vs. 60.1, Welch’s t-test t=2.3128, p=0.023, df=107.03), and, generally, males showed a higher social preference index than females across strains (60.98 vs 55.04, t=3.9615 p=8.7E-5, df=418.72). Thus, the expected magnitude of social preference in this task may vary by sex and strain, and may be low enough to warrant increased n when using both sexes for experiments, which is an important practice, and currently required by NIH funding, for many reasons, including the sexually dimorphic nature of various diseases.
Therefore, as a resource, we have estimated the number of animals required to have well-powered studies detecting an absence of social preference (i.e. social preference index of 50 or less) in a mutant group compared to a variety of potential wild-type group preference index levels. Our estimates show that to have 80% power to detect a significant effect requires approximately 30 animals per group using both sexes of C57BL/6J mice, and possibly substantially more with other strains (Figure 3E–G), though such strains may be better when assaying manipulations that increase sociability. Further, social novelty trials, where the effect size is typically somewhat larger, would require fewer animals. Finally, these power calculations highlight the nuance of interpreting a negative result even with correct between-group comparisons (especially reanalyzing historic data with smaller n): a p>0.05 can always mean the effect of the mutation could simply be too small to see reliably given the group sizes used in a particular study.
Simulation demonstrates that behavioral disruptions that increase variance in mutants will also lead to higher false positive rates with EWOCs.
Finally, there are even more subtle features of mouse behavior that might lead to inflated false positive rates with EWOCs. This is because commonly used test statistics are defined as the difference in the means divided by a measure of variance. Thus, if one group is significantly more variable than another, it is less likely to have a large test statistic and thus less likely to achieve a significant p-value. For example, if mutant mice tend to have a compulsive grooming phenotype making their movement in the task more stochastic (i.e. they might spontaneously enter a long bout of compulsive grooming) then their variance might simply be higher in this task compared to controls. It is hard to determine how frequently such a thing might be occurring in the literature, but it is straightforward to model – holding a constant n (10) and social preference index (60), we altered the variance of the distribution from which we drew the ‘Mut’, but not the ‘WT’, group. This profoundly decreased the ability to detect a significant social preference in the ‘Mut’ group (Figure 4A), and, interestingly, this phenomenon could not be readily rescued by increasing n (Figure 4B,C). Thus, mutations that increase variability in mouse behavior, when using EWOCs, can mask true social preference. Again, when you directly compare groups statistically, the false positive rate stays at a well-controlled 5% (Figure 4D).
Figure 4. Increased variance in mutants can also lead to inflated false positive rates when EWOCs are used.
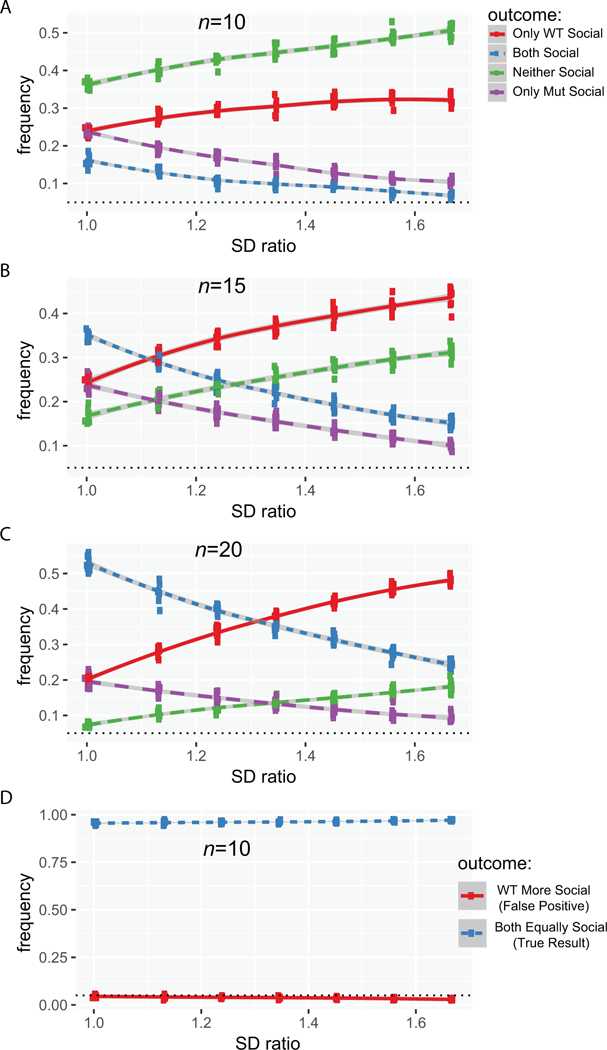
A) Plot of false positive results when using EWOCs as a function of increased variance in only Mut at n=10, B) at n=15, C) at n=20. D) Plot of t-test false positive rate as a function of increased variance at n=10. SD Ratio: the ratio of the Mut to the WT standard deviation (SD; varied from 1 to 1.5).
To demonstrate that the flawed logic of EWOCs extend to chamber time data, as well, we duplicated all our above analyses using simulations based on means and standard deviations extracted from a published paper (Filipello et al., 2018) using chamber time instead of investigation zone time. The results were substantially similar (data not shown). This further indicates the results of our simulations were robust across parameters derived from multiple groups.
Discussion
The Social Approach Task has been heavily relied on to assess social behavior phenotypes in genetic liability factors for ASD. Thus, it is essential to use appropriate statistical approaches to ensure proper interpretation of the results. Only this will allow for correct conclusions to be drawn about the influence of ASD candidate genes and other liability factors on social approach circuits.
In almost half of published papers based on our sampling, the interpretation of results of this task were based on within-group only comparisons without a direct comparison between the experimental and control groups. Thus, Erroneous Within-group Only Comparisons (EWOCs) are frequently interpreted as a difference between groups. The problem with using this approach, essentially concluding that ‘if the result is not significant, sociability is absent’, is that statistical tests are designed only to identify significant differences. They are not designed to identify a significant lack of differences. In other words, the correct interpretation when p>.05 is not “We are 95% confident there is no difference in preference between the mouse and the cup.” It is “We are not 95% confident that there is a difference between the mouse and the cup.” Statistical tests would have to be completely redesigned to be able to state with 95% confidence that there is no preference, and it is far simpler to directly compare the relevant groups with standard tests. We refer the reader back to the example in Figure 1B illustrating how EWOCs do not hold up against a direct comparison between groups. Of course, when the p-value of the mutant group is presented and shown to be very close to .05, the logical flaw becomes more evident and many scientists would interpret their own findings with caution, even if using EWOCs. But consider alternate scenarios where wild-type mice were perhaps p<.04 and mutants were p<.12 (Figure 1C). Often a result of p<.12 would not be considered approaching significance and would not be shown. Yet this result could equally fairly be stated as “We are 96% certain that the wild-type mice are social, and 88% certain that the mutant mice are social.” Expressed this way, few scientists would be confident that the mutant mice have a significant social deficit.
It could be argued that sociability in this task should be considered a binary outcome measure rather than a quantitative trait. Yet, evidence suggests this is not a categorical phenotype and these data are indeed continuous. Multiple studies have now shown that typical sociability can be heightened following stimulation of different pathways in the brain (Shin et al., 2018; Walsh et al., 2018). For example, optogenetic stimulation of the dorsal raphe neurons or their fibers in the nucleus accumbens increased the social preference index in WT mice (Walsh et al., 2018). Pharmacological agents have also shown promise as a means to ameliorating abnormal social approach behaviors. It was recently shown that Melanotan-II, a melanocortin receptor 4 agonist that stimulates oxytocin activity, corrected the social approach deficits in male mice of the Maternal Immune Activation model (Minakova et al., 2019). Thus, to better screen for treatment effects in this task, which are likely to be quantitative and not qualitative, it is valuable to analyze social approach as continuous. Clearly this phenotype has a range that can be altered and deserves appropriate quantification. We have tried to make the argument here that directly comparing groups using an index, such as a social preference score, creates a suitably quantitative design, provided sufficient n is used, to overcome variability inherent in mouse behavior.
Furthermore, we have included power analyses to help guide the selection of sample sizes that will be needed to confidently overcome this variability. These sample sizes also assume a complete loss of sociability in the mutants. If the phenotype is only partial, sample size would have to be correspondingly higher. Nonetheless, while the sample size required in C57BL/6J is substantially higher than often used (Figure 2A), it is still reasonably achievable. However, the very high sample size required in some combinations of sex and strain suggests that considering new variations of the method that further automate the task, or that collect more repeated measures of the same mice to reduce the per mouse variance, could offer pragmatic solutions to improving power. Indeed, it is interesting that the social novelty trial is better powered (because of its larger effect size) than the sociability trial. Since the preference for social novelty trial is typically run with the same mice after they have experienced the sociability trial, it might be that further exposing the same mice to the Social Approach Task over multiple days allows for better estimates of the social preference of each, enabling studies that don’t require as large of a sample size.
In our review of studies investigating High Confidence ASD genes, almost half of studies we examined used a flawed statistical logic to interpret the Social Approach Task results. Of these studies, 85% (11/13) concluded that the mutation impaired social behavior, and it is worrying that a substantial fraction of these might be false positives. Yet, despite the flawed statistical approach, it is possible these studies would truly show a difference between mutant and controls if these data were analyzed with an appropriate between-subjects design. For the authors with primary data, it may be worth assessing whether this is the case. For example, in one of our prior publications, along with the standard paradigm, we employed a variation of the task we hypothesized might be more sensitive to measure preference for social novelty (cagemate versus novel conspecific) (Dougherty et al., 2013). We also examined time spent investigating a cagemate versus an empty cup. We encountered an odd situation in which the mutant mice showed a significant preference for the cagemate, whereas the control mice did not. We interpreted these within-subject differences as no deficits in sociability towards a cagemate in the mutant mice given that there were no between-subjects differences in time with the cagemate or empty cups. However, while we conducted a full repeated measures ANOVA design that included between-group simple main effects, we did not provide those results and explicitly state that the between-subjects comparisons were non-significant, thus creating ambiguity in the interpretation of our results. Therefore, here we conducted a reanalysis of these data using the preference score. This provides clear evidence that there was no difference between genotypes for sociability towards a cagemate (Control: M=55.48, SD=9.96; Mutant: M=62.72, SD=13.38; t(16)=1.226, p=0.238). We provide this example of our own data to demonstrate how ambiguous studies can be quickly reanalyzed for clarity. Similarly, another published study from which we drew simulation parameters (Filipello et al., 2018) were able to rapidly analyze their data and confirm a between-group difference in their mutants (Dr. Matteloi, personal communication). Other key studies that used EWOCs may benefit from corrigendums or preprint postings clarifying the results when these data are reanalyzed using direct statistical comparisons between groups. If prior studies were actually not significant, it could have important implications on future studies involving these ASD liability genes.
It is worth noting that the use of a social preference index is only valid if used in combination with some analysis of original data as well. Exclusive use of a preference score could also lead to flawed conclusions under some circumstances. For example, without confirmation of a preference for time spent with the social stimulus cup versus the empty/novel object cup in the control group, a direct comparison of a social preference index between controls and the experimental group is meaningless; if there is not a within-group preference detected with a reasonable n of control animals, this may indicate some problem in the execution of the task. Likewise, the absolute time values of both groups are also important to examine during data analysis. There may be an instance in which the social preference index is not different between groups, but the absolute time spent with the stimuli is greatly reduced or increased in the experimental group. A clear example of this can be found in Lee et al. (2015), in which the greatly reduced absolute investigation times in Shank2 homozygous mutants was found to be due to motor stereotypies. This interesting phenotype may not have been detected if only the social preference index was examined. Visual investigations of absolute time plots and additional analysis with a repeated measure ANOVA should always be part of the analytical pipeline of these data.
To provide a standardized rubric, we have included a decision tree (Figure 5) that schematizes what we think is the best approach to analyze data from the Social Approach Task. This includes a repeated measures ANOVA at the apex of the tree. The preference index should be in addition to a full factorial repeated measures (mixed model) ANOVA as a substitution for erroneous interpretation of multiple within-subjects comparisons but not as a substitution for examination of the original data. We have provided a sample script (https://bitbucket.org/jdlabteam/ewocs/src/master/social_approach_analysis_files/) for SPSS code implementing such an analysis to facilitate adoption by the field.
Figure 5. Social Approach Task data analysis decision tree.
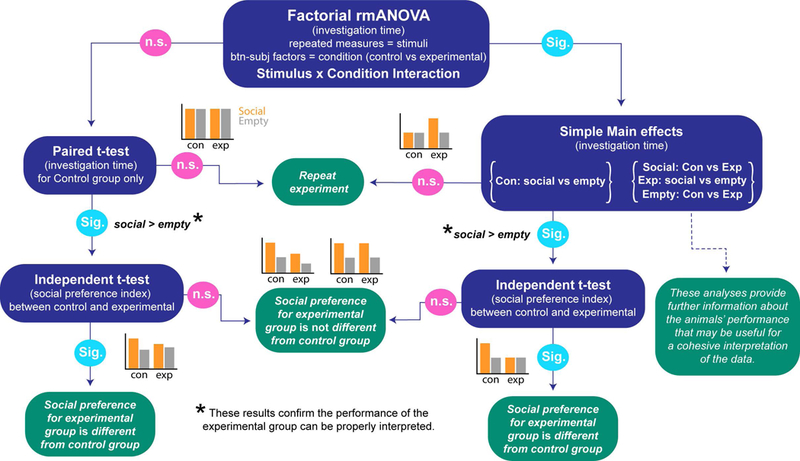
A decision tree schematizing a statistical pathway for Social Approach Task data analysis, provided the data are normal and meet the other assumptions of univariate analysis. The blue bubbles present statistical tests with dependent variable of interest in parentheses. The green bubbles present interpretations of the test results. Sig. = significant; n.s. = non-significant. Example graphs provide representations of possible data for each outcome (con = control group, exp = experimental group).
While we have highlighted the occurrence of EWOCs with regards to this one assay, this flaw certainly has been seen in a variety of other experiments in the past (Nieuwenhuis et al., 2011), and the same erroneous logic could easily be applied to a variety of other experiments in behavior (e.g. novel object recognition task) and beyond. A very similar paradigm in voles, the partner preference task, is easily susceptible to a similarly flawed approach to analysis, and preference indices are being used more frequently in this field, as well (Beery & Zucker, 2010). We have been very deliberate in developing a novel term as we hope that providing a simple name for the phenomenon (“EWOCs”) will aid in rapid recognition of this flaw when it occurs. More importantly, we hope the presentation of a simple solution (direct statistical comparisons) will encourage authors, editors, and reviewers to root out this kind of inference from the literature generally, and from this assay specifically.
Excellent standardized behavioral assays are essential for assessing face validity of mouse models of ASD liability and discovering new therapeutic options. A vital aspect of the validity and reliability of an assay is appropriate interpretation of its data, which requires the correct statistical approaches. The Social Approach Task is a valuable tool to assess mouse social approach behavior, one domain that could be related to the abnormal social phenotype in ASD. As such, it has been used extensively over the last 14 years and will likely continue to be frequently applied to various mouse models. Our hope, moving forward, is to begin to apply more appropriate statistical analyses to Social Approach Task data so that accurate, reliable, and reproducible conclusions are drawn across ASD liability models. This will allow the ASD research community to move forward confidently with studies of new therapeutic strategies based on convincing and concrete results.
Acknowledgements
This work was supported by 1R01MH107515 (J.D.D.), NIH training grant 5T32GM007067–43 (K.R.N.) and NSF Graduate Research Fellowship DGE-1745038 (K.R.N.). The authors thank Dr. John Constantino, Dr. Chris Gunter, Dr. Carla Yuede and Dr. Joshua Dearborn for valuable discussion during the preparation of this manuscript.
References
- Bader PL, Faizi M, Kim LH, Owen SF, Tadross MR, Alfa RW, … Shamloo M (2011). Mouse model of Timothy syndrome recapitulates triad of autistic traits. Proceedings of the National Academy of Sciences of the United States of America, 108(37), 15432–15437. 10.1073/pnas.1112667108 [DOI] [PMC free article] [PubMed] [Google Scholar]
- Beery AK, & Zucker I (2010). Oxytocin and same-sex social behavior in female meadow voles. Neuroscience, 169(2), 665–673. 10.1016/j.neuroscience.2010.05.023 [DOI] [PubMed] [Google Scholar]
- Chadman KK, Gong S, Scattoni ML, Boltuck SE, Gandhy SU, Heintz N, & Crawley JN (2008). Minimal aberrant behavioral phenotypes of neuroligin-3 R451C knockin mice. Autism Research, 1(3), 147–158. 10.1002/aur.22 [DOI] [PMC free article] [PubMed] [Google Scholar]
- Copping NA, Berg EL, Foley GM, Schaffler MD, Onaga BL, Buscher N, … Yang M (2017). Touchscreen learning deficits and normal social approach behavior in the Shank3B model of Phelan–McDermid Syndrome and autism. Neuroscience, 345, 155–165. 10.1016/j.neuroscience.2016.05.016 [DOI] [PMC free article] [PubMed] [Google Scholar]
- Crawley JN (2004). Designing mouse behavioral tasks relevant to autistic-like behaviors. Mental Retardation and Developmental Disabilities Research Reviews, 10(4), 248–258. 10.1002/mrdd.20039 [DOI] [PubMed] [Google Scholar]
- Dougherty JD, Maloney SE, Wozniak DF, Rieger MA, Sonnenblick L, Coppola G, … Heintz N (2013). The disruption of Celf6, a gene identified by translational profiling of serotonergic neurons, results in autism-related behaviors. Journal of Neuroscience, 33(7), 2732–2753. [DOI] [PMC free article] [PubMed] [Google Scholar]
- Feyder M, Karlsson R-M, Mathur P, Lyman M, Bock R, Momenan R, … Holmes A (2010). Association of Mouse Dlg4 (PSD-95) Gene Deletion and Human DLG4 Gene Variation With Phenotypes Relevant to Autism Spectrum Disorders and Williams’ Syndrome. American Journal of Psychiatry, 167(12), 1508–1517. 10.1176/appi.ajp.2010.10040484 [DOI] [PMC free article] [PubMed] [Google Scholar]
- Filipello F, Morini R, Corradini I, Zerbi V, Canzi A, Michalski B, … Matteoli M (2018). The Microglial Innate Immune Receptor TREM2 Is Required for Synapse Elimination and Normal Brain Connectivity. Immunity, 48(5), 979–991.e8. 10.1016/j.immuni.2018.04.016 [DOI] [PubMed] [Google Scholar]
- Grabrucker S, Boeckers TM, & Grabrucker AM (2016). Gender Dependent Evaluation of Autism like Behavior in Mice Exposed to Prenatal Zinc Deficiency. Frontiers in Behavioral Neuroscience, 10 10.3389/fnbeh.2016.00037 [DOI] [PMC free article] [PubMed] [Google Scholar]
- Kafkafi N, Agassi J, Chesler EJ, Crabbe JC, Crusio WE, Eilam D, … Benjamini Y (2018). Reproducibility and replicability of rodent phenotyping in preclinical studies. Neuroscience & Biobehavioral Reviews, 87, 218–232. 10.1016/j.neubiorev.2018.01.003 [DOI] [PMC free article] [PubMed] [Google Scholar]
- Kumar A, Wadhawan R, Swanwick CC, Kollu R, Basu SN, & Banerjee-Basu S (2011). Animal model integration to AutDB, a genetic database for autism. BMC Medical Genomics, 4, 15 10.1186/1755-8794-4-15 [DOI] [PMC free article] [PubMed] [Google Scholar]
- Lee E-J, Lee H, Huang T-N, Chung C, Shin W, Kim K, … Kim E (2015). Trans-synaptic zinc mobilization improves social interaction in two mouse models of autism through NMDAR activation. Nature Communications, 6, 7168 10.1038/ncomms8168 [DOI] [PMC free article] [PubMed] [Google Scholar]
- Lugo JN, Swann JW, & Anderson AE (2014). Early-life seizures result in deficits in social behavior and learning. Experimental Neurology, 256, 74–80. 10.1016/j.expneurol.2014.03.014 [DOI] [PMC free article] [PubMed] [Google Scholar]
- Maloney SE, Akula S, Rieger MA, McCullough KB, Chandler K, Corbett AM, … Dougherty JD (2018). Examining the Reversibility of Long-Term Behavioral Disruptions in Progeny of Maternal SSRI Exposure. ENeuro, ENEURO 0120–18.2018. 10.1523/ENEURO.0120-18.2018 [DOI] [PMC free article] [PubMed]
- Matosin N, Frank E, Engel M, Lum JS, & Newell KA (2014). Negativity towards negative results: a discussion of the disconnect between scientific worth and scientific culture. Disease Models & Mechanisms, 7(2), 171–173. 10.1242/dmm.015123 [DOI] [PMC free article] [PubMed] [Google Scholar]
- Minakova E, Lang J, Medel-Matus J-S, Gould GG, Reynolds A, Shin D, … Sankar R (2019). Melanotan-II reverses autistic features in a maternal immune activation mouse model of autism. PLOS ONE, 14(1), e0210389 10.1371/journal.pone.0210389 [DOI] [PMC free article] [PubMed] [Google Scholar]
- Molosh AI, Johnson PL, Spence JP, Arendt D, Federici LM, Bernabe C, … Shekhar A (2014). Social learning and amygdala disruptions in Nf1 mice are rescued by blocking p21-activated kinase. Nature Neuroscience, 17(11), 1583–1590. 10.1038/nn.3822 [DOI] [PMC free article] [PubMed] [Google Scholar]
- Moy SS, Nadler JJ, Perez A, Barbaro RP, Johns JM, Magnuson TR, … Crawley JN (2004). Sociability and preference for social novelty in five inbred strains: an approach to assess autistic-like behavior in mice. Genes Brain Behav, 3(5), 287–302. 10.1111/j.1601-1848.2004.00076.x [DOI] [PubMed] [Google Scholar]
- Nadler JJ, Moy SS, Dold G, Trang D, Simmons N, Perez A, … Crawley JN (2004). Automated apparatus for quantitation of social approach behaviors in mice. Genes Brain Behav, 3(5), 303–314. 10.1111/j.1601-183X.2004.00071.x [DOI] [PubMed] [Google Scholar]
- Nieuwenhuis S, Forstmann BU, & Wagenmakers E-J (2011). Erroneous analyses of interactions in neuroscience: a problem of significance. Nature Neuroscience, 14(9), 1105–1107. 10.1038/nn.2886 [DOI] [PubMed] [Google Scholar]
- Page DT, Kuti OJ, Prestia C, & Sur M (2009). Haploinsufficiency for Pten and Serotonin transporter cooperatively influences brain size and social behavior. Proceedings of the National Academy of Sciences, 106(6), 1989–1994. 10.1073/pnas.0804428106 [DOI] [PMC free article] [PubMed] [Google Scholar]
- Peñagarikano O, Lázaro MT, Lu X-H, Gordon A, Dong H, Lam HA, … Geschwind DH (2015). Exogenous and evoked oxytocin restores social behavior in the Cntnap2 mouse model of autism. Science Translational Medicine, 7(271), 271ra8–271ra8. 10.1126/scitranslmed.3010257 [DOI] [PMC free article] [PubMed] [Google Scholar]
- Samaco RC, Mandel-Brehm C, McGraw CM, Shaw CA, McGill BE, & Zoghbi HY (2012). Crh and Oprm1 mediate anxiety-related behavior and social approach in a mouse model of MECP2 duplication syndrome. Nature Genetics, 44(2), 206–211. 10.1038/ng.1066 [DOI] [PMC free article] [PubMed] [Google Scholar]
- Schwartzer JJ, Careaga M, Onore CE, Rushakoff JA, Berman RF, & Ashwood P (2013). Maternal immune activation and strain specific interactions in the development of autism-like behaviors in mice. Translational Psychiatry, 3(3), e240 10.1038/tp.2013.16 [DOI] [PMC free article] [PubMed] [Google Scholar]
- Shin S, Pribiag H, Lilascharoen V, Knowland D, Wang X-Y, & Lim BK (2018). Drd3 Signaling in the Lateral Septum Mediates Early Life Stress-Induced Social Dysfunction. Neuron, 97(1), 195–208.e6. 10.1016/j.neuron.2017.11.040 [DOI] [PMC free article] [PubMed] [Google Scholar]
- Smith GD, White J, & Lugo JN (2016). Superimposing Status Epilepticus on Neuron Subset-Specific PTEN Haploinsufficient and Wild Type Mice Results in Long-term Changes in Behavior. Scientific Reports, 6, 36559 10.1038/srep36559 [DOI] [PMC free article] [PubMed] [Google Scholar]
- Stoppel LJ, Kazdoba TM, Schaffler MD, Preza AR, Heynen A, Crawley JN, & Bear MF (2018). R-Baclofen Reverses Cognitive Deficits and Improves Social Interactions in Two Lines of 16p11.2 Deletion Mice. Neuropsychopharmacology, 43(3), 513–524. 10.1038/npp.2017.236 [DOI] [PMC free article] [PubMed] [Google Scholar]
- Walsh JJ, Christoffel DJ, Heifets BD, Ben-Dor GA, Selimbeyoglu A, Hung LW, … Malenka RC (2018). 5-HT release in nucleus accumbens rescues social deficits in mouse autism model. Nature, 560(7720), 589 10.1038/s41586-018-0416-4 [DOI] [PMC free article] [PubMed] [Google Scholar]
- Won H, Lee H-R, Gee HY, Mah W, Kim J-I, Lee J, … Kim E (2012). Autistic-like social behaviour in Shank2-mutant mice improved by restoring NMDA receptor function. Nature, 486(7402), 261–265. 10.1038/nature11208 [DOI] [PubMed] [Google Scholar]
- Zhou Y, Kaiser T, Monteiro P, Zhang X, Van der Goes MS, Wang D, … Feng G (2016). Mice with Shank3 Mutations Associated with ASD and Schizophrenia Display Both Shared and Distinct Defects. Neuron, 89(1), 147–162. 10.1016/j.neuron.2015.11.023 [DOI] [PMC free article] [PubMed] [Google Scholar]