Abstract
Ultrasound shear wave elastography (SWE) is an imaging modality used for noninvasive, quantitative evaluation of tissue mechanical properties. SWE uses an acoustic radiation force to produce laterally propagating shear waves that can be tracked in spatial and temporal domains in order to obtain the wave velocity. One of the ways to study the viscoelasticity is through examining the shear wave velocity dispersion curves. In this paper, we present an alternative method to two-dimensional Fourier transform (2D-FT). Our unique approach (2P-CWT) considers shear wave propagation measured in two lateral locations only and uses wavelet transformation analysis. We used the complex Morlet wavelet function as the mother wavelet to filter two shear waves at different locations. We examined how the first signal position and the distance between the two locations affect the shear wave velocity dispersion estimation in 2P-CWT. We tested this new method on a digital phantom data created using the local interaction simulation approach (LISA) in viscoelastic media with and without added white Gaussian noise to the wave motion. Moreover, we tested data acquired from custom made tissue mimicking viscoelastic phantom experiments and ex vivo porcine liver mea-surements. We compared results from 2P-CWT with the 2D-FT technique. 2P-CWT provided dispersion curves estimation with lower errors over a wider frequency band in comparison to 2D-FT. Tests conducted showed that the two-point technique gives results with better accuracy in simulation results and can be used to measure phase velocity of viscoelastic materials.
Keywords: Shear wave elastography (SWE), ultrasound, continuous wavelet transform (CWT), velocity dispersion curves, soft tissue, viscosity, viscoelastic
Introduction
Shear wave elastography (SWE) has been used over the last decade to make noninvasive, quantitative measurements of various mechanical properties of soft tissues. SWE uses ultrasound beams, focused in tissue, to generate a propagating shear wave by acoustic radiation force excitation (Sarvazyan et al. (1998, 2011); Ambrozinski et al. (2016a)) or uses external mechanical excitation coupled to the body wall (Huwart et al. (2006); Sandrin et al. (2003)). The propagation of shear waves is monitored in the spatiotemporal domain. Variation of the underlying mechanical properties of the tissue results in change of the shear wave velocity. In most SWE applications, examined tissue is assumed to be elastic, homogeneous, isotropic, linear, and infinite. For this type of medium, time-of-flight methods are normally used to estimate the shear wave velocity (Palmeri et al. (2008)).
In reality, soft tissues exhibit viscoelastic behavior. As a result, wave velocity varies with frequency, a phenomenon called dispersion (Chen et al. (2004)). Many SWE techniques have used this phenomenon by measuring shear wave phase velocity at different frequencies to evaluate the viscoelasticity of tissue (Chen et al. (2004, 2009); Deffieux et al. (2009)). Viscoelasticity is not the only property which can induce wave dispersion. Geometry of a medium can also cause wave velocity changes with frequency. Waves propagating in thin materials can undergo multiple reflections resulting in mode conversion. The interaction of such waves form guided or Lamb waves which are dispersive by nature (Gra (2012); Rose (2014)). In situations where tissues have finite thicknesses and are viscoelastic (arteries, myocardium, bladder wall, and tendons), the dispersion effect is present both from vis-coelasticity and geometry (Nenadic et al. (2011b,a); Urban et al. (2013); Helfenstein-Didier et al. (2016); Ambrozinski et al. (2016b)).
In most current applications, shear wave propagation is measured using the multiple tracking location (MTL) method. SWE methods are where the shear waves are measured at multiple locations simultaneously for one or multiple acquisitions. Various ultrafast imaging techniques exist either using plane wave compounding (Montaldo et al. (2009)) or by using multiple acquisitions with focused beams (Song et al. (2015)). In many cases, the two-dimensional Fourier transform (2D-FT) of the spatiotemporal particle motion v (x, t) is used to create the “k-space” represented by the wavenumber, k, and frequency, f (Alleyne and Cawley (1991)). For an impulsive input similar to the acoustic radiation force used in many SWE applications, the k-space will have a distribution of energy covering a bandwidth that is related to the push beam geometry, push temporal length, and the mechanical properties of the medium (Palmeri et al. (2014)). The peaks of the k-space distribution for an impulsive acoustic radiation force push are related to the phase velocities of different wave propagation modes. These peaks can be found by searching in orthogonal directions either along the f or k directions as described by Bernal et al. (2011). Usually, a threshold is applied to the k-space before the search to avoid spurious peaks (Bernal et al. (2011)).
An alternative approach to measure shear wave propagation is to use the single-track-location (STL) approach proposed by McAleavey et al. (2009). STL employs multiple, laterally offset push beams and a single tracking location, rather than tracking the speed of a single propagating shear wave going through multiple tracking locations. Methods that involve tracking in a single location, as opposed to multiple locations, cancel out speckle-induced phase errors in shear wave velocity estimates, because the same scatterers are being interrogated (Elegbe and McAleavey (2013); Langdon et al. (2015)). While STL is fairly robust for generating shear wave velocity maps, it does take multiple acquisitions and hence considerable time.
A different method used to search the k-space is a Radon sum method (Nightingale et al. (2015)). It uses the k-space and finds the curved trajectory defined by a linear dispersion function that maximizes the summed magnitude. For this method, any dispersion function could be defined, however, the parameters that provide the maximized sum are reported for the characterization of the medium under examination.
Another method used for dispersion curves evaluation is based on the multiple signal classification (MUSIC) technique (Schmidt (1986); Ambrozinski et al. (2015); Kijanka et al. (2018)). The algorithm evaluates wavenumber spectra using an eigenspace analysis method. Similar to 2D-FT, this method allows estimation of dispersion curves using a frequency-wavenumber representation. Kijanka et al. (2018) have shown that the MUSIC method is more resistant to experimental noise unlike the phase gradient and 2D-FT methods which can, at times, be prone to failure in the face of experimental noise.
The aforementioned methods require shear wave responses acquired over multiple laterally-spaced spatial points. This means that the resulting dispersion curves describe averaged material properties over a lateral segment. In practical applications, however, local properties are sought. Therefore, a method permitting measurement of dispersive wave speed from two closely spaced spatial points would be advantageous. Phase velocity of a dispersive medium can be evaluated from the phase of the cross-spectrum of two signals (Bloch and Hales (1968)). However, this method can not be used for multimodal waves and is ineffective in the presence of noise.
In this paper, we describe a method for phase velocity estimation applicable in viscoelastic media. This technique was originally proposed in geophysics for interstation phase velocity measurement (Wu et al. (2009)). The unique approach used in this method considers the shear wave propagation measured only at two lateral locations, separated from each other by distance Δ. To improve robustness of the method, continuous wavelet transform (CWT) is used as a bank of filters to decompose the signals into a set of narrow-band details. In the next, step phase shift between the corresponding details is calculated. The technique uses reduced data (by means of using only two tracking locations) as opposed to a fuller data set (i.e. shear wave propagation is measured at multiple lateral locations) 2D-FT-based methods.
The rest of the paper is organized as follows. First, we present the two point continuous wavelet transform (2P-CWT) method applied for shear wave dispersion curve estimation. The 2P-CWT method is introduced as an alternative to the 2D-FT method to compute the phase velocity curve. This method was tested on data from local interaction simulation approach (LISA) simulations of shear wave propagation. The robustness of the method was tested by adding noise to these data sets. We also examined the method on data from custom made tissue-mimicking (TM) viscoelastic elastography phantoms and ex vivo porcine liver, respectively. Results from these digital and physical phantoms will be presented. It is assumed that the shear waves are observed over one half of the x-axis. The results will be followed with a discussion and conclusions.
Materials and Methods
In this section, the 2P-CWT method is developed for dispersion curves estimation from data produced from digital phantoms based on LISA viscoelastic models and experimentally from viscoelastic TM phantoms and ex vivo porcine liver. The whole procedure is described in the following section. Then, descriptions of the numerical LISA viscoelastic and experimental phantoms are introduced.
The Continuous Wavelet Transform Used for Phase Velocity Evaluation (2P-CWT)
The phase velocity dispersion curves can be evaluated using a methodology which involves waveforms acquired from two measurement points only and adopts the continuous wavelet transform. In summary, the steps of the procedure can be summarized as follows:
Step 1:
Collect two shear wave motion measurements as time-domain data (sw1 (t, x1), sw2 (t, x2)), at spatially distributed locations separated by Δ distance, whare Δ= x2 − x1.
Step 2:
Decompose time-varying signals into their non-stationary spectral components using a wavelet transform. CWT with mother wavelet, , can be expressed as follows:
| (1) |
where τ is the time delay, α is the dilating scale, is the mother wavelet function, and swi (t, xi) is the shear wave motion signal in the time domain at location xi. The * denotes a complex conjugation.
Step 3:
For each scale, α, find corresponding frequency of the wavelet as
| (2) |
where fc is the central frequency of the given wavelet calculated as a maximum of the Fourier transformed mother wavelet. The parameter fs is the sampling frequency.
Step 4:
For each frequency, f, determine phase, φ(f), for resulting cross correlation analysis between signals W1(τ,α) and W2(τ,α) If both wavelet signals are in phase, phase of the cross-correlogram is a minimum.
Step 5:
Calculate phase velocity using the formula (Wu et al. (2009))
| (3) |
where t0 is the first time point and N is an integer.
The above-mentioned procedure has been implemented in MATLAB (Math-works, Natick, MA, USA) to show and evaluate the principle and its basic performance. We used Eq. 1 to do wavelet transformation using the complex Morlet wavelet transform defined as
| (4) |
where, σ2 = 3 and fc = 1. The transform was calculated for set of scale parameters α = 0.1, …, 400 with a step size equal to 1.
Figure 1a shows two shear wave motion measurements for a TM viscoelastic phantom, for lateral locations chosen to be 5.2 mm for the sw1 and 8.2 mm for the sw2 from the push beam location, respectively. The resulting cross-correlogram for the 2P-CWT technique in presented in Fig. 1b with superimposed estimated phase velocity. The phase velocity computed using 2P-CWT is compared with the results obtained using the 2D-FT method in Fig. 1c.
Figure 1:
Example of reconstruction phase velocity based on the 2P-CWT approach for shear wave motion measurements. (a)temporal shear wave propagation using the particle velocity signals for selected lateral positions of 5.2 (sw1) and 8.2 (sw2) mm from the push beam location, respectively. (b) a cross-correlogram with its minimum representing the phase velocity of the shear wave. (c) extracted the phase velocity from the cross-correlogram (b) compared with the phase velocity com-puted using the 2D-FT approach.
In order to show the effectiveness of this new method, we conducted tests with LISA numerical and TM experimental data as well as ex vivo porcine liver data and compared results with 2D-FT results. The results of these tests have demonstrated the potential of this approach for handling dispersion curves of shear waves (1–10 m/s) in medical applications.
In this paper, we use two different methods to calculate phase velocity curves. Phase velocities estimated based on the 2P-CWT and 2D-FT methods are computed from the maximum peaks (Kijanka et al. (2018)). Dispersion curves results were compared by calculating the root-mean-square error (RMSE) of the measured curves and the true curves for the LISA results with the true curves calculated with values presented in Table 1. The RMSE can be calculated as follows:
| (5) |
where,Ãi is a phase velocity vector of reference values made up of N scalar observations and Ai is the vector of observed values. The reference shear wave phase velocity curves were calculated for the Kelvin-Voigt model as (Chen et al. (2004))
| (6) |
where ρ is the density of the medium, ω is the angular frequency, and μ1 and μ2 are the shear elasticity and shear viscosity, respectively.
Table 1:
Material properties adopted for a Kelvin-Voigt LISA numerical models.
| Phantom 1 | Phantom 2 | Phantom 3 | |
|---|---|---|---|
| μ1 [kPa] | 4.99 | 3.34 | 1.48 |
| μ2 [Pa·s] | 1.00 | 1.25 | 0.75 |
Numerical LISA Viscoelastic Phantoms Description
Digital phantoms of viscoelastic materials with known mechanical properties were produced using a 2D LISA method (Delsanto et al. (1994); Lee and Staszewski (2003); Kijanka et al. (2012, 2013)). We used LISA for SWE applications in our previous studies (Kijanka and Urban (2018)). The LISA model for an elastic, isotropic, homogeneous, and nearly incompressible model for soft tissue is described by Navier’s equation
| (7) |
where, λ1 and μ1 are the bulk and shear modulus, respectively. The parameter ρ is the density, u is the local particle displacement, F is the induced body force, and t is the time. When the Kelvin Voigt (KV) model for viscous loss is incorporated, Navier’s equation becomes (Bercoff et al. (2004))
| (8) |
where, λ2 and μ2 indicate the bulk viscosity and shear viscosity, respectively.
In the LISA implementation, similar to the standard finite difference (FD) scheme, the future time step is calculated as a combination of the same quantities taken in the already computed time steps. Consequently, the algorithm can be parallelized very efficiently. Therefore, we utilized parallel computation technology offered by graphics processing units and compute unified device architecture (CUDA) used in low-cost graphics cards for computation of the LISA equations. The entire process was implemented in MATLAB software.
The domains were uniformly spatially sampled at Δx = Δz = 0.1 mm. The dimensions of the simulated domain are x = ±45 mm in the lateral direction and z = 60 mm in the axial dimension. We adopted a KV material model with three different material properties scenarios presented in Table 1. They are denoted phantoms 1, 2, and 3 for this study.
The acoustic radiation force push beam, for the numerical models, was simulated using Field II (Jensen and Svendsen (1992); Jensen (1996)). A linear array with element width of 0.283 mm, element height of 7 mm, element pitch of 0.308 mm, elevation focus of 25 mm was simulated with a center frequency of 5.0 MHz, and using medium attenuation, α, of 0.5 dB/cm/MHz and sound velocity, c, of 1540 m/s. The intensity, I, was calculated by squaring the pressure to be used in the body force defined by F = 2αI/c (Doherty et al. (2013)). A focal depth of 21.6 mm was used for the push beams with a fixed f-number (F/N) of 2. Resulting shear wave responses were interpolated with a temporal sampling frequency of 4.1667 kHz and then used for further data processing.
Numerical LISA shear wave responses for digital phantoms of viscoelastic materials are studied twofold. Examples of a “clean” (without any additional noise) as well as in the presence of noise, as added white Gaussian noise, wave motions are studied. The white Gaussian noise was generated in MATLAB software using the awgn function and then added to the shear wave time-domain particle velocity signals. The power of the wave motion was measured. Subsequently, white Gaussian noise was added to the time-domain vector signals. A signal-to-noise ratio (SNR) for the noise-added models was set to 15 dB.
Tissue Mimicking Phantoms Description
Custom tissue-mimicking viscoelastic phantoms (CIRS Inc., Norfolk, VA, USA) were used in this work to test robustness of the 2P-CWT approach for shear wave phase velocity calculation. These phantoms were designed such that each one represented a different stage of liver fibrosis. They are denoted phantoms A, B, and C for this study. Shear wave acquisitions were performed with a Verasonics system (V1, Verasonics, Inc., Kirkland, WA, USA) and a linear L7–4 array transducer (Philips Healthcare, Andover, MA). The acoustic radiation force push beam was focused at 21.6 mm. The push duration was 400 μs and the push frequency was 4.09 MHz. A fixed F-number (F/N) of 2 was used. The push beam was generated by 32 active elements. Push beam was placed on one side of the L7–4 probe. A plane wave acquisition was used using three angularly directed plane waves (−4°, 0°, +4°) that were coherently compounded (Montaldo et al. (2009)). The effective frame rate after compounding was 4.1667 kHz. The motion (shear wave particle velocity) was computed from the in-phase/quadrature data using an autocorrelation algorithm (Kasai et al. (1985)).
Ex vivo Liver Data Description
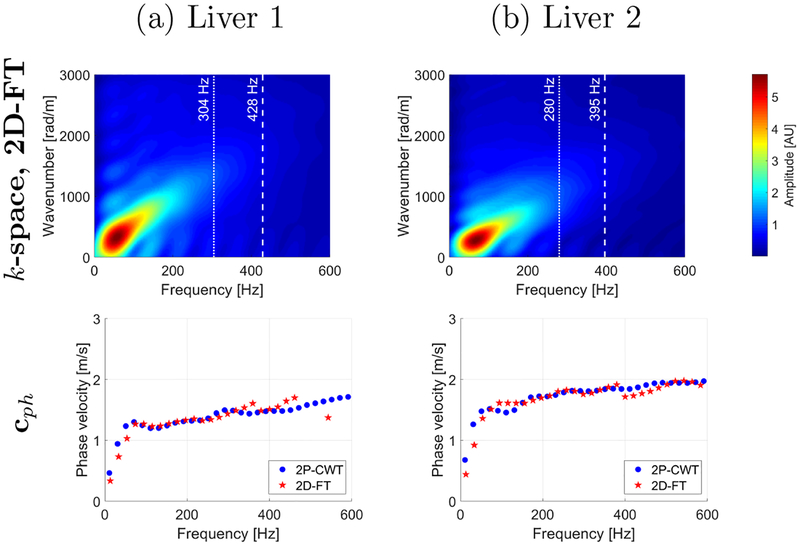
In our experiments, two ex vivo porcine livers were also used to test the efficacy of the 2P-CWT approach in soft tissues. The livers were obtained from pigs after euthanasia where the pigs were used for studies dedicated to medical education or cardiovascular research on protocols approved by the Mayo Clinic Institutional Animal Care and Use Committee. The same acquisition parameters and data processing as for the TM phantom experiments were used, with the di erence that three frames at −3°, 0° and +3° steering angles were used for the angular compounding. The acoustic radiation force push beam was focused at 25 mm. The particle velocity waveforms were averaged from 2 mm in axial direction at focal depth. Then, the DC component was removed from the waveforms. For the data presented in Fig. 12, a lateral segment of the data was limited to 20 mm.
Figure 12:
Top row presents magnitude of the k-space spectra calculated using the 2D-FT method. Bottom row presents phase velocity curves computed for the 2D-FT and 2P-CWT methods. Results were calculated for ex vivo liver data.
Results
Numerical LISA Viscoelastic Phantoms Results
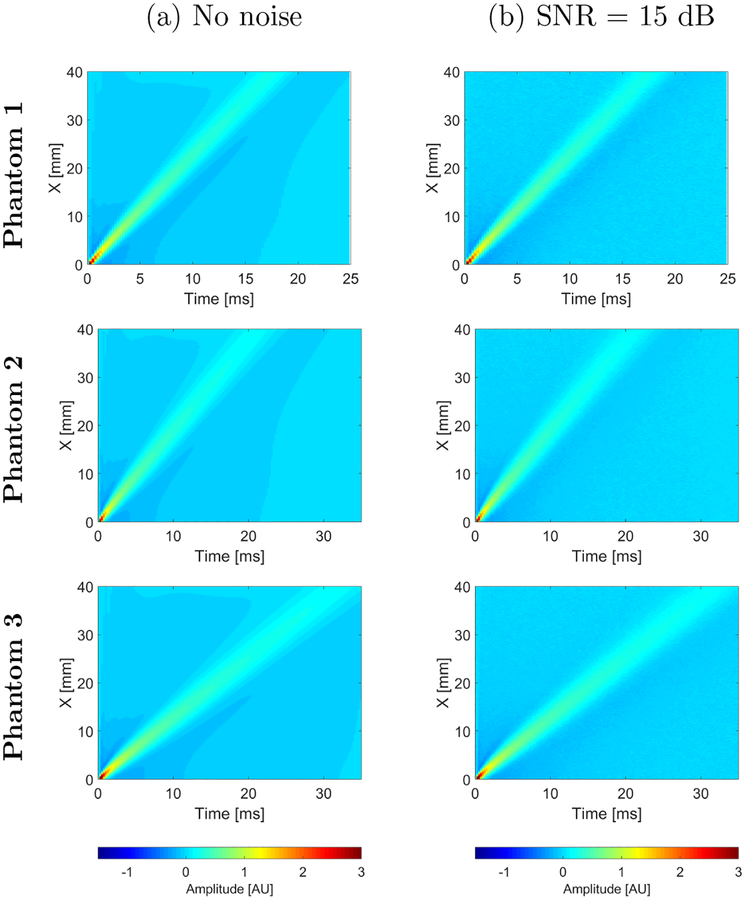
Numerical LISA viscoelastic phantom results were investigated for clean data (without added noise) and with added white Gaussian noise. Shear wave spatiotemporal data are presented in Fig. 2. Wave motion for clean data and with added Gaussian noise are presented, respectively. The results are shown for three different viscoelastic media tabulated in Table 1.
Figure 2:
Spatiotemporal shear wave propagation using the particle sig-nal velocity (a) without added noise and (b) with an SNR = 15 dB. Results were calculated for the numerical LISA viscoelastic phantoms, with assumed material properties. (top row) μ1 = 4.99 kPa and μ2 = 1 Pa·s (Phantom 1). (middle row) μ1 = 3.34 kPa and μ2 = 1.25 Pa·s (Phantom 2). (bottom row) μ1 = 1.48 kPa and μ2 = 0.75 Pa·s (Phantom 3). (bottom row) μ1 = 1.48 kPa and μ2 = 0.75 Pa s (Phantom 3).
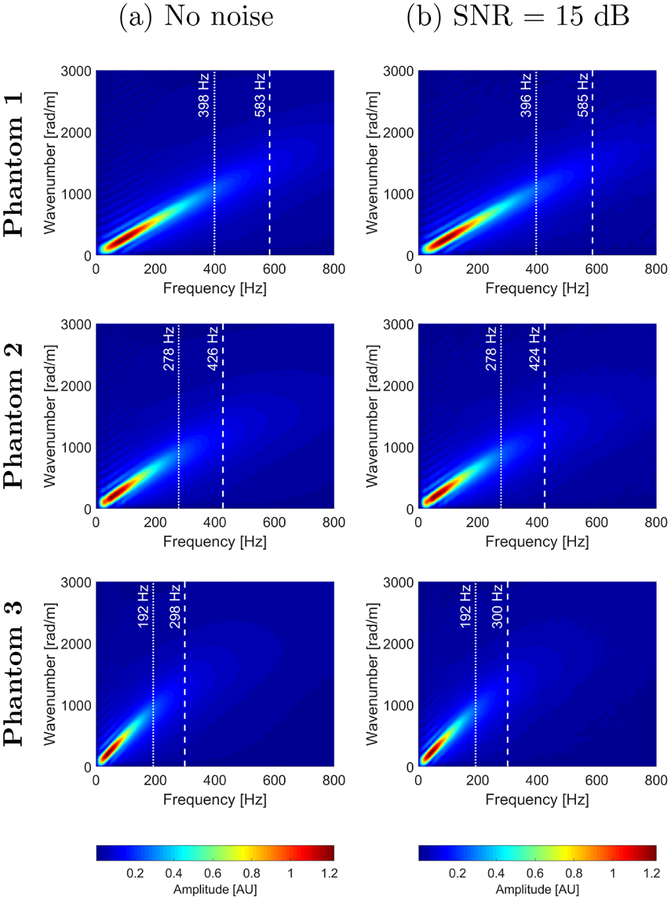
Figure 3 presents the k-space spectra computed using the 2D-FT method for all three numerical phantoms. The results were calculated at a focal depth of 21.6 mm. The clean data (Fig. 3a) and data with added white Gaussian noise (Fig. 3b) are presented, respectively. We normalized the spectra and found the maximum frequencies that corresponded to the cases when the magnitude of the data represented the top 80 and 90%. Appropriate frequencies are marked in the k-space images by dotted (80%) and dashed (90%) lines, respectively. Comparing these values for Phantoms 1, 2 and 3, it can be seen that characteristic frequencies decrease with softer (or more viscous) tissue mimicking phantoms. For 80% of maximum power spectra magnitude, characteristic frequencies are 398, 278, and 192 Hz for Phantoms 1, 2 and 3, respectively (Fig. 3a). 90% of maximum power spectra amplitude instead, corresponds to 583, 426, and 298 Hz for all numerical tissue mimicking viscoelastic phantoms investigated, i.e., Phantoms 1, 2 and 3, respectively. Similar values can be retrieved for the data with added white Gaussian noise shown in Fig. 3b. One can notice that characteristic frequencies are slightly shifted in comparison to the clean data presented in Fig. 3a.
Figure 3:
Magnitude of the k-space spectra calculated using the 2D-FT method. The k-space spectra have superimposed vertical lines corresponding to 80 % (dotted line) and 90 % (dashed line) of power spectra amplitude, respectively. Results were calculated for the numerical LISA viscoelastic phantoms without added noise and with a SNR = 15 dB, with assumed material properties. (top row) μ1 = 4.99 kPa and μ2 = 1 Pa·s (Phantom 1). (middle row) μ1 = 3.34 kPa and μ2 = 1.25 Pa·s (Phantom 2). (bottom row) μ1 = 1.48 kPa and μ2 = 0.75 Pa·s (Phantom 3).
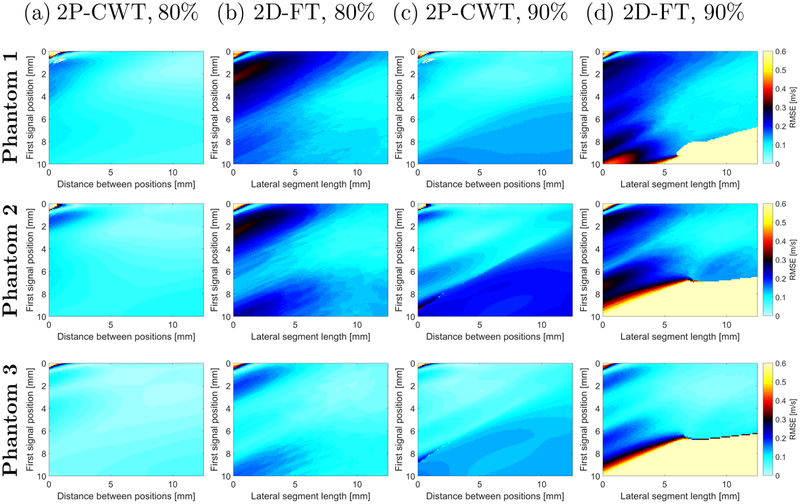
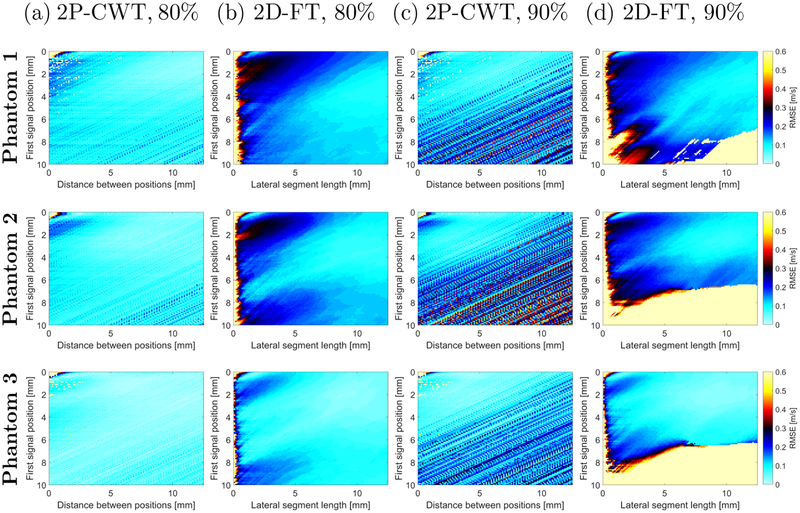
The RMSE for the numerical LISA data for the 2P-CWT and 2D-FT methods is presented graphically in Fig. 4 for the clean data. First signal position versus the distance between two measurement signals is investigated for the 2P-CWT technique in Figs. 4a and 4c for the clean data. At the same time, the RMSE for the first signal position versus distance to the last signal position (with multiple acquisition points in between) for 2D-FT is examined in Figs. 4b and 4d. The RMSE was calculated in a frequency range from 100 Hz to the characteristic frequencies corresponding to 80% (Figs. 4a and 4b) and 90% (Figs. 4c and 4d) of the maximum power spectra magnitude. Results for Phantom 1, Phantom 2, and Phantom 3 are introduced in the top, middle, and bottom rows, respectively.
Figure 4:
The RMSE calculated in a frequency range from 100 Hz to the frequency corresponding to (a), (b) 80 % and (c), (d) 90 % of the maximum power spectra amplitude presented in Fig. 3a. The RMSE was computed for (a), (c) 2P-CWT and (b), (d) 2D-FT techniques. Results were calculated for the numerical LISA viscoelastic phantoms without added noise with assumed material properties (top row) μ1 = 4.99 kPa and μ2 = 1 Pa·s (Phantom 1). (middle row) μ1 = 3.34 kPa and μ2 = 1.25 Pa·s (Phantom 2). (bottom row) μ1 = 1.48 kPa and μ2 = 0.75 Pa·s (Phantom 3).
The RMSE for the 2P-CWT method for Phantom 1 and the frequency corresponding to 80% of the maximum power spectra amplitude (Fig. 4a, top row) oscillates within limits of 0.1 to 0.2 m/s for the first signal position selected between 1 to 5 mm and the distance between the two signals positions varying from 2 to 4 mm. If the distance between two positions was selected to be approximately 5 mm or above (for the first signal position selected near the focused push beam), the RMSE decreased below 0.1 m/s. For a comparison, the 2D-FT method required shear waveforms measured along a distance of at least 8 mm in order to reduce the RMSE below 0.1 m/s (Fig. 4b, top row). When a shorter segment of shear wave data was taken into account, the RMSE increased up to 0.3 m/s. Similar behavior can be observed for other two, softer numerical phantoms presented in the middle and bottom rows of Figs. 4a and 4b. The 2P-CWT method for Phantom 3 gives RMSE below 0.1 m/s for almost any selected first signal position and the distance between two measurement points (Fig. 4a, bottom row).
The 2P-CWT and 2D-FT methods have higher RMSE when higher frequencies corresponding to 90% of the maximum power spectra amplitude are investigated. Results are shown in Figs. 4c and 4d for the 2P-CWT and 2D-FT methods, respectively. The 2P-CWT method exhibits increased RMSE (up to 0.25 m/s) when the shear waveforms are selected for a position of 6 mm and above from the focused push beam. Below this range, a RMSE lower than 0.1 m/s can be observed. 2D-FT also presents increased RMSE (above 10 m/s) when the shear wave data are measured starting from the distance of 6 mm and above. In order to reconstruct the shear wave phase velocity with the RMSE below 0.1 m/s, measurement points within at least 8 mm were necessary for Phantoms 1 and 2. Phantom 3 required measurements within approximately 6 mm of lateral directions.
Similar results to Fig. 4 for the same numerical LISA data (however with a SNR = 15 dB) are shown in Fig. 5. A comparison between the 2P-CWT and 2D-FT methods is made. It can be seen that added white Gaussian noise to the shear wave signal resulted in higher calculated RMSE for both techniques. The RMSE increased for the 2P-CWT method in comparison to 2D-FT when longer distance between two measurement points were taken into account.
Figure 5:
The RMSE calculated in a frequency range from 100 Hz to the frequency corresponding to (a), (b) 80 % and (c), (d) 90 % of the maximum power spectra amplitude presented in Fig. 3b. The RMSE was computed for (a), (c) 2P-CWT and (b), (d) 2D-FT techniques. Results were calculated for the numerical LISA viscoelastic phantoms with a SNR = 15 dB with assumed material properties (top row) μ1 = 4.99 kPa and μ2 = 1 Pa·s (Phantom 1). (middle row) μ1 = 3.34 kPa and μ2 = 1.25 Pa·s (Phantom 2). (bottom row) μ1 = 1.48 kPa and μ2 = 0.75 Pa·s (Phantom 3).
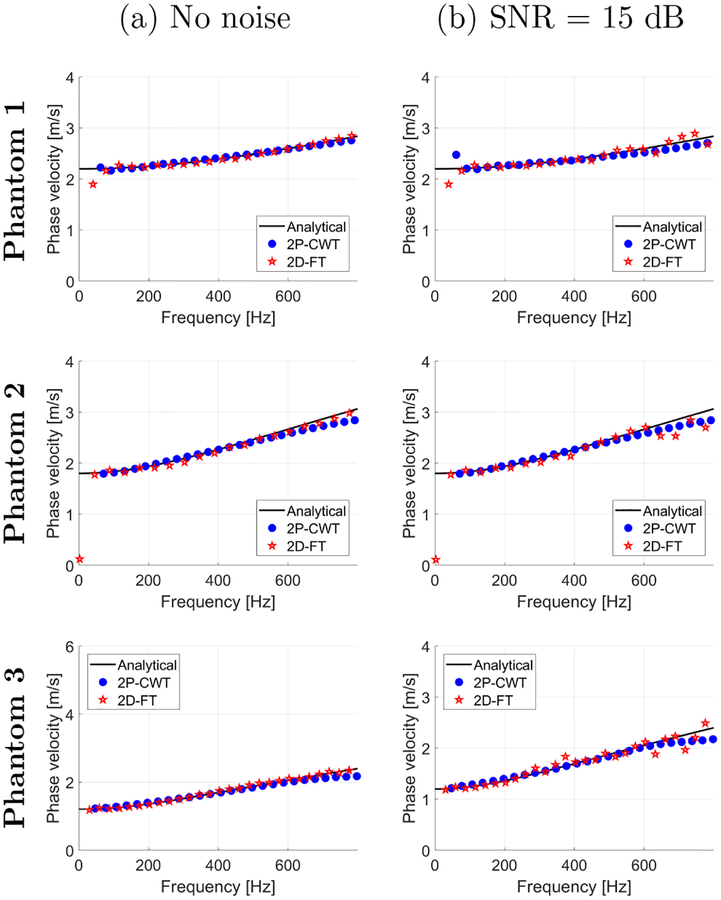
Figure 6 shows the comparison of phase velocity dispersion curves for numerical LISA tissue mimicking phantoms for the clean (without added noise) and noisy (SNR = 15 dB) data. Results were calculated using two different approaches. Results for the 2P-CWT method are presented along with the 2D-FT method. The first signal position in the lateral direction was chosen to be 3 mm and distance between two measurement points was 6 mm. All these results are compared with the true, analytical values. Results presented in Fig. 6 are to show differences pictorially and appreciate the deviation from the reference values. Data for the 2D-FT method are more affected by the noise. The 2P-CWT method estimated the phase velocity within the investigated frequency range and for chosen signals positions with lower RMSE for all three numerical phantoms examined in this study.
Figure 6:
Phase velocity curves computed for the 2D-FT (red stars) and 2P-CWT (blue dots) methods. Results were calculated for the numerical LISA viscoelastic phantoms without added noise and with a SNR = 15 dB, with assumed material properties. (top row) μ1 = 4.99 kPa and μ2 = 1 Pa·s (Phantom 1). (middle row) μ1 = 3.34 kPa and μ2 = 1.25 Pa·s (Phantom 2).(bottom row) μ1 = 1.48 kPa and μ2 = 0.75 P·s (Phantom 3). A comparison to the true (black, continues curves) values is made.
Experimental TM Phantom Results
In this section, the 2P-CWT-based method used for phase velocity estimation of shear waves was used for the experimental TM phantom data. As in the previous section, results for the 2P-CWT method are compared with those from the 2D-FT method. In this section, three different custom made TM phantoms were investigated, and the results are shown in Figs. 7–9.
Figure 7:
Spatiotemporal shear wave propagation using the particle ve-locity signal. Results are presented for the experimental, cus-tom made TM viscoelastic phantoms (a) Phantom A, (b) Phan-tom B and (c) Phantom C.
Figure 9:
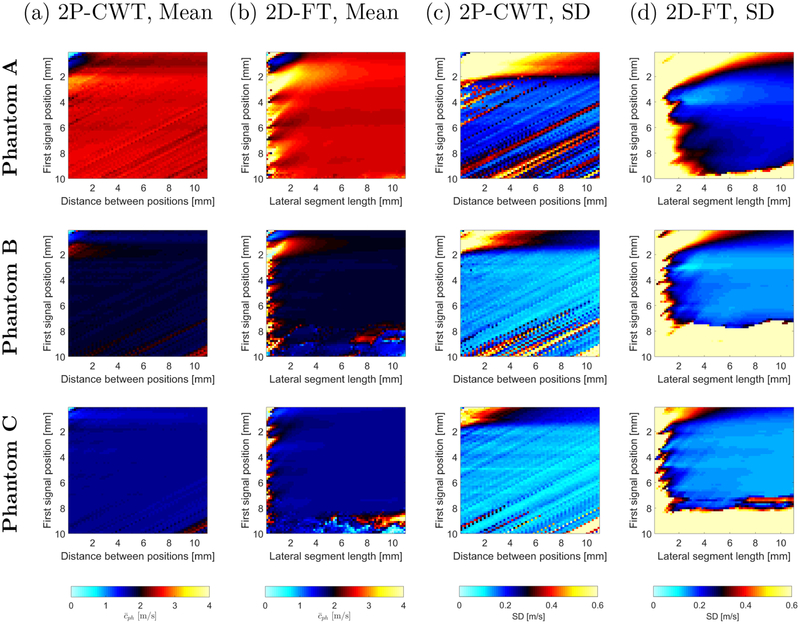
Mean of the phase velocity curves for the (a) 2P-CWT and (b) 2D-FT methods. Standard deviation of the phase velocity for the (c) 2P-CWT and (d) 2D-FT methods. All results were computed in a frequency range from 100 to 700 Hz. Results were calculated for the experimental TM viscoelastic phan-toms (top row) Phantom A, (middle row) Phantom B and (bottom row) Phantom C.
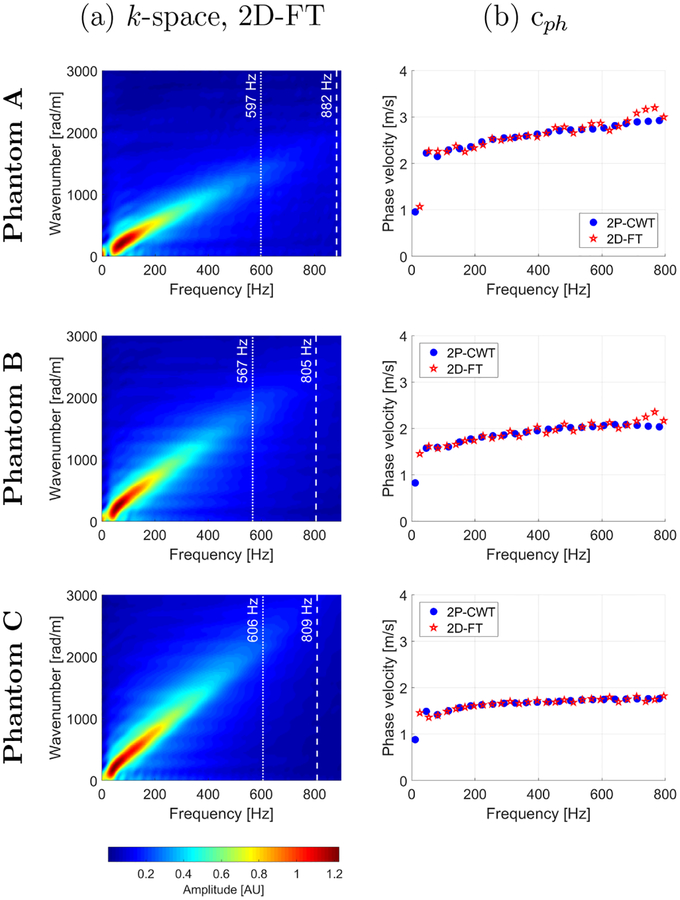
Figure 7 presents the spatiotemporal particle velocity for all three phantoms on a linear scale. Figure 8a presents magnitude of the k-space spectra calculated using the 2D-FT method for all three TM phantoms. Similar as in previous section, vertical lines representing characteristic frequencies for 80% (dotted lines) and 90% (dashed lines) of maximum power spectra magnitude are superimposed on the k-space images. The characteristic frequencies for 80% of maximum power spectrum amplitude are 597, 567, and 606 Hz for Phantoms A, B, and C, respectively. For 90%, 882, 805, and 809 Hz characteristic frequencies were recorded for phantoms A, B, and C, respectively. Fig. 8b presents a comparison of dispersion phase velocity curves for a single acquisition calculated using the 2D-FT and newly proposed 2P-CWT techniques. Very good agreement can be observed between the methods investigated in this study.
Figure 8:
Magnitude of the k-space spectra calculated using the 2D-FT method (a) and phase velocity curves computed for the 2D-FT and 2P-CWT methods (b). Results were calculated for the experimental TM viscoelastic phantoms (top row) Phantom A, (middle row) Phantom B and (bottom row) Phantom C.
The mean and standard deviation (SD) of the phase velocity for the custom made TM phantoms are presented graphically in Fig. 9. The values were calculated for 12 acquisitions acquired at different locations for each phantom. A frequency range used for the computations was from 100 to 700 Hz. The mean and SD results for 2P-CWT are compared against the 2D-FT technique. First signal position and distance between two measurement points were studied for the 2P-CWT method (Figs. 9a and 9c). Likewise, first signal position versus distance to the last measurement point (with multiple measurements locations in order to project the same lateral distance as in 2P-CWT) was examined for the 2D-FT method. Results are presented in Figs. 9b and 9d. Nominal mean phase velocities, calculated using the 2D-FT for the lateral segment of 20 mm, for Phantoms A, B, and C are 2.52, 1.89, and 1.66 m/s, respectively. Nominal SDs for the same data are 0.19, 0.14, and 0.13 m/s for phantoms A, B, and C, respectively.
Comparing the mean and SD of phase velocity results for both methods, differences can be distinguished. The 2P-CWT method gives good estimation of the mean values for almost any selected measurement points (approximately 2.51 m/s for Phantom A, 1.88 m/s for Phantom B, and 1.66 m/s for Phantom C).
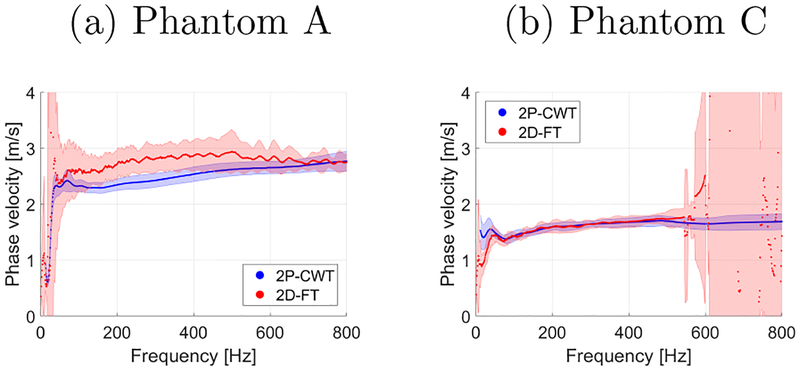
Figure 10 presents dispersion phase velocity curves calculated for an exemplary set of positions. The mean and SD from 12 separate acquisitions are presented. Phase velocity curves for Phantom A (Fig. 10a) were computed for the first signal position of 4 mm and the distance between positions for 2P-CWT (lateral segment length for 2D-FT) of 2 mm. Phantom C (Fig. 10b) instead, shows estimated phase velocity curves for the first signal position of 9 mm and the distance between positions for 2P-CWT (lateral segment length for 2D-FT) of 5 mm. Clear differences between the 2P-CWT and 2D-FT methods can be observed. The phase velocity curve for Phantom A and the 2P-CWT method is very similar to the one presented in Fig. 8b. At the same time, the estimated phase velocity for 2D-FT exhibits a dissimilar trend with higher SD. Results for Phantom C are close to 500 Hz for both approaches. Above that, the SD for 2D-FT drastically increases, whereas, 2P-CWT presents constant SD.
Figure 10:
Mean phase velocity dispersion curves from 12 acquisitions calculated for (a) Phantom A and (b) Phantom C, respectively. Results for Phantom A were calculated for first signal position of 4 mm and distance between positions (lateral segment length) of 2 mm. Results for Phantom C were computed for first signal position of 9 mm and distance between positions (lateral segment length) of 5 mm.
Experimental Ex vivo Liver Results
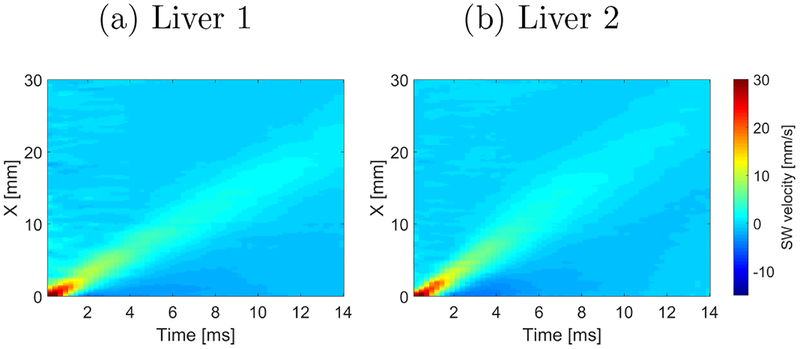
In this section, the 2P-CWT method used for phase velocity estimation of shear waves was used for the experimental ex vivo liver data. As in previous sections, results for the 2P-CWT method are compared with those from the 2D-FT technique. In this section, two different porcine livers were investigated, and the results are shown in Figs. 11–12. Figure 11 shows the spatiotemporal shear wave propagation using the particle velocity signal for the acoustic radiation force push beam focused at 25 mm.
Figure 11:
Spatiotemporal shear wave propagation using the particle velocity signal. Results were calculated for the experimental, ex vivo liver data.
The top row of Fig. 12 presents the k-space spectra for livers 1 and 2, respectively. The phase velocity results are also presented in the bottom row of Fig. 12. As for the numerical LISA viscoelastic phantoms and the custom made TM phantoms, in this case, the phase velocity dispersion results were calculated using the 2P-CWT method for two selected measurement points. The first signal position and distance between signals were chosen as follow: 3.9 mm and 2.5 mm for liver 1 and 4.2 mm and 0.616 mm for liver 2, respectively. Very similar results are observed for the two methods in a frequency range from 75 to 250 Hz for Liver 1 (Fig. 12a, bottom row). Above this frequency, results for 2D-FT diverges probably due to the poorer SNR for the shear waves measured in this liver. The 2P-CWT method presents stable phase velocity results up to 600 Hz. More stable results can be observed for Liver 2 (Fig. 12b). The two methods exhibit similar results with the caveat that the results for 2D-FT exhibit some oscillations. At the same time, the 2P-CWT method exhibits a smooth trend as shown in the bottom row in Fig. 12b.
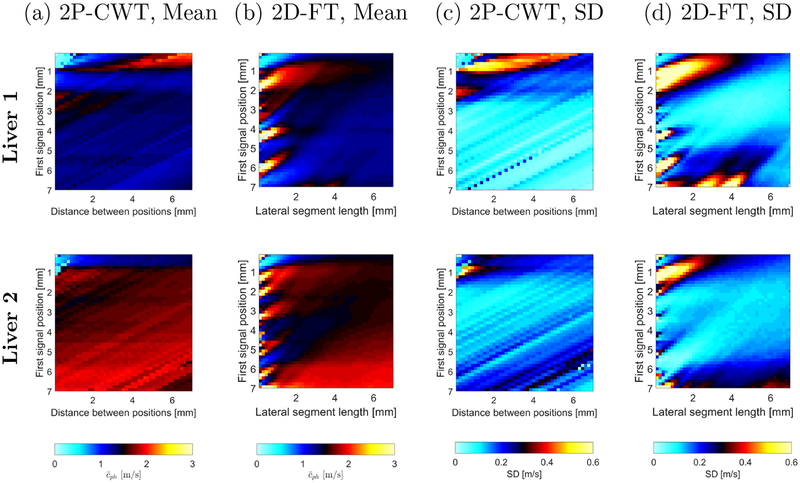
The mean and SD of the phase velocity for ex vivo livers are presented graphically in Fig. 13. The values were calculated in a frequency range starting from 100 Hz to the frequency corresponding to 80% of the maximum power spectra, i.e. 188 Hz for liver 1 and 182 Hz for liver 2, respectively. Results for different first signal positions and distance between signals for 2P-CWT (lateral segment length for the 2D-FT) are shown. Similar as for the custom made TM phantoms (Fig. 9), differences between, two methods can be distinguished. Overall, the 2D-FT approach needs shear waves propagating over longer lateral distance than the 2P-CWT method to produce stable and accurate phase velocity results. At least multiple data measurements within 2.5 mm were necessary in order to meet the RMSE of 0.1 m/s or below for the frequency range investigated. At the same time, 2P-CWT required a minimum measured distance equal to 0.154 mm (corresponding to a lateral spatial resolution). This can be seen for example for first signal position equal to 3 mm for liver 1 (Figs. 13c and 13d). Similar observations can be made for the mean values depicted in Figs. 13a and 13b. The 2D-FT approach requires more acquisition data than the 2P-CWT method in order to stabilize the mean phase velocity.
Figure 13:
Mean of the phase velocity curves for the (a) 2P-CWT and (b) 2D-FT methods. Standard deviation of the phase velocity for the (c) 2P-CWT and (d) 2D-FT methods. All results were computed in a frequency range from 100 to 80% of maximum power spectra. Results were calculated for ex vivo liver data.
Discussion
A new method, called 2P-CWT, for the estimation of phase velocities for shear waves in soft media and tissue has been investigated. The approach utilizes the continuous wavelet transform adopted to two measurement points only to find the phase velocity curves of the shear wave signal.
This method was tested on simulated data from LISA models of shear wave propagation induced by acoustic radiation force in viscoelastic media. LISA models do not take into account displacement underestimation bias which occur during ultrasound motion detection, which is a limitation here. As a result, only adding Gaussian noise to the resulting particle velocity from the LISA models may not completely capture the noise model experienced in practice. We compared the performance of our method against 2D-FT using clean data and with added white Gaussian noise as shown in examples in Figs. 3, 4, 5, and Table 1. The results showed that the 2P-CWT method had comparable (Phantom 1) or lower (Phantoms 2 and 3) values of RMSE than their counterparts based on the 2D-FT method. We can observe the qualitative similarities between the simulation and experimental data. More-over, in this study, we have experimental data in viscoelastic phantoms and ex vivo tissue to supplement the simulation data.
The method was also tested with experimental data in custom made TM viscoelastic phantoms. The results were generally similar between the 2D-FT and 2P-CWT methods. We also examined the influence of the first signal position from the focused push beam and distance between two measurement points for the 2P-CWT method and corresponding to that a lateral segment of data for the 2D-FT method. Using the 2P-CWT method data acquired with a very short distance (1–2 mm) were sufficient in order to provide robust estimates of the mean phase velocity (Fig. 9). For the same lateral segment of data with multiple acquisitions for 2D-FT, the mean phase velocity experienced high standard deviation (>1 m/s).
This confirms that shear waveforms measured along a very short lateral distance (e.g. 1–2 mm) at only two points are sufficient in order to properly reconstruct the shear wave phase velocity. This is also confirmed with SD results presented in Fig. 9c. One exception can be observed, i.e., when data within a short distance (less than 2 mm) from the focused push beam are considered, higher SD is observed. This is induced by a near field effect which has greater impact on the 2D-FT method. In order to properly estimate the mean phase velocity using the 2D-FT method, shear wave signals acquired along longer lateral distance (5 mm and above) are necessary. When shorter segment lengths in the lateral direction are taken into account, higher SD is present for all TM phantoms and the frequency range investigated, as can be observed in Fig. 9d.
In our study, we defined the usable bandwidth as a frequency corresponding to 80% or 90% of the maximum power spectra amplitude calculated using the 2D-FT method. The bandwidth depends on the mechanical properties (shear modulus and viscosity) of tissue and the geometry and temporal length of the acoustic radiation force push beam (Palmeri et al. (2014)). We have found in our study that the reconstructed shear wave phase velocity in the bandwidth from 100 Hz to characteristic frequency corresponding to 80% of the spectra magnitude produced lower RMSE (<0.1 m/s) for more combinations of the first signal position and the distance between two measurement points (Figs. 4a and 5a). For 90% of the bandwidth instead, the RMSE is still below 0.1 m/s when the first signal position is chosen between 2–4 mm from the focused push beam (Figs. 4c and 5c). Choosing the first signal position further than 5 mm from the push beam resulted in increased RMSE up to 0.2–0.3 m/s.
The shear wave motion data measured at farther lateral locations have lower SNR. The 2P-CWT method takes into account information from only two measurement points, whereas, 2D-FT uses information from multiple points along the lateral segment using shear wave motions with higher amplitudes, i.e., higher SNR. Results for higher frequencies corresponding to 90% of the maximum power spectra amplitude are more susceptible to the noise than 80%.
2P-CWT was also tested using two ex vivo porcine livers data in Fig. 12. The 2P-CWT method provides fewer oscillations than the 2D-FT approach. Moreover, extended usable bandwidth (up to 600 Hz) was observed for liver 1 in bottom row of Fig. 12a.
It should be mentioned that the wave velocity dispersion results from the 2P-CWT method and the 2D-FT approach are dependent on the data input to the algorithm. We have also observed that adjusting the distance range of the data, i.e., the distance from the source (below approximately 2 mm) can cause changes to the dispersion (Fig. 9c). Shear wave interference leads to fluctuations in shear wave intensity near the focused push beam and is known as the near field. Because of the shear wave variations within the near field, it can be difficult to accurately evaluate dispersion curves in materials within this area. Hence, the area beyond the near field where the shear wave is more uniform is more typically used. This behavior, has been also observed in 2D-FT based methods for phase velocity dispersion curves computation (Rouze et al. (2017); Kijanka et al. (2018)).
Shear wave velocity estimation can be affected by jitter (Walker and Trahey (1995)), shearing (McAleavey et al. (2003); Deffieux et al. (2012)), out-of-plane propagations (Zhao et al. (2011)), motion artifacts, and dispersion. For multiple track location methods, speckle noise is also a source of error. This type of source is due to the fact that stronger speckle are tracked preferentially, and they may be located off the axis of the tracking beam in favor of weaker on-axis speckle. In order to overcome this problem, tracking at a single location can be used which subtracts out this speckle noise in shear wave velocity estimates (Elegbe and McAleavey (2013)). An STL approach could be applied for 2P-CWT in order to eliminate this type of error, but this was not explored in this work.
There are several main advantages of the proposed 2P-CWT method over traditional Fourier-based analyses. Firstly, 2P-CWT uses a reduced number of data points. Shear wave velocity waveforms are analyzed from two spatially distributed points only. This has a strong potential in scenarios where shear waves decay very fast and do not propagate over a long distance, e.g., below 5 mm. In some cases, it may be useful to have these locations closely spaced due to high attenuation in viscoelastic media. However, in other cases, it may be necessary to have some minimum spacing if the material has higher shear wave velocities. At the same time, Fourier-based methods are considered as more laterally global methods that require many data points for robust results. The resulting information is averaged from many acquisition points taken in the lateral direction.
Secondly, the 2P-CWT method uses wavelet analysis as a bank of filters to decompose the signals into a set of narrow-band details. CWT retains information on how the spectral content varies with time delay. The accuracy of the time and frequency remain constant over the entire time-frequency domain.
Another advantage is that the 2P-CWT method requires shear wave velocity waveforms measured at two locations. Hence, the temporal resolution of acquisitions can be increased by activating only a few array transducers. This in turn, may increase the signal-to-noise ratio of shear wave tracking (Song et al. (2015)). Additionally, instead of using plane waves, focused transmit beams could also increase SNR at the two locations of interest (Palmeri et al. (2014)).
We can conclude from our study that an optimal combination of measurement points for the 2P-CWT method, in order to properly reconstruct the phase velocity with low SD and RMSE, is approximately 4–8 mm for the first signal position (in order to avoid the near field effect) and the distance between two locations ranging from 0.154 mm (corresponding to the lateral spatial resolution) to approximately 6 mm. These combinations gave the SD ≤ 0.1 m/s for the numerical data, custom made TM phantoms, and liver data in the frequency range from 100 Hz to the 80% characteristic frequency. For a higher frequency range (up to 90% or more), the optimal combination of these points is still under consideration and needs further investigation.
In future work, we will use this method on data from in vivo tissue measurements to determine the robustness of the 2P-CWT method.
Conclusions
A method for the estimation of shear wave phase velocity dispersion curves based on the continuous wavelet transform was presented. The newly developed method was tested on simulated and experimental phantom data. In comparison with the 2D-FT method, the 2P-CWT method achieved better performance with SNR in the simulation data for selected bandwidth. Future work will be devoted to use this method in the viscoelastic characterization of soft tissues.
Acknowledgements
We are grateful to Jennifer L. Poston for administrative support. This work was supported by grant R01DK092255 from the National Institutes of Health. The second author would like to acknowledge the Foundation for Polish Science for a project carried out within Homing program co-financed by the European Union under the European Regional Development Fund, agreement no. Homing/2017–3/19. The content is solely the responsibility of authors and does not necessarily represent the official views of the National Institute of Diabetes and Digestive and Kidney Diseases or the National Institutes of Health.
Footnotes
Publisher's Disclaimer: This is a PDF file of an unedited manuscript that has been accepted for publication. As a service to our customers we are providing this early version of the manuscript. The manuscript will undergo copyediting, typesetting, and review of the resulting proof before it is published in its final citable form. Please note that during the production process errors may be discovered which could affect the content, and all legal disclaimers that apply to the journal pertain.
References
- Alleyne D, Cawley P. A two-dimensional fourier transform method for the measurement of propagating multimode signals. The Journal of the Acoustical Society of America, 1991;89:1159–1168. [Google Scholar]
- Ambrozinski L, Packo P, Pieczonka L, Stepinski T, Uhl T, Staszewski WJ. Identification of material properties e cient modelling approach based on guided wave propagation and spatial multiple signal classification. Structural Control and Health Monitoring, 2015;22:969–983. [Google Scholar]
- Ambrozinski L, Pelivanov I, Song S, Yoon SJ, Li D, Gao L, Shen TT, Wang RK, O’Donnell M. Air-coupled acoustic radiation force for non-contact generation of broadband mechanical waves in soft media. Applied Physics Letters, 2016a;109. [DOI] [PMC free article] [PubMed] [Google Scholar]
- Ambrozinski L, Shaozhen Song and Yoon SJ, Pelivanov I, Li D, Gao L, Shen TT, Wang RK, O’Donnell M. Acoustic micro-tapping for non-contact 4d imaging of tissue elasticity. Scientific Reports volume, 2016b. [DOI] [PMC free article] [PubMed] [Google Scholar]
- Bercoff J, Tanter M, Muller M, Fink M. The role of viscosity in the impulse diffraction field of elastic waves induced by the acoustic radiation force. IEEE transactions on ultrasonics, ferroelectrics, and frequency control, 2004;51:1523–1536. [DOI] [PubMed] [Google Scholar]
- Bernal M, Nenadic I, Urban MW, Greenleaf JF. Material property estimation for tubes and arteries using ultrasound radiation force and analysis of propagating modes. The Journal of the Acoustical Society of America, 2011;129:1344–1354. [DOI] [PMC free article] [PubMed] [Google Scholar]
- Bloch S, Hales A. New techniques for the determination of surface wave phase velocities. Bulletin of the Seismological Society of America, 1968;58:1021–1034. [Google Scholar]
- Chen S, Fatemi M, Greenleaf JF. Quantifying elasticity and viscosity from measurement of shear wave speed dispersion. The Journal of the Acoustical Society of America, 2004;115:2781–2785. [DOI] [PubMed] [Google Scholar]
- Chen S, Urban MW, Pislaru C, Kinnick R, Zheng Y, Yao A, Greenleaf JF. Shearwave dispersion ultrasound vibrometry (sduv) for measuring tissue elasticity and viscosity. IEEE Trans. Ultrason., Ferroelect., Freq. Control, 2009;56:55–62. [DOI] [PMC free article] [PubMed] [Google Scholar]
- Deffieux T, Gennisson JL, Larrat B, Fink M, Tanter M. The variance of quantitative estimates in shear wave imaging: Theory and experiments. IEEE transactions on ultrasonics, ferroelectrics, and frequency control, 2012;59:2390–2410. [DOI] [PubMed] [Google Scholar]
- Deffieux T, Montaldo G, Tanter M, Fink M. Shear wave spectroscopy for in vivo quantification of human soft tissues visco-elasticity. IEEE Trans. Med. Imag, 2009;28:313–322. [DOI] [PubMed] [Google Scholar]
- Delsanto P, Schechter R, Chaskelis H, Mignogna R, Kline R. Connection machine simulation of ultrasonic wave propagation in materials. ii: the two-dimensional case. Wave Motion, 1994;20:295–314. [Google Scholar]
- Doherty JR, Trahey GE, Nightingale KR, Palmeri ML. Acoustic radiation force elasticity imaging in diagnostic ultrasound. IEEE Trans. Ultrason., Ferroelect., Freq. Control, 2013;60:685–701. [DOI] [PMC free article] [PubMed] [Google Scholar]
- Elegbe EC, McAleavey SA. Single tracking location methods suppress speckle noise in shear wave velocity estimation. Ultrasonic imaging, 2013;35:109–125. [DOI] [PMC free article] [PubMed] [Google Scholar]
- Gra KF. Wave motion in elastic solids. Courier Corporation, 2012. [Google Scholar]
- Helfenstein-Didier C, Andrade R, Brum J, Hug F, Tanter M, Nordez A, Gennisson J. In vivo quantification of the shear modulus of the human achilles tendon during passive loading using shear wave dispersion analysis. Physics in medicine and biology, 2016;61:2485. [DOI] [PubMed] [Google Scholar]
- Huwart L, Peeters F, Sinkus R, Annet L, Salameh N, ter Beek LC, Horsmans Y, Van Beers BE. Liver fibrosis: non-invasive assessment with mr elastography. NMR in Biomedicine: An International Journal Devoted to the Development and Application of Magnetic Resonance In vivo, 2006;19:173– 179. [DOI] [PubMed] [Google Scholar]
- Jensen JA. Field: A program for simulating ultrasound systems In: 10th Nordicbaltic Conference On Biomedical Imaging, Vol. 4, Supplement 1, Part 1: 351–353. Citeseer, 1996. [Google Scholar]
- Jensen JA, Svendsen NB. Calculation of pressure fields from arbitrarily shaped, apodized, and excited ultrasound transducers. IEEE Trans. Ul-trason., Ferroelect., Freq. Control, 1992;39:262–267. [DOI] [PubMed] [Google Scholar]
- Kasai C, Namekawa K, Koyano A, Omoto R. Real-time two-dimensional blood flow imaging using an autocorrelation technique. IEEE Trans. Sonics Ultrason, 1985;32:458–464. [Google Scholar]
- Kijanka P, Packo P, Staszewski W, Uhl T. Local interaction simulation approach for temperature effect modelling in lamb wave propagation In: Proceedings of the 6th European Workshop on Structural Health Monitoring, 2012. pp. 856–862. [Google Scholar]
- Kijanka P, Qiang B, Song P, Amador C, Chen S, Urban MW. Robust phase velocity dispersion estimation of viscoelastic materials used for medical applications based on the multiple signal classification method. IEEE Trans. Ultrason., Ferroelect., Freq. Control, 2018;65:423–439. [DOI] [PMC free article] [PubMed] [Google Scholar]
- Kijanka P, Radecki R, Packo P, Staszewski W, Uhl T. Gpu-based local interaction simulation approach for simplified temperature effect modelling in lamb wave propagation used for damage detection. Smart materials and structures, 2013;22:035014. [Google Scholar]
- Kijanka P, Urban MW. Local phase velocity based imaging (lpvi): A new technique used for ultrasound shear wave elastography. IEEE Transactions on Medical Imaging. DOI: 10.1109/TMI.2018.2874545, 2018. [DOI] [PMC free article] [PubMed] [Google Scholar]
- Langdon JH, Elegbe E, McAleavey SA. Single tracking location acoustic radiation force impulse viscoelasticity estimation (stl-ve): A method for measuring tissue viscoelastic parameters. IEEE transactions on ultrasonics, ferroelectrics, and frequency control, 2015;62:1225–1244. [DOI] [PMC free article] [PubMed] [Google Scholar]
- Lee B, Staszewski W. Modelling of lamb waves for damage detection in metallic structures: Part i. wave propagation. Smart Materials and Structures, 2003;12:804. [Google Scholar]
- McAleavey S, Menon M, Elegbe E. Shear modulus imaging with spatially-modulated ultrasound radiation force. Ultrasonic imaging, 2009;31:217–234. [DOI] [PMC free article] [PubMed] [Google Scholar]
- McAleavey SA, Nightingale KR, Trahey GE. Estimates of echo correlation and measurement bias in acoustic radiation force impulse imaging. IEEE transactions on ultrasonics, ferroelectrics, and frequency control, 2003;50:631–641. [DOI] [PubMed] [Google Scholar]
- Montaldo G, Tanter M, Bercoff J, Benech N, Fink M. Coherent plane-wave compounding for very high frame rate ultrasonography and transient elastography. IEEE Trans. Ultrason., Ferroelect., Freq. Control, 2009;56:489–506. [DOI] [PubMed] [Google Scholar]
- Nenadic IZ, Urban MW, Aristizabal S, Mitchell SA, Humphrey TC, Greenleaf JF. On lamb and rayleigh wave convergence in viscoelastic tissues. Physics in Medicine & Biology, 2011a;56:6723. [DOI] [PMC free article] [PubMed] [Google Scholar]
- Nenadic IZ, Urban MW, Mitchell SA, Greenleaf JF. Lamb wave dispersion ultrasound vibrometry (lduv) method for quantifying mechanical properties of viscoelastic solids. Physics in medicine and biology, 2011b;56:2245. [DOI] [PMC free article] [PubMed] [Google Scholar]
- Nightingale KR, Rouze NC, Rosenzweig SJ, Wang MH, Abdelmalek MF, Guy CD, Palmeri ML. Derivation and analysis of viscoelastic properties in human liver: Impact of frequency on fibrosis and steatosis staging. IEEE Trans. Ultrason., Ferroelect., Freq. Control, 2015;62:165–175. [DOI] [PMC free article] [PubMed] [Google Scholar]
- Palmeri ML, Deng Y, Rouze NC, Nightingale KR. Dependence of shear wave spectral content on acoustic radiation force excitation duration and spatial beamwidth In: Ultrasonics Symposium (IUS), 2014 IEEE International. IEEE, 2014. pp. 1105–1108. [Google Scholar]
- Palmeri ML, Wang MH, Dahl JJ, Frinkley KD, Nightingale KR. Quantifying hepatic shear modulus in vivo using acoustic radiation force. Ultrasound in medicine & biology, 2008;34:546–558. [DOI] [PMC free article] [PubMed] [Google Scholar]
- Rose JL. Ultrasonic guided waves in solid media. Cambridge University Press, 2014. [Google Scholar]
- Rouze NC, Deng Y, Palmeri ML, Nightingale KR. Accounting for the spatial observation window in the 2-d fourier transform analysis of shear wave attenuation. Ultrasound in Medicine & Biology, 2017;43:2500–2506. [DOI] [PMC free article] [PubMed] [Google Scholar]
- Sandrin L, Fourquet B, Hasquenoph JM, Yon S, Fournier C, Mal F, Christidis C, Ziol M, Poulet B, Kazemi F, et al. Transient elastography: a new non-invasive method for assessment of hepatic finvasive method for assessment of hepatic fibrosis. Ultrasound in medicine & biology, 2003;29:1705–1713. [DOI] [PubMed] [Google Scholar]
- Sarvazyan A, Hall T, Urban M, Fatemi M, Aglyamov S, Garra B. Elasticity imaging-an emerging branch of medical imaging. an overview. Curr. Med. Imaging Rev, 2011;7:255–282. [DOI] [PMC free article] [PubMed] [Google Scholar]
- Sarvazyan AP, Rudenko OV, Swanson SD, Fowlkes JB, Emelianov SY. Shear wave elasticity imaging: a new ultrasonic technology of medical diagnostics. Ultrasound in medicine & biology, 1998;24:1419–1435. [DOI] [PubMed] [Google Scholar]
- Schmidt R Multiple emitter location and signal parameter estimation. IEEE transactions on antennas and propagation, 1986;34:276–280. [Google Scholar]
- Song P, Macdonald MC, Behler RH, Lanning JD, Wang MH, Urban MW, Manduca A, Zhao H, Callstrom MR, Alizad A, et al. Two-dimensional shear-wave elastography on conventional ultrasound scanners with time-aligned sequential tracking (tast) and shear elastography (cuse). IEEE Trans. Ultrason., Ferroelect., Freq. Control, 2015;62:290–302. [DOI] [PMC free article] [PubMed] [Google Scholar]
- Urban MW, Pislaru C, Nenadic IZ, Kinnick RR, Greenleaf JF. Measurement of viscoelastic properties of in vivo swine myocardium using lamb wave dispersion ultrasound vibrometry (lduv). IEEE transactions on medical imaging, 2013;32:247–261. [DOI] [PMC free article] [PubMed] [Google Scholar]
- Walker WF, Trahey GE. A fundamental limit on delay estimation using partially correlated speckle signals. IEEE Transactions on Ultrasonics, Ferro-electrics, and Frequency Control, 1995;42:301–308. [Google Scholar]
- Wu Q, Zheng X, Pan J, Zhang F, Zhang G. Measurement of inter-station phase velocity by wavelet transformation. Earthquake Science, 2009;22:425–429. [Google Scholar]
- Zhao H, Song P, Urban MW, Kinnick RR, Yin M, Greenleaf JF, Chen S. Bias observed in time-of-flight shear wave speed measurements using radiation force of a focused ultrasound beam. Ultrasound in medicine & biology, 2011;37:1884–1892. [DOI] [PMC free article] [PubMed] [Google Scholar]


