Abstract
Background
Studies of older patients with colorectal cancer(CRC) have found inconsistent results about the correlation of various comorbidities with overall survival(OS) and treatment tolerance. To refine our understanding, we evaluated this correlation using the Cumulative Illness Rating Scale-Geriatric(CIRS-G) and heat maps to identify subgroups with the highest impact.
Methods
We retrospectively reviewed 153 patients aged 65 years and older with stage IV CRC undergoing chemotherapy. We calculated CIRS-G scores, and a Total Risk Score(TRS) derived from a previous heat map study. The association between CIRS-G scores/TRS and OS, unplanned hospitalizations, and chemotoxicity was examined by the Cox proportional hazards model.
Results
Median age was 71 years. Median MAX2 score of chemotherapies was 0.134(0.025–0.231). The most common comorbidities were vascular(79.8%), eye/ear/nose/throat(68%), and respiratory disease(52.4%). Median OS was 25.1 months(95% confidence interval: 21.2–27.6). In univariate analysis, ECOG PS >=2(HR 1.86(1.1–3.17), p=0.019), poorly differentiated histology(HR 2.03(1.27–3.25), p=0.003), primary site(rectum vs colon)(HR 0.58 (0.34–0.98), p=0.04), age at diagnosis(HR per 5y 1.20 (1.04–1.39), p=0.012), and number of CIRS-G grade 4 comorbidities(HR 1.86 (1.1–3.17), p=0.019) were associated with OS. In multivariate analysis, the number of CIRS-G grade 4 comorbidities lost significance, although it retained it in the subgroup of patients with colon cancer. Conversely, the TRS was associated with OS in patients with rectal cancer. No association of comorbidity with unplanned hospitalization or chemotoxicity was observed.
Conclusions
In older adults with metastatic CRC, the number of CIRS-G grade 4 comorbidities was associated with worse OS but no specific CIRS-G category was independently associated with OS, unplanned hospitalization, or toxicities.
Keywords: Geriatric oncology, colorectal cancer, comorbidity, heat maps
Background
Aging is associated with decreased physiologic reserve, comorbidity and polypharmacy, functional dependence, and inadequate social support [1–4]. The rate and amount of change varies from individual to individual, but some level of comorbidity is present in more than 90% of patients with cancer aged 70 and older, being severe in 40% of the cases [1]. Therefore, comorbidity is an important issue in geriatric oncology. Many studies showed that comorbidity is associated with poor survival [5]. In most of the studies done on patients with colorectal cancer, comorbidity was measured using the Charlson Comorbidity Index (CCI), and the presence of comorbidities was shown to be negatively associated with overall survival but not with cancer-specific mortality [6–9]. Although some studies found that there was a difference in the comorbidity burden between older adults with colorectal cancer and controls, no study was done on the association of comorbidity with toxicity in older adults with colorectal cancer treated with chemotherapy [7, 10]. Additionally, the CCI is a limited list of conditions that are weighted according to their relative risk of death. It was developed in a general hospital population, although it has been used in specific cancers including breast cancer, lung cancer, head and neck cancer and hematologic malignancy [11–14]. The Cumulative Illness Rating Scale-Geriatric (CIRS-G) is more sensitive and has more prognostic value than the CCI [14, 15]. For example the measured prevalence of comorbidity in older patients with cancer with various tumor types was 94% by the CIRS-G and 36% by the CCI[16].
Comorbidity is a complex multidimensional category of data. Traditional approaches have tried to summarize their severity using summary instruments, such as the CCI and the CIRS-G. Severity is defined either as an impact on survival, as in the CCI, or a combination of survival, functional impairment, and need for treatment, as in the CIRS-G. These instruments have demonstrated their validity in geriatric oncology. They are associated with survival and have sometimes been associated with other outcomes such as risk of major toxicities and hospitalization [17, 18]. It makes intuitive sense however, that different diseases may impact different outcomes: e.g. survival vs function vs chemotherapy toxicity. Therefore, a global rating of comorbidity might not identify the diseases most likely to impact each outcome. For example some data suggest that the impact of the CCI listed diseases on the survival of patients colorectal cancer is different from their CCI weight[19].We saw a potential in using a heat-map style approach in identifying specific subgroups of comorbidities that would be linked to an outcome. In a first approach to the problem, we decided to build upon a grid of CIRS-G rated diseases, and assess separately both the frequency and impact of diseases in each organ categories. Heat maps and their associated algorithms have potential advantages when analyzing data. They allow visualizing both the frequency and the level of association with an outcome of the various variables; they may identify clustering patterns; they may also visualize the predominant level of severity of a given set of diseases[22]. Although technically tables could present similar data, such tables can rapidly become unwieldy in size and unclear: For example, a table reporting the simple heat map in our previous article would have 5586 data points[20]. Our first publication did identify a subgroup of diseases associated with survival in a general cohort of patients with cancer, which we summarized as a “total risk score” (TRS) [20]. In this article and parallel projects[21], we are expanding further the analysis by a) focusing on specific cancers, and b) analyzing other outcomes such as toxicity from chemotherapy and unplanned hospitalizations.
Methods
Patients and methods
We retrospectively reviewed patients with stage IV colorectal cancer who were over 65 years old and had received initial chemotherapy for their metastatic disease at Moffitt Cancer Center from 2000 to 2015. Comorbidity was assessed by the CIRS-G. CIRS-G has 14 organ categories and grades each comorbidity according to severity (score 0–4) [14, 23]. Five summary scores are: the total number of categories endorsed, the total score, the ratio of total score/number of endorsed categories (severity index), and the number of categories at score 3 and 4 for a given patient in CIRS-G. The 14 organ categories are: Heart, Vascular, Hematopoietic, Respiratory, Eye/Ear/Nose/Throat, Upper GI, Lower GI, Liver, Renal, Genitourinary, Musculoskeletal/integument, Neurological, Endocrine/Metabolic and Breast, and Psychiatric illness. The total score and severity index were calculated for each patient. The total score was defined as the sum of scores in all organ systems and severity index was defined as total score divided by the number of categories with a score greater than 0. Severe comorbidity was defined as having one or more comorbidity grade 3 or 4[15].
The following clinical data were obtained: demographics (age, sex, and race), metastasis or relapse, ECOG PS, site of metastasis, previous treatment, MAX2 index[24, 25], unplanned hospitalization, and adverse events (AEs), including abnormal laboratory findings, graded with the National Cancer Institute Common Terminology Criteria for AEs (CTCAE) ver.4.0. The MAX2 index is a validated tool that allows a comparison of diverse chemotherapy regimens for their risk of grade 4 hematologic or grade 3–4 non-hematologic toxicity (“severe toxicity”). Adverse events and unplanned hospitalizations were computed as the first occurrence after initiation of their frontline chemotherapy. Overall survival (OS) was also collected. All data were collected from electronic medical records of Moffitt Cancer Center and Total Cancer Care Database. We analyzed the association of comorbidities with OS, adverse events, and unplanned hospitalization by the Cox proportional hazard regression model. Of note, as various molecular tests were progressively introduced during this period, many patients did not have this information available, and therefore this data was not included in this analysis.
Heat maps
Heat maps visualized the comorbidity distribution in the following way. Each patient was attributed a line. Organ systems were attributed columns, and the heat color was based on each organ’s CIRS-G severity rating, from blue (0) to red (4). The comorbidity types and levels of expression were divided by their association with adverse events, overall survival and unplanned hospitalization.
This study was approved by the Institutional Review Board of the University of South Florida.
Statistics
Patients’ clinical and demographical characteristics were summarized using descriptive statistics: frequency and proportion for categorical measures and mean, standard deviation, median, and range for continuous measures. OS was measured from the date of diagnosis of metastatic disease to date of death or last follow-up date. The survival function was estimated by the Kaplan-Meier method, and the difference between the functions was assessed by the log-rank test. The Cox proportional hazards regression model was used to assess the association with OS. In addition to the CIRS-G scores mentioned above, we tested the performance of a TRS we had developed in a previous project[20] . The score was then constructed as follows: the impact of comorbidity on OS was evaluated, and the risk score was developed based on the hazard ratio and significance; risk score 1 was given to those who had CIRS-G categories with p-value of < 0.1 and hazard ratio of 1 to 2, and score 2 was assigned to those with p-value of < 0.1 and hazard ratio of >2. The TRS was defined as the sum of risk scores. Based on TRS, patients were divided into two risk groups. The high risk patients were defined as those who had a TRS of 2 or more, while the low risk patients were those who had a TRS of 0 or 1. The association with binary endpoints such as unplanned hospitalization, non-hematologic, and hematologic toxicity was assessed by the logistic regression model. The multivariable models for the unplanned hospitalization and OS were built by the backward elimination method, when adjusting for potential confounding variables. A variable with two-sided p-value of >0.05 was eliminated at each step. No multiple comparisons were considered. All p-values were two-sided and p-value of <0.05 was considered statistically significant. All data analysis was conducted by SAS version 13.1, and heat maps were created by R.
Results
1. Patient characteristics
One hundred fifty-three patients were eligible. Patient characteristics are listed in Table 1. The median age at diagnosis was 71 years old .55.6% of patients were male and 83% were white. Most of these patients (87.6%) had an ECOG performance status of 0 or 1. The site of origin was colon in 130 (85%) patients, and rectum in 23 (15%). Site of metastasis was liver in 75.2%. Ninety-one (59.5%) patients had previous surgery. Median MAX2 score of the chemotherapies was 0.134 (0.025–0.231). Median number of the chemotherapy cycles was 6 (1–17).
Table 1.
Patient characteristics
| Characteristics | All patients (N=153) |
|---|---|
| Age at diagnosis, median (range) | 71 years (65–89) |
| Gender, n (%) | |
| Male | 86 (56%) |
| Female | 68 (44.%) |
| Race, n (%) | |
| White | 127 (83%) |
| Black | 16 (10.5%) |
| Asian | 6 (3.9%) |
| Others | 4 (2.6%) |
| ECOG Performance status, n (%) | |
| 0 | 73 (47.7%) |
| 1 | 61 (39.9%) |
| 2 | 15 (9.8%) |
| 3 | 4 (2.6%) |
| Primary site, n (%) | |
| Colon | 130 (85%) |
| Rectum | 23 (15%) |
| Site of metastasis, n (%) | |
| Liver only | 75 (49%) |
| Lung only | 12 (7.9%) |
| Others | 66 (43.1%) |
|
Previous treatment for limited disease, n (%) -None (no limited disease) -Surgery -CCRT -Adjuvant chemotherapy |
62(40.5%) 91 (59.5%) 6 (3.9%) 4 (2.6%) |
|
Chemotherapy received* −5-FU/capecitabine based -Irinotecan-containing -Oxaliplatin-containing -Other |
33 (22%) 31 (20%) 78 (51%) 11 (7%) |
|
Median MAX 2 score, (range) Median number of chemotherapy cycle, (range) |
0.134 (0.025–0.231) 6 (1–17) |
First line chemotherapy for metastatic disease. May or may not include monoclonal antibodies as part of the regimen.
2. Comorbidity
Comorbidity distribution for all patients according to CIRS-G scores is shown in Figure 1. All patients had at least one comorbidity. The most common comorbidities were vascular (79.8%), eye/ear/nose/throat (68%), and respiratory disease (52.4%). The median total CIRS-G score was 8 (1–20), and the distribution is shown in Figure 2. The median severity index (total score/number of categories) was 0.57 (0.07–1.43). Patients with eye/ear/nose/throat and endocrine/metabolic/breast disease had relatively lower CIRS-G score comorbidity than those with vascular and respiratory disease. Categories with the highest proportion of CIRS-G score 3 or 4 were vascular (29.4%), respiratory (13.1%) and cardiac disease (11.1%). Fourty-four patients (28.8%) had one level 3 comorbidity, 27(17.7%) had two, and 6(3.9%) had three. Eleven patients(7.2%) had one level 4 comorbidity, and 1(0.7%) had two.
Figure 1.
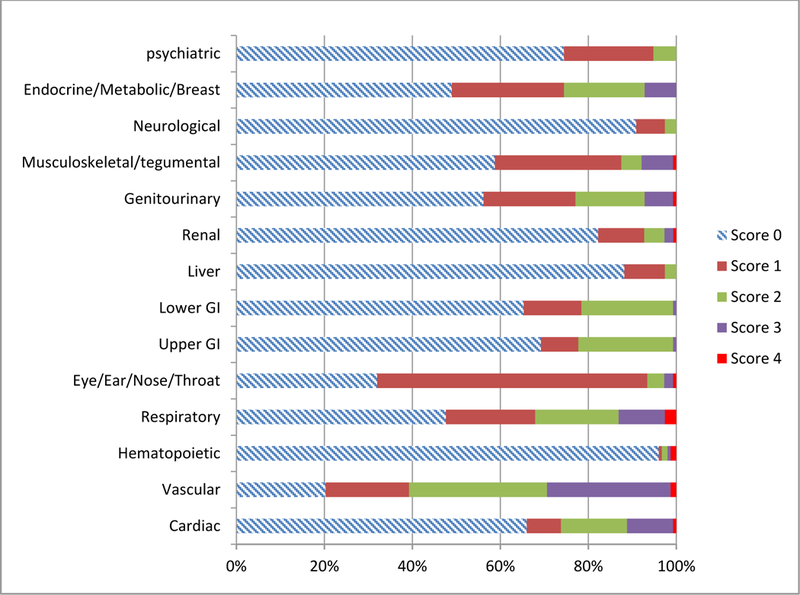
Comorbidity distribution in the cohort according to CIRS-G grade.
Figure 2.
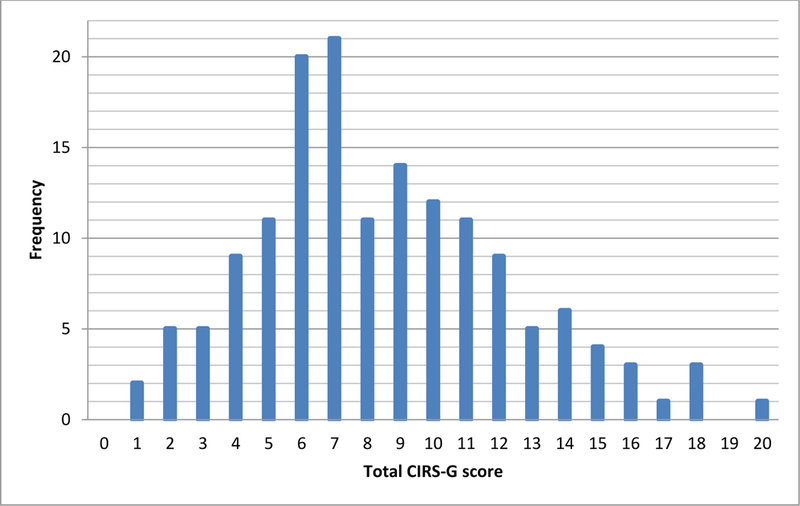
Distribution of patients according to CIRS-G total scores.
3. Adverse events of chemotherapy
The treatment-related AEs are summarized in Table 2. All grade hematologic AEs occurred in 17 patients, 9 of which had CIRS-G score 3 or 4. The most common grade 4 hematologic AEs was neutropenia (N=16, 10.5%). Two patients had grade 4 anemia, and each of their CIRS-G score was 3 or 4. In univariate and multivariate analysis for factors associated with hematologic toxicity, CIRS-G categories and TRS did not have a significant association. In univariate and multivariate analysis for factors associated with non-hematologic toxicity, CIRS-G categories and TRS did not have a significant association with non-hematologic toxicity. A comorbidity heat map shows the association of comorbidities and hematologic toxicities (Fig 3A). The heat maps showed the trend that patients with hematologic toxicity had more severe comorbidities for vascular disease and genitourinary disease than patients with no hematologic toxicity. Another comorbidity heat map showed the association of comorbidities and non-hematologic toxicities (Fig 3B). However, the heat map showed that there was no difference between patients with and without non-hematologic toxicity.
Table 2.
Adverse events of all patients
| Adverse events | N (%) |
|---|---|
| Hematologic toxicity of all grades, n (%) | 17 (11.1) |
| Grade 4 hematologic toxicity | |
| Neutropenia, n (%) | 16 (10.5) |
| Anemia, n (%) | 2 (1.3) |
| Non-hematologic toxicity of all grades, n (%) | 70 (11.1) |
Figure 3.
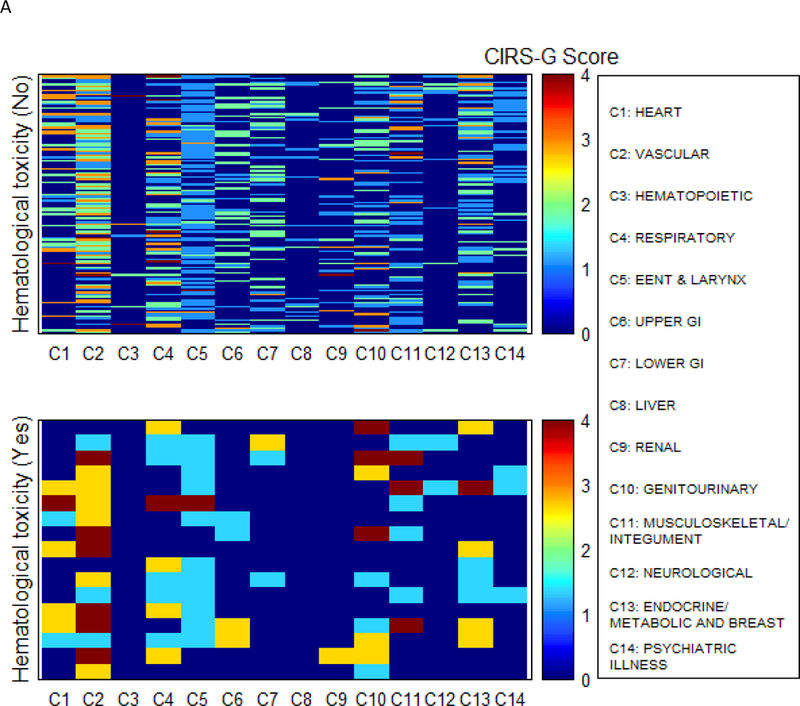
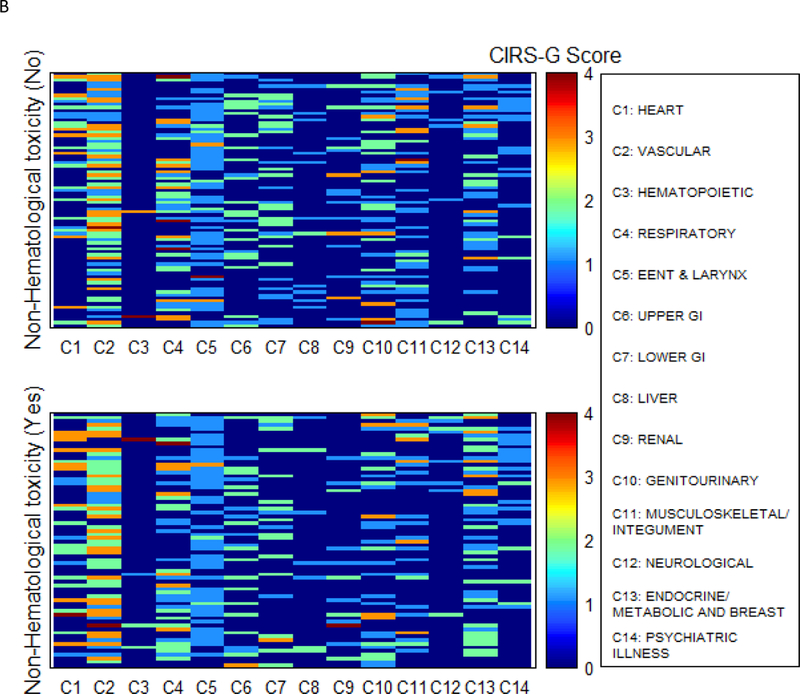
Comorbidity heat map for hematologic toxicity (A) and non-hematologic toxicity (B)
4. Overall survival
The median follow-up duration of all surviving patients was 22.3 months (range 2.9–127.2). The median OS of all patients was 25.1 months (95% CI: 21.2–27.6). In univariate and multivariate analysis for prognostic factors associated with OS (Table 3), ECOG PS of 2 or higher, poorly differentiated histology, age at diagnosis, and primary site were significant worse prognostic factors of OS. In univariate analysis of CIRS-G categories for OS, no categories were found to be associated with OS.
Table 3.
Univariate (A) and multivariate (B) Cox regression analysis for OS of all patients.
| (A) | |||
|---|---|---|---|
| Variables | Level | HR (95% CI) | p |
| Gender (ref = Male) | Female | 1.25 (0.87–1.80) | 0.22 |
| Race (ref = White) | Others | 1.47 (0.93–2.32) | 0.10 |
| PS ECOG (ref=0–1) | ≥ 2 | 1.86 (1.10–3.17) | 0.019 |
| Primary site (ref = Colon) | Rectum | 0.58 (0.34–0.98) | 0.040 |
| Histology Differentiation (ref = Well/Moderate) | Poorly differentiation | 2.03 (1.27–3.25) | 0.003 |
| Liver metastasis (ref = No) | Yes | 0.84 (0.55–1.29) | 0.42 |
| Peritoneum metastasis (ref = No) | Yes | 1.52 (0.97–2.39) | 0.07 |
| Lung metastasis (ref = No) | Yes | 1.14 (0.74–1.76) | 0.56 |
| Prior Operation (ref = No) | Yes | 0.80 (0.55–1.17) | 0.25 |
| Max2, per 1SD (SD = 0.046) increase | Female | 1.10 (0.93–1.30) | 0.27 |
| Age at Diagnosis, per 5 years old increase | 1.17 1.01–1.34) | 0.034 | |
| CIRS-G severity index | 0.99 (0.81–1.21) | 0.94 | |
| Number of CIRS-G score 3 (ref=0) | 1 | 1.02 (0.68–1.54) | 0.179 |
| >=2 | 0.64 (0.39–1.06) | 0.085 | |
| Number of CIRS-G score 4 (ref=0) | >=1 | 2.16 (1.15–4.05) | 0.014 |
| HEART (ref=0) | 1–4 | 0.89 (0.61–1.31) | 0.563 |
| VASCULAR (ref=0) | 1–4 | 0.75 (0.49–1.14) | 0.177 |
| HEMATOPOIETIC (ref=0) | 1–4 | 1.78 (0.72–4.41) | 0.204 |
| RESPIRATORY (ref=0) | 1–4 | 1.25 (0.87–1.79) | 0.224 |
| EENT_LARYNX (ref=0) | 1–4 | 0.94 (0.65–1.38) | 0.767 |
| UPPER_GI (ref=0) | 1–4 | 1.27 (0.87–1.85) | 0.222 |
| LOWER_GI (ref=0) | 1–4 | 0.83 (0.56–1.21) | 0.325 |
| LIVER (ref=0) | 1–4 | 0.72 (0.40–1.28) | 0.262 |
| RENAL (ref=0) | 1–4 | 1.24 (0.79–1.94) | 0.352 |
| GENITOURINARY (ref=0) | 1–4 | 0.94 (0.66–1.35) | 0.730 |
| MUSCULOSKELETAL (ref=0) | 1–4 | 1.02 (0.70–1.48) | 0.928 |
| NEUROLOGICAL (ref=0) | 1–4 | 0.97 (0.47–2.00) | 0.939 |
| ENDOCRINE (ref=0) | 1–4 | 0.73 (0.51–1.04) | 0.076 |
| PSYCHIATRIC_ILLNESS (ref=0) | 1–4 | 1.22 (0.79–1.87) | 0.366 |
| (B) | |||
|---|---|---|---|
| Variables | Level | HR (95% CI) | p |
| PS ECOG (ref=0–1) | 0–1 | ||
| ≥ 2 | 2.28 (1.33–3.92) | 0.003 | |
| Primary site (ref=colon) | Rectum | 0.47 (0.28–0.81) | 0.006 |
| Histology differentiation (ref=well/moderate) | Poorly differentiation | 2.03 (1.27–3.25) | 0.003 |
| Age, per 5 years old increase | 1.20 (1.04–1.39) | 0.012 | |
In analysis according to primary site, the median OS for patients with colon cancer was 23.7 month (95% CI: 17.3–25.9) and for patients with rectal cancer was 35.6 months (95% CI: 27.1–49.5). In univariate analysis for prognostic factors associated with OS of patients with colon cancer, ECOG PS of 2 or higher, poorly differentiated histology, number of CIRS-G 4 categories and age at diagnosis were associated with worse OS, while prior surgery and endocrine comorbidity were favorable prognostic factors (Table 4). In multivariate analysis, ECOG PS 2 or higher, poorly differentiated histology, number of CIRS-G 4 categories, no prior surgery, and peritoneal metastasis were adverse prognostic factors. For patients with rectal cancer In univariate analysis of patients with rectal cancer, poorly differentiated histology, respiratory disease, and renal disease, were worse prognostic factors for OS (Table 5). In multivariate analysis for rectal cancer, poorly differentiated histology and TRS >=2 were worse prognostic factors for OS. According to TRS group, a comorbidity heat map shows the association of comorbidities and survival (Fig 4). The high TRS risk patients had more comorbidities for respiratory, lower GI, renal and endocrine/metabolic and breast disease and psychiatric illness than low TRS risk patients. Survival of low TRS risk patients had significantly longer than that of the high TRS risk patients (median survival: 49.5 months vs. 27.5 months, HR=4.32, 95% CI:1.32–14.12, p=0.009) (Fig 5).
Table 4.
Univariate (A) and multivariate (B) Cox regression analysis for OS of patients with colon cancer.
| Variables | Level | HR (95% CI) | p |
|---|---|---|---|
| Gender (ref = Male) | Female | 1.27 (0.87–1.87) | 0.217 |
| Race (ref = White) | Others | 1.41 (0.87–2.28) | 0.155 |
| PS ECOG (ref=0–1) | ≥ 2 | 2.59 (1.46–4.60) | 0.001 |
| Histology Differentiation (ref = Well/Moderate) | Poorly differentiation | 1.94 (1.16–3.25) | 0.011 |
| Liver metastasis (ref = No) | Yes | 0.73 (0.46–1.17) | 0.189 |
| Peritoneum metastasis (ref = No) | Yes | 1.51 (0.94–2.41) | 0.084 |
| Lung metastasis (ref = No) | Yes | 1.16 (0.72–1.85) | 0.540 |
| Prior Operation (ref = No) | Yes | 0.61 (0.40–0.93) | 0.021 |
| Max2, per 1SD (SD = 0.046) increase | Female | 1.09 (0.13–1.32) | 0.359 |
| Age at Diagnosis, per 5 years old increase | 1.20 (1.03–1.39) | 0.023 | |
| CIRS-G severity index | 0.93 (0.75–1.16) | 0.539 | |
| Number of CIRS-G score 3 (ref=0) | 1 | 0.91 (0.59–1.40) | 0.084 |
| >=2 | 0.61 (0.35–1.07) | 0.085 | |
| Number of CIRS-G score 4 (ref=0) | >=1 | 2.12 (1.13–3.99) | 0.017 |
| HEART (ref=0) | 1–4 | 0.83 (0.55–1.24) | 0.354 |
| VASCULAR (ref=0) | 1–4 | 0.81 (0.51–1.30) | 0.391 |
| HEMATOPOIETIC (ref=0) | 1–4 | 1.93 (0.78–4.79) | 0.147 |
| RESPIRATORY (ref=0) | 1–4 | 1.07 (0.73–1.57) | 0.735 |
| EENT_LARYNX (ref=0) | 1–4 | 0.80 (0.53–1.23) | 0.310 |
| UPPER_GI (ref=0) | 1–4 | 1.27 (0.85–1.90) | 0.240 |
| LOWER_GI (ref=0) | 1–4 | 0.72 (0.48–1.08) | 0.112 |
| LIVER (ref=0) | 1–4 | 0.64 (0.36–1.15) | 0.134 |
| RENAL (ref=0) | 1–4 | 1.09 (0.66–1.78) | 0.739 |
| GENITOURINARY (ref=0) | 1–4 | 1.02 (0.69–1.52) | 0.904 |
| MUSCULOSKELETAL (ref=0) | 1–4 | 1.10 (0.74–1.64) | 0.645 |
| NEUROLOGICAL (ref=0) | 1–4 | 0.93 (0.43–2.02) | 0.863 |
| ENDOCRINE (ref=0) | 1–4 | 0.58 (0.39–0.85) | 0.005 |
| PSYCHIATRIC_ILLNESS (ref=0) | 1–4 | 1.14 (0.73–1.78) | 0.569 |
| (b) | |||
|---|---|---|---|
| Variables | Level | HR (95% CI) | p |
| PS ECOG (ref=0–1) | ≥ 2 | 3.36 (1.84, 6.17) | <.001 |
| Peritoneum metastasis | Yes | 1.80(1.11, 2.93) | 0.017 |
| Histology differentiation (ref=well/moderate) | Poorly differentiation | 1.93 (1.14, 3.26) | 0.014 |
| Number of CIRS-G score 4 (ref=0) | >=1 | 2.52(1.32, 4.81) | 0.005 |
| Prior operation | Yes | 0.52 (0.31, 0.87) | 0.012 |
Table 5.
Univariate (A) and multivariate (B) Cox regression analysis for OS of patients with rectal cancer.
| Variables | Level | HR (95% CI) | p |
|---|---|---|---|
| Gender (ref = Male) | Female | 0.81 (0.28–2.40) | 0.709 |
| Race (ref = White) | Others | 1.77 (0.37–8.41) | 0.476 |
| PS ECOG (ref=0–1) | ≥ 2 | 0.73 (0.16–3.30) | 0.680 |
| Histology Differentiation (ref = Well/Moderate) | Poorly differentiation | 4.60 (1.20–17.59) | 0.026 |
| Liver metastasis (ref = No) | Yes | 1.22 (0.39–3.85) | 0.729 |
| Peritoneum metastasis (ref = No) | Yes | 0.69 (0.09–5.39) | 0.722 |
| Lung metastasis (ref = No) | Yes | 0.99 (0.31–3.11) | 0.981 |
| Prior Operation (ref = No) | Yes | 0.94 (0.33–2.69) | 0.902 |
| Max2, per 1SD (SD = 0.046) increase | Female | 1.19 (0.80–1.77) | 0.405 |
| Age at Diagnosis, per 5 years old increase | 1.02 (0.70–1.48) | 0.932 | |
| CIRS-G severity index | 1.25 (0.65–2.38) | 0.505 | |
| Number of CIRS-G score 3 (ref=0) | 1 | 2.23 (0.59–8.37) | 0.236 |
| >=2 | 1.34 (0.35–5.10) | 0.664 | |
| Number of CIRS-G score 4 (ref=0) | >=1 | 0.00 (0.00-.) | 0.995 |
| HEART (ref=0) | 1–4 | 0.63 (0.08–4.99) | 0.665 |
| VASCULAR (ref=0) | 1–4 | 0.32 (0.10–1.01) | 0.051 |
| HEMATOPOIETIC (ref=0) | 1–4 | NA | NA |
| RESPIRATORY (ref=0) | 1–4 | 3.13 (1.10–8.88) | 0.032 |
| EENT_LARYNX (ref=0) | 1–4 | 1.24 (0.45–3.47) | 0.676 |
| UPPER_GI (ref=0) | 1–4 | 1.08 (0.34–3.44) | 0.901 |
| LOWER_GI (ref=0) | 1–4 | 1.91 (0.60–6.06) | 0.271 |
| LIVER (ref=0) | 1–4 | NA | NA |
| RENAL (ref=0) | 1–4 | 4.91 (1.34–17.91) | 0.016 |
| GENITOURINARY (ref=0) | 1–4 | 0.93 (0.31–2.75) | 0.893 |
| MUSCULOSKELETAL (ref=0) | 1–4 | 0.84 (0.30–2.36) | 0.737 |
| NEUROLOGICAL (ref=0) | 1–4 | 1.39 (0.18–11.02) | 0.756 |
| ENDOCRINE (ref=0) | 1–4 | 1.57 (0.46–5.34) | 0.468 |
|
PSYCHIATRIC_ILLNESS (ref=0) Total Risk Score (ref 0–1) |
1–4 >=2 |
1.35 (0.29–6.27) 4.32 (1.32–14.12) |
0.704 0.015 |
| (b) | |||
|---|---|---|---|
| Variables | Level | HR (95% CI) | p |
| Histology Differentiation (ref = Well/Moderate) | Poorly differentiation | 14.63 (2.63, 81.56) | 0.002 |
| Total risk score | >=2 | 7.49 (1.81, 31.09) | 0.006 |
Figure 4.
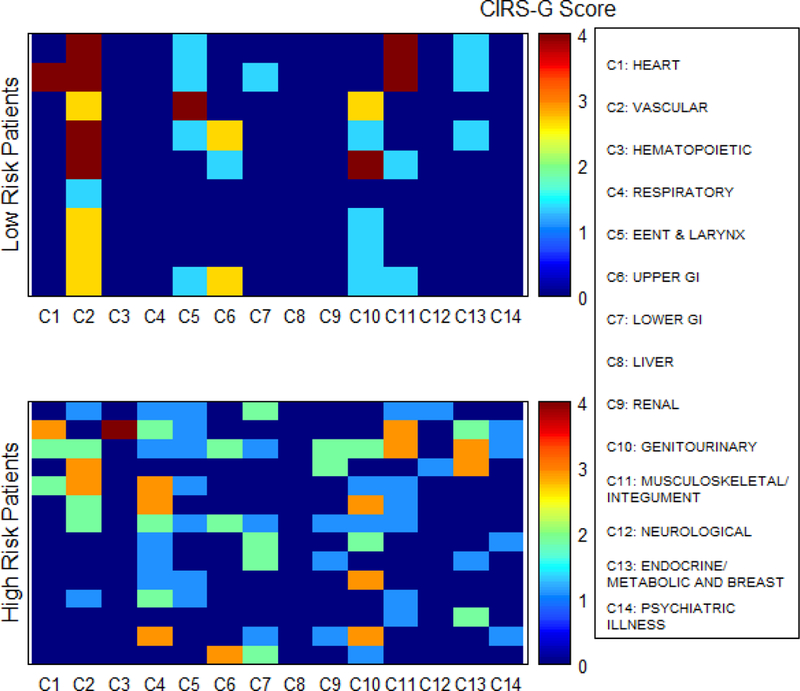
Comorbidity heat map for overall survival in patients with rectal cancer.
Figure 5.
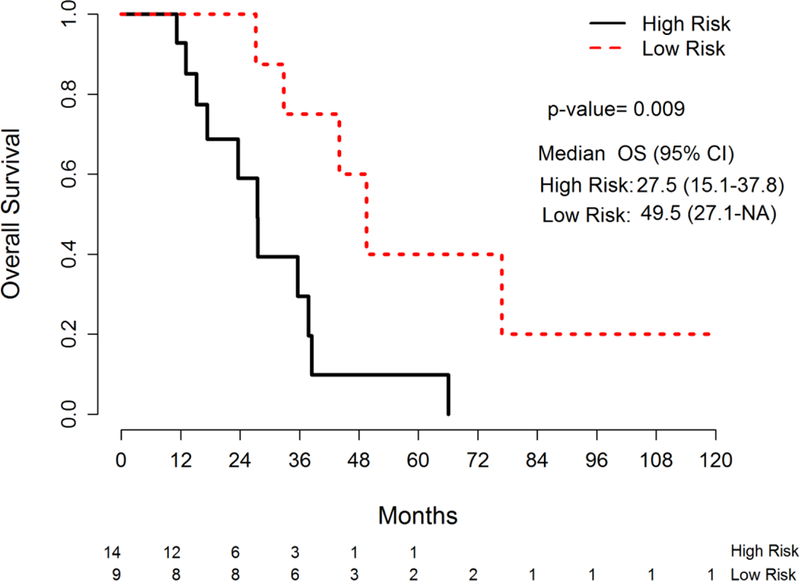
Overall survival by TRS risk group in patients with rectal cancer
5. Unplanned hospitalization
During treatment, 32 patients(21%) had an unplanned hospitalization. In univariate analysis for prognostic factors associated with unplanned hospitalization, age at diagnosis was a worse prognostic factor (OR=1.43, 95%CI: 1.04–1.96, p=0.026). In multivariate analysis, ECOG PS of 2 or higher (OR=2.91, 95%CI: 1.01–8.39, p=0.048) and age at diagnosis (OR=1.48 per 5-year-old increase, 95%CI: 1.07–2.05, p=0.018) were worse prognostic factors associated with unplanned hospitalization. No patients with rectal cancer had an unplanned hospitalization. A comorbidity heat map showed the association of 14 comorbidities and unplanned hospitalization (Fig 6). There was no difference in severity and number of comorbidities between patients with and without unplanned hospitalization.
Figure 6.
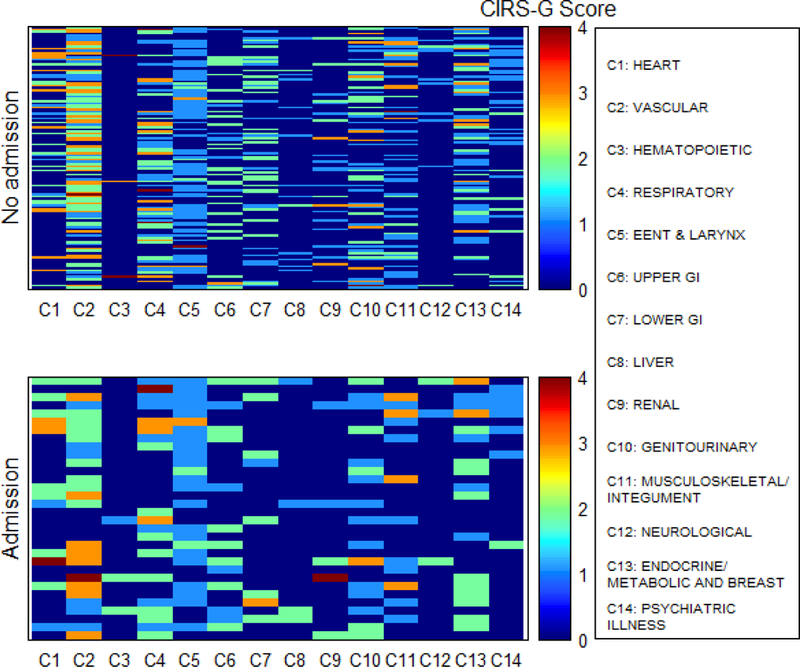
Comorbidity heat map for unplanned hospitalization in all patients
Discussion
This study was the first study to analyze the association of comorbidities with OS, toxicity and unplanned hospitalizations in older adults with colorectal cancer by using heat maps. Our previous heat map study showed that high TRS was a predictor of poor survival in a general group of older adults with cancer, and that heat maps showed interesting insights into the prevalence and associations of comorbidities affecting the OS of these patients[20] . In a parallel study in patients with lung adenocarcinoma, the TRS was also associated with OS[21]. In the present study, TRS >=2 showed a similar association with OS in patients with rectal cancer but not in patients with colon cancer or the overall cohort. Further studies in individual cancer types will be needed before clear conclusions can be reached as to the robustness of the TRS to predict survival.
On further analysis along the lines of CIRS-G categories and summary scores, unlike in our original study, no individual categories of comorbidities were associated with OS. The number of CIRS-G grade 4 diseases was associated with OS in both the overall cohort and the subgroup of patients with colon cancer in univariate analysis, although in only the latter did it remain independently associated in the multivariate analysis. Therefore, the overall pattern of association of comorbidity with OS is less clear in this study than it was in our two other cohorts[20, 21].
Several studies showed an association of comorbidity with mortality or survival in colorectal cancer [7–9].The Danish older adults population-based comorbidity study showed that comorbidity was associated with increased overall mortality, but not cancer-specific mortality. Interestingly enough, their scatter plot analysis shows heterogeneous association of individual diseases with mortality, divergent from their CCI weight [7]. In another Danish population-based cohort study, comorbidity was common in the patients with colorectal cancer and carried poorer prognosis in both cancer subtypes [9]. In a Danish single center retrospective study, comorbidity predicted survival in patients with colon cancer, but not in patients with rectal cancer, a result inverse from ours [26]. One study found that treatment and comorbidity interacted among late-stage or patients with metastatic colorectal cancer, with e.g. cetuximab treated patients with comorbidities faring better than those without [6]..Some of the variability may be explained by differences in the definition of comorbidity (CCI versus expansion based on CIRS-G grading), as well as to the accounting for other variables such as ECOG PS, grade of disease, or treatment types. It would be interesting to test the risk factors identified in our studies, such as grade 4 comorbidity or the TRS in some of the cohorts mentioned above.
Contrary to our expectations, mapping comorbidity in more detail did not identify subsets of diseases associated with toxicity or unplanned hospitalizations. Our group has been testing the association of CIRS-G rated comorbidities with chemotherapy toxicity in several trials now, and the results have been overall negative: other elements seem more closely associated with the occurrence or recurrence of severe toxicity [24, 27, 28]. It is interesting to note that overall comorbidity measured in various ways was not an independent predictive factor in the two studies that formally constructed and validated predictive indexes for the risk of chemotherapy toxicity in older patients[28, 29]. There is less literature on the association of comorbidity with unplanned hospitalizations in patients with cancer. Several hypotheses can be made about this lack of independent association of comorbidity with these outcomes. One may be that a lumping effect still blurs the recognition of the impact of specific comorbidities. For example, the CIRS-G classifies together diabetes and hypothyroidism in the endocrine system (albeit with different weights) and retains the highest scoring disease for that category. A more granular analysis taking and grading each disease independently might identify specific diseases or clusters of diseases. This would be a logical extension of a heat map approach and would need integrating clustering and false discovery reduction algorithms to compensate for the number of diseases analyzed. Our trial was also relatively small and may have lacked the power of detecting mild to moderate associations. Another possible explanation is that diseases come with associated medications (e.g. metformin, aspirin, immune treatments) which may confound further their overall impact. Finally, rather than specific diseases, the somatic response to them might be the key driver, and assessment of biologic vulnerability factors, such as inflammatory cytokines, might have a better correlation with toxicity and hospitalization. Further mitigation factors such as social support likely play a role in influencing unplanned hospitalization rates.
The most common comorbidities in our study were vascular, eye/ear/nose/throat, respiratory and endocrine/ metabolic/ breast disease. Similar findings, according to the CCI, were found in the Danish elderly population-based study. In the latter, vascular, cardiopulmonary, ulcer disease and diabetes had the higher prevalence in patients with colorectal cancer than in controls [7]. Several other studies had results similar to ours
In conclusion, the number of CIRS-G score 4 diseases and TRS of patients with rectal cancer were associated with worse OS but no specific CIRS-G category was individually associated with OS in older patients with metastatic colorectal cancer treated with chemotherapy. Our approach identified no association of comorbidity with toxicity from chemotherapy or unplanned hospitalizations in these patients. Future research projects may have to account for diseases more individually and include assessment of medications and biologic markers.
Acknowledgements
This work was supported by a grant from Research year of Inje University in 2016 (20160042). and National Cancer Institute grant P30-CA076292 (NCI Comprehensive Cancer Core grant: Moffitt Cancer Center Biostatistics Core).
Footnotes
Publisher's Disclaimer: This is a PDF file of an unedited manuscript that has been accepted for publication. As a service to our customers we are providing this early version of the manuscript. The manuscript will undergo copyediting, typesetting, and review of the resulting proof before it is published in its final citable form. Please note that during the production process errors may be discovered which could affect the content, and all legal disclaimers that apply to the journal pertain.
conflicts of interest
There are no conflicts of interest disclosures from any authors.
References
- 1.Extermann M, et al. , Comorbidity and functional status are independent in older cancer patients. Journal of Clinical Oncology, 1998. 16(4): p. 1582–1587. [DOI] [PubMed] [Google Scholar]
- 2.Balducci L, Perspectives on quality of life of older patients with cancer. Drugs Aging, 1994. 4(4): p. 313–24. [DOI] [PubMed] [Google Scholar]
- 3.Weitzner MA, Haley WE, and Chen H, The family caregiver of the older cancer patient. Hematol Oncol Clin North Am, 2000. 14(1): p. 269–81. [DOI] [PubMed] [Google Scholar]
- 4.Balducci L and Extermann M, Cancer and aging. An evolving panorama. Hematol Oncol Clin North Am, 2000. 14(1): p. 1–16. [DOI] [PubMed] [Google Scholar]
- 5.Sogaard M, et al. , The impact of comorbidity on cancer survival: a review. Clin Epidemiol, 2013. 5(Suppl 1): p. 3–29. [DOI] [PMC free article] [PubMed] [Google Scholar]
- 6.Asmis T, et al. , Comorbidity, age and overall survival in cetuximab-treated patients with advanced colorectal cancer (ACRC)—results from NCIC CTG CO. 17: a phase III trial of cetuximab versus best supportive care. Annals of Oncology, 2010: p. mdq309. [DOI] [PubMed]
- 7.Jørgensen T, et al. , Comorbidity in elderly cancer patients in relation to overall and cancer-specific mortality. British journal of cancer, 2012. 106(7): p. 1353–1360. [DOI] [PMC free article] [PubMed] [Google Scholar]
- 8. Erichsen R, et al., Does comorbidity interact with colorectal cancer to increase mortality? A nationwide population-based cohort study. British journal of cancer, 2013. 109(7): p. 2005–2013. [DOI] [PMC free article] [PubMed] [Google Scholar]
- 9.Ostenfeld EB, et al. , Comorbidity and survival of Danish patients with colon and rectal cancer from 2000–2011: a population-based cohort study. Clinical epidemiology, 2013. 5(Suppl 1): p. 65. [DOI] [PMC free article] [PubMed] [Google Scholar]
- 10.Driver JA, et al. , Chronic disease in men with newly diagnosed cancer: a nested case-control study. American journal of epidemiology, 2010. 172(3): p. 299–308. [DOI] [PMC free article] [PubMed] [Google Scholar]
- 11.Colinet B, et al. , A new simplified comorbidity score as a prognostic factor in non-small-cell lung cancer patients: description and comparison with the Charlson’s index. British journal of cancer, 2005. 93(10): p. 1098–1105. [DOI] [PMC free article] [PubMed] [Google Scholar]
- 12.Piccirillo JF, et al. , Development of a new head and neck cancer–specific comorbidity index. Archives of Otolaryngology–Head & Neck Surgery, 2002. 128(10): p. 1172–1179. [DOI] [PubMed] [Google Scholar]
- 13.Sorror ML, et al. , Hematopoietic cell transplantation (HCT)-specific comorbidity index: a new tool for risk assessment before allogeneic HCT. Blood, 2005. 106(8): p. 2912–2919. [DOI] [PMC free article] [PubMed] [Google Scholar]
- 14.Extermann M, Measuring comorbidity in older cancer patients. Eur J Cancer, 2000. 36(4): p. 453–71. [DOI] [PubMed] [Google Scholar]
- 15.Kirkhus L, et al. , Comparing comorbidity scales: Attending physician score versus the Cumulative Illness Rating Scale for Geriatrics. Journal of geriatric oncology, 2016. 7(2): p. 90–98. [DOI] [PubMed] [Google Scholar]
- 16.Extermann M, et al. , Comorbidity and functional status are independent in older cancer patients. J Clin Oncol, 1998. 16(4): p. 1582–7. [DOI] [PubMed] [Google Scholar]
- 17.Hassett MJ, et al. , Chemotherapy-related hospitalization among community cancer center patients. The oncologist, 2011. 16(3): p. 378–387. [DOI] [PMC free article] [PubMed] [Google Scholar]
- 18.Grønberg BH, et al. , Influence of comorbidity on survival, toxicity and health-related quality of life in patients with advanced non-small-cell lung cancer receiving platinum-doublet chemotherapy. European journal of cancer, 2010. 46(12): p. 2225–2234. [DOI] [PubMed] [Google Scholar]
- 19.Jorgensen TL, et al. , Comorbidity in elderly cancer patients in relation to overall and cancer-specific mortality. Br J Cancer, 2012. 106(7): p. 1353–60. [DOI] [PMC free article] [PubMed] [Google Scholar]
- 20.Lee JJ, et al. , Using heat maps to assess the multidimensional association of comorbidities with survival in older cancer patients treated with chemotherapy. J Geriatr Oncol, 2017. 8(5): p. 336–342. [DOI] [PMC free article] [PubMed] [Google Scholar]
- 21.Kim K, Zhou JM, Kim J, Sehovic M, Extermann M., Using Heat Maps to assess multidimensional association of comorbidities with survival in elderly lung adenocarcinoma patients treated with chemotherapy J Geriatr Oncol, 2017. 8(S1): p. S83. [DOI] [PMC free article] [PubMed] [Google Scholar]
- 22.Wilkinson L, Friendly M, The History of the Cluster Heat Map. The American Statistician, 2009. 63(2): p. 179–184. [Google Scholar]
- 23.Miller MD, et al. , Rating chronic medical illness burden in geropsychiatric practice and research: application of the Cumulative Illness Rating Scale. Psychiatry Res, 1992. 41(3): p. 237–48. [DOI] [PubMed] [Google Scholar]
- 24.Extermann M, et al. , Predictors of tolerance to chemotherapy in older cancer patients: a prospective pilot study. Eur J Cancer, 2002. 38(11): p. 1466–73. [DOI] [PubMed] [Google Scholar]
- 25.Extermann M, et al. , A comprehensive geriatric intervention detects multiple problems in older breast cancer patients. Crit Rev Oncol Hematol, 2004. 49(1): p. 69–75. [DOI] [PubMed] [Google Scholar]
- 26.van Eeghen EE, et al. , Impact of age and comorbidity on survival in colorectal cancer. J Gastrointest Oncol, 2015. 6(6): p. 605–12. [DOI] [PMC free article] [PubMed] [Google Scholar]
- 27.Extermann M, Reich RR, and Sehovic M, Chemotoxicity recurrence in older patients: Risk factors and effectiveness of preventive strategies-a prospective study. Cancer, 2015. 121(17): p. 2984–92. [DOI] [PMC free article] [PubMed] [Google Scholar]
- 28.Extermann M, et al. , Predicting the risk of chemotherapy toxicity in older patients: the Chemotherapy Risk Assessment Scale for High-Age Patients (CRASH) score. Cancer, 2012. 118(13): p. 3377–86. [DOI] [PubMed] [Google Scholar]
- 29.Hurria A, et al. , Predicting chemotherapy toxicity in older adults with cancer: a prospective multicenter study. Journal of clinical oncology : official journal of the American Society of Clinical Oncology, 2011. 29(25): p. 3457–65. [DOI] [PMC free article] [PubMed] [Google Scholar]


