Abstract
Purpose:
Intravitreal injections acutely and temporarily increase intraocular pressure (IOP), and this may have cumulative long-term effects including an increased risk for glaucoma surgery. This study was designed to measure retinal perfusion density changes on OCT angiography (OCT-A) and thickness alterations associated with acutely increased IOP following intravitreal injections.
Methods:
Retrospective observational clinical study of 40 eyes (39 patients) with various retinopathies from October 2016-June 2017 at a tertiary care retina clinic in NYC. Patients were over age 18, with vision >20/100, able to fixate and without media opacities precluding OCT-A, receiving intravitreal bevacizumab or aflibercept for diabetic retinopathy, retinal vein occlusion, macular degeneration, retinal neovascularization, or radiation retinopathy. 3×3mm macular and 4.5×4.5mm peripapillary OCT-A perfusion density, macular OCT thickness, and IOP were measured before and immediately following intravitreal injections. Paired t test was used to compare pre- and post-injection values for perfusion density and OCT thickness. Regression analysis was performed for potential effects of baseline IOP, IOP change, and age.
Results:
Statistically significant decreases in angiographic perfusion density (p<0.05) were found in most areas of the superficial and deep layer macular OCT-A, and the overall optic nerve head and the radial peripapillary capillary (RPC) layer, preferentially temporal. Macular OCT thickness was significantly decreased in the temporal region and increased in the nasal region. Regression analysis showed relationships between age and decreased superficial macular perfusion. Pre-injection IOP was only related to OCT thickness in the fovea. IOP change was related only to decreased superficial macular perfusion density.
Conclusions:
Intravitreal injections produce acute IOP changes which are associated with reduced macular and peripapillary perfusion density. Therefore, it is possible that patients receiving regular intravitreal injections may be sustaining perfusion-related injury to ocular structures that may produce glaucomatous damage to the macula and optic nerve.
Keywords: Glaucoma, Intravitreal injections, Macula, OCT Angiography, Perfusion density
Summary Statement:
Intravitreal injections produce acute IOP changes which are associated with reduced macular and peripapillary perfusion density. Therefore, it is possible that patients receiving regular intravitreal injections may be sustaining perfusion-related injury to ocular structures that may produce glaucomatous damage to the macula and optic nerve.
Introduction:
Intravitreal injections have become a therapeutic mainstay in many eye diseases including diabetic retinopathy, retinal vein occlusions, and macular degeneration. In 2012, over 2.3 million intravitreal injections were performed in the USA, projected to increase to over 6 million injections in 2016.1
While each injection acutely and temporarily increases intraocular pressure (IOP), the cumulative long-term effects of these changes are not well studied.2 Recently, Eadle et al. showed that 7 or more intravitreal injections annually are associated with an increased risk for glaucoma surgery.3 We sought to evaluate acute changes in macular and peripapillary perfusion density and macular OCT thickness following intravitreal injections using optical coherence tomography angiography (OCT-A) and OCT structural imaging, to better understand retinal perfusion changes and thickness alterations that are associated with acute elevations in IOP. An understanding of the pathophysiology of injections may shed light on other instances of acute IOP elevation, such as those in acute angle closure or during intraocular surgery.
Methods
Forty eyes of 39 patients over age 18, with vision better than 20/100, and without media opacities or other ocular changes precluding OCT-A, were retrospectively enrolled. This study was approved by our institutional review board and adhered to the tenets of the Declaration of Helsinki. Each patient received intravitreal bevacizumab or aflibercept injections for diabetic retinopathy, macular degeneration, choroidal neovascular membrane, retinal vein occlusion, or radiation retinopathy. Injections of 0.05mL bevacizumab (1.25mg) were given to 32 eyes, 0.05mL aflibercept (2mg) to 3 eyes, and 0.1mL bevacizumab (2.50mg) to 5 eyes with radiation retinopathy. Intraocular pressures were checked with Tonopen (Reichert, Depew, New York, USA) prior to and immediately after injection.
All patients had macular and peripapillary OCT-A performed before and immediately after injections (within 3 minutes in all cases – as quickly as the patient could be transferred from the injection procedure room to the imaging suite) using the RTVue XR 100 Avanti (Optovue Inc., Fremont, CA, USA). For each patient, 3×3mm scans centered on the fovea and 4.5×4.5 mm scans centered on the optic nerve were acquired. IOP was measured immediately (approximately 15 seconds) after injection.
OCTA imaging:
Macular scans were segmented into superficial and deep OCT-A layers. The OCT system’s AngioAnalytics software (Optovue Inc., Fremont, CA, USA) performs automatic segmentation of vessel layers. Conventional automatic segmentation based on OCT intensity image volume was used to identify retinal tissue layers. In this article, the superficial plexus consists of the capillaries between the inner limiting membrane (ILM) and 16um betlow the posterior boundary of the inner plexiform layer (IPL) (including the nerve fiber layer and the ganglion cell layer). The deep plexus consists of the capillaries between the posterior boundary of the IPL and 69um below the posterior boundary of the outer plexiform layer (OPL) (including inner nuclear layer) (Figure 1).
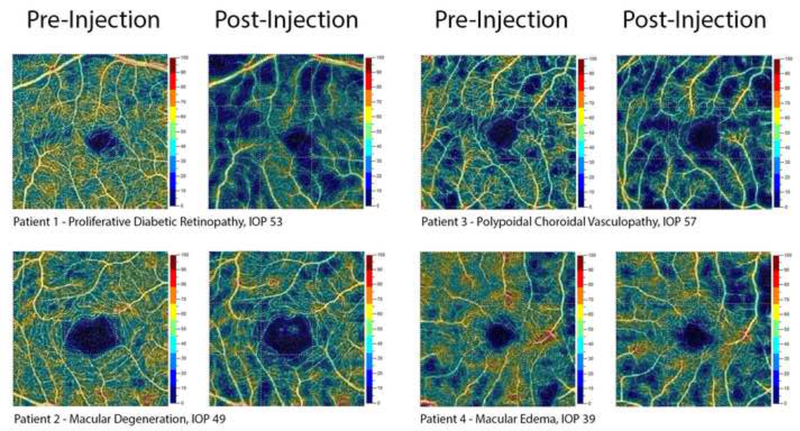
Figure 1:
Representative samples of superficial macular OCT Angiography pre-and post-injection.
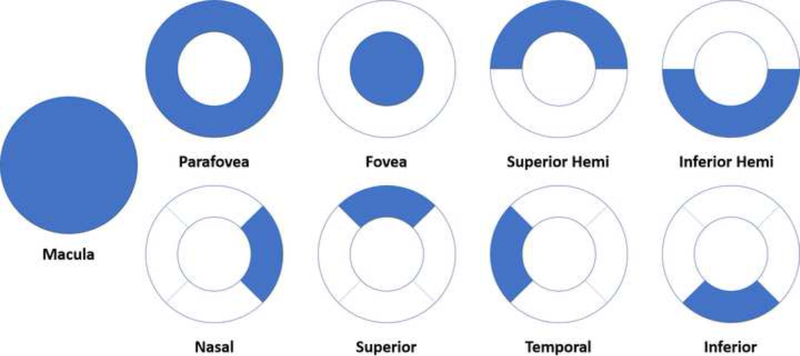
Each macular OCT-A layer was subdivided into 9 regions of interest – macula, fovea, parafovea, superior hemifield, inferior hemifield, temporal, superior, nasal, and inferior (Figure 3) for quantitative measurements of perfusion density (%). Qualitative retinal capillary perfusion density color maps are generated for each capillary layer using an assigned color scale where bright red represents a density of greater than 50% perfused vessels, dark blue represents minimal or no perfused vessels, and intermediate perfusion densities are color coded yellow to green accordingly.
Figure 3:
Description of the measured aspects of the 3 × 3mm macular scans
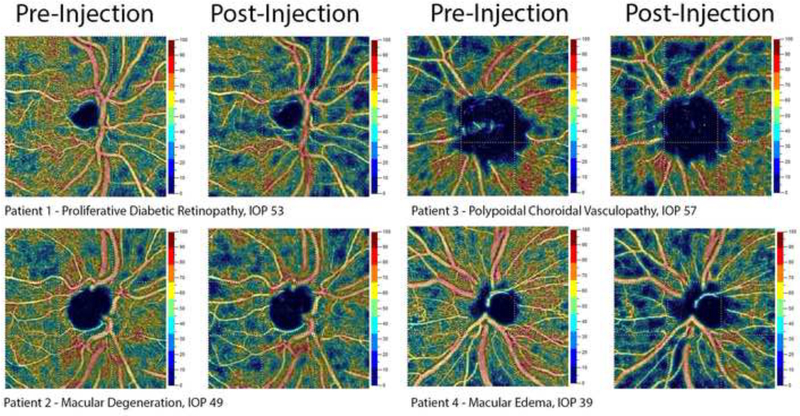
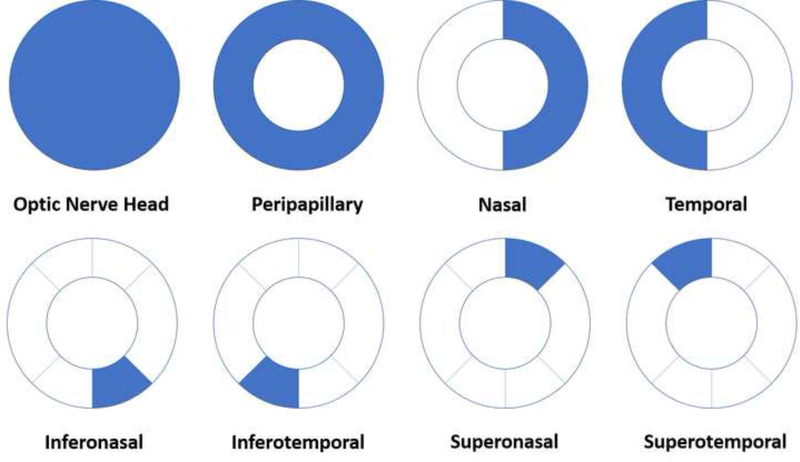
Peripapillary scans were segmented into optic nerve head layer, between the ILM and 150-um below, and radial peripapillary capillary (RPC) layer, between the posterior boundary of the RNFL and the ILM (Figure 2). Each peripapillary OCT-A scan was then subdivided into 8 regions of interest – optic nerve head, peripapillary, nasal, temporal, inferonasal, inferotemporal, superotemporal, and superonasal (Figure 4). Changes in macular thickness were also measured.
Figure 2:
Representative samples of peripapillary OCT Angiography pre- and post-injection.
Figure 4:
Description of the measured aspects of the peripapillary 4.5 × 4.5mm scans
Statistical analysis:
Paired t-tests were used to analyze each patient’s pre- and post-injection OCT-A perfusion density and macular OCT thickness and calculate the mean difference in each measured segment and the 95% confidence interval of this difference, reported below. Regression analysis was performed using the patient’s age, baseline IOP, and IOP change as independent variables (the dependent variable being the difference (pre-post)). All calculations were performed in STATA (v14.2, StataCorp, College Station, TX). P values less than 0.05 were considered statistically significant.
Results:
40 eyes of 39 patients over age 18 (Mean 60.6 years, Std. Deviation 11.82) were studied (Table 1). The distribution of diseases studied can be seen in Table 2. In 5 eyes, peripapillary scans were of insufficient quality post-injection, and thus only 35 measurements were available for analysis.
Table 1:
Patient Characteristics: Age and IOP
| Minimum | Maximum | Mean | Standard Deviation | |
|---|---|---|---|---|
| Age (years) | 33 | 84 | 60.6 | 11.82 |
| Pre-IOP (mm Hg) | 8 | 25 | 17.15 | 3.01 |
| Post-IOP (mm Hg) | 22 | 72 | 46.35 | 12.15 |
| IOP Change (mm Hg) | 3 | 56 | 29.2 | 12.68 |
Table 2:
Patient Characteristics: Underlying Disease Process
| Disease | Number of Patients |
|---|---|
| PDR | 9 |
| AMD/IPCV | 8 |
| HRVO/CRVO | 6 |
| Radiation Retinopathy | 5 |
| NPDR with CME | 5 |
| BRVO | 3 |
| Other | 3 |
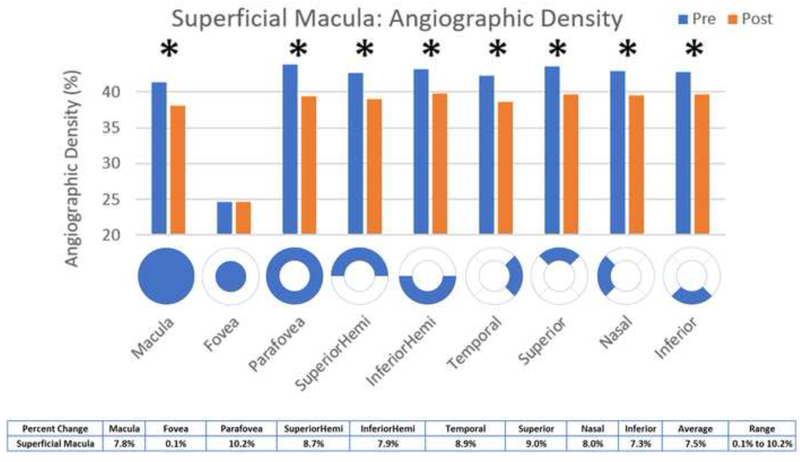
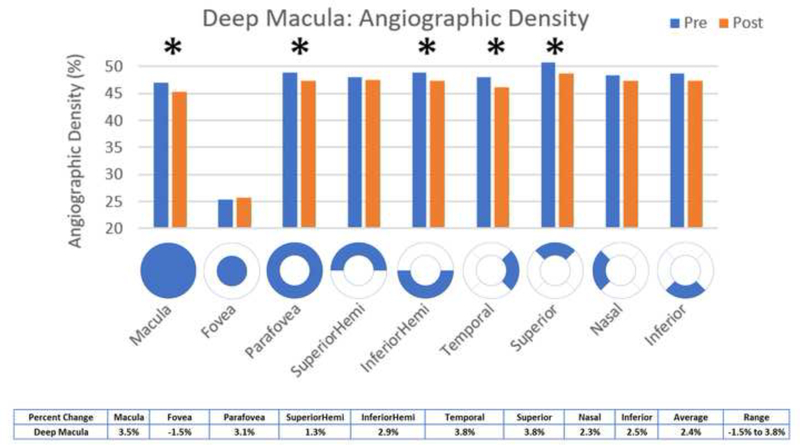
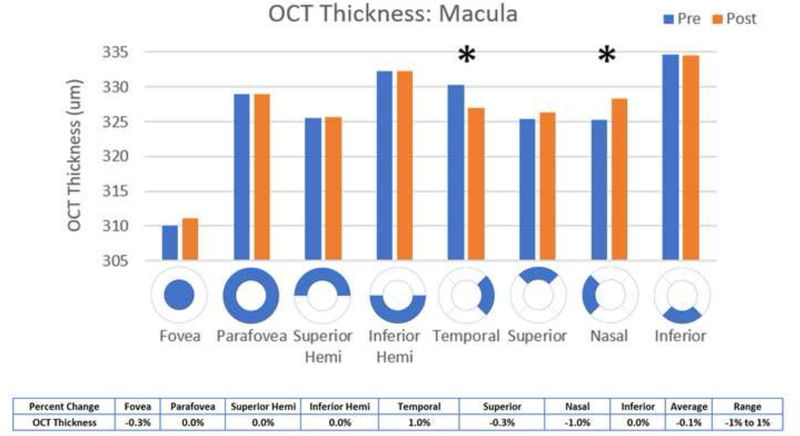
Statistically significant decreases in OCT angiographic perfusion density (p<0.05) were present in all superficial 3×3 macular scan aspects except the fovea, with an average change of 7.5% in the superficial macula (Figure 5). Changes were seen in the macula (mean difference 3.22, p <0.001), parafovea (mean difference 4.47, p = 0.0008), superior hemifield (mean difference 3.73, p < 0.001), inferior hemifield (mean difference 3.41, p = 0.001), temporal (mean difference 3.76, p < 0.001), superior (mean difference 3.91, p = 0.001), nasal (mean difference 3.44, p = 0.001), and inferior (mean difference 3.14, p = 0.007). All deep 3×3 macular scan aspects had significantly decreased perfusion except for the superior hemifield, inferior and nasal aspects and the fovea, with an average change of 2.4% in the deep macula (Figure 6). Changes were seen in the macula (mean difference 1.64, p = 0.0105), parafovea (mean difference 1.52, p = 0.0219), inferior hemifield (mean difference 1.41, p = 0.0384), temporal (mean difference 1.8, p=0.0198), and superior (mean difference 1.92, p = 0.0463). Macular thickness was significantly decreased in the temporal aspect (mean difference 3.25, p = 0.0371) and significantly increased in the nasal aspect (mean difference −3.1, p=0.0312) (Figure 9).
Figure 5:
Comparison of pre- and post-injection superficial macular angiographic density
Figure 6:
Comparison of pre- and post-injection deep macular angiographic density
Figure 9:
Comparison of pre- and post-injection macular OCT thickness
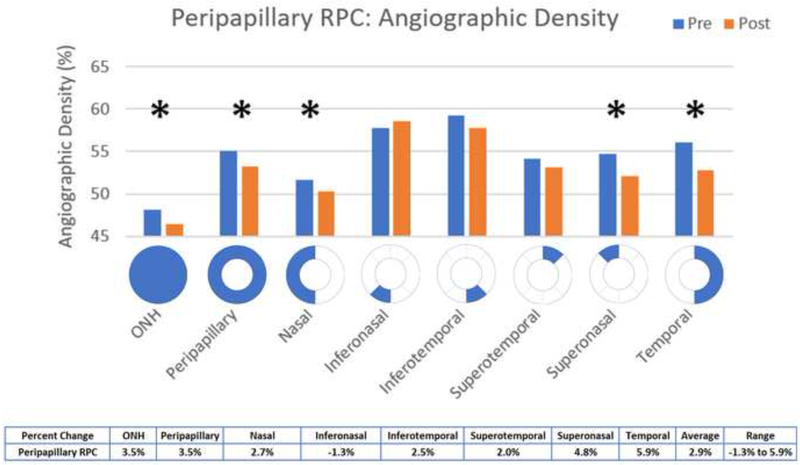
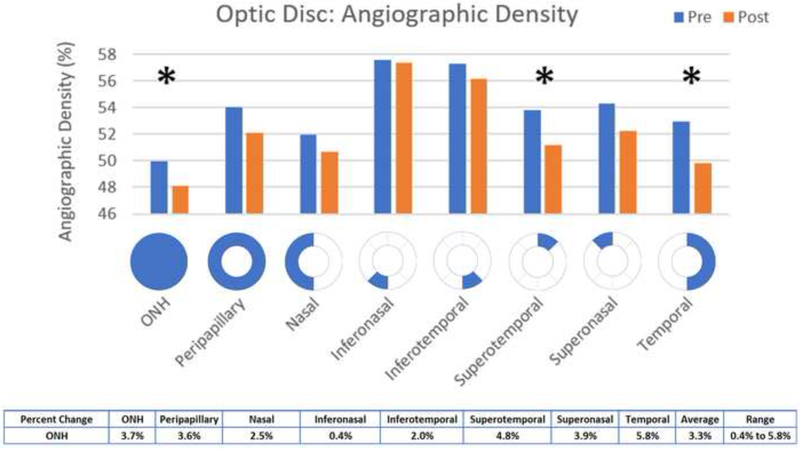
Statistically significant decreases in angiographic perfusion density (p<0.05) occurred in the overall optic nerve head (mean difference 1.83, p = 0.0479) and the temporal (mean difference 3.09, p = 0.0263) and superotemporal (mean difference 2.1, p = 0.0484) aspects, with an average change of 3.3% in the optic nerve head (Figure 7). In the RPC, the overall optic nerve head (mean difference 1.68, p = 0.0266), peripapillary (mean difference 1.91, p = 0.0418), superonasal (mean difference 2.63, p = 0.0262), and temporal (mean difference 3.3, p = 0.0075) aspects were significantly decreased, with an average change of 2.9% in the peripapillary RPC (Figure 8).
Figure 7:
Comparison of pre- and post-injection RPC angiographic density
Figure 8:
Comparison of pre- and post-injection Optic Nerve angiographic density
In regression analyses, age was significantly related to overall superficial macular perfusion (coefficient 0.111, p = 0.018), and the following superficial subdivisions: parafovea (coefficient - 0.1333, p = 0.024), superior (coefficient 0.122, p = 0.032) and inferior (coefficient 0.116, p = 0.028) hemifields, nasal (coefficient 0.178, p = 0.002), and temporal (coefficient 0.133, p = 0.018). Age did not relate to RPC/optic nerve perfusion, deep macular perfusion, nor with any changes in macular thickness.
In regression analyses, initial IOP was not correlated with changes in optic nerve or RPC perfusion, nor with superficial or deep macular perfusion on 3×3 scans. Initial IOP was related to changes in OCT thickness in the fovea only (coefficient 1.314, p = 0.025).
In regression analyses, IOP change related to decreased overall superficial macular perfusion (coefficient −0.0976, p = 0.034) as well as the following subdivisions: parafoveal (coefficient −0.133, p = 0.024), superior hemifield (coefficient −0.147, p = 0.009), temporal (coefficient −0.109, p = 0.047), superior (coefficient −0.139, p = 0.043), and nasal (coefficient −0.108, p = 0.041). IOP change did not relate to changes in RPC/optic nerve or deep macular perfusion.
Conclusions:
OCT Angiography enables in-vivo, high-resolution, quantitative, dye-free imaging of vascular perfusion to be achieved by employing motion contrast processing and is able to provide 3-dimensional maps of the retinal and choroidal microcirculation.4,5
Only perfused vessels show up on the angiogram, as those without flow will not demonstrate any movement of blood cells necessary for motion contrast detection. The software displays the OCT angiogram data for each layer into a qualitative color map and provides quantitative data for capillary perfusion density analysis. Optical coherence tomography angiogram images are analyzed to assess the percentage of each area unit which displays motion. Regions with higher capillary density are considered areas with increased flow.
OCT-A has been used to image vascular changes in diabetic retinopathy, retinal vascular occlusions, retinitis pigmentosa, glaucoma, polypoidal choroidal vasculopathy, and macular degeneration.4,5 Several studies have also demonstrated its value in measurement of peripapillary angiographic perfusion density and proposed its use for diagnosis and quantification of glaucoma prior to RNFL thickness changes or visual field losses.6,7 In one study, OCT-A perfused capillary density showed diagnostic accuracy comparable to RNFL thickness measurements for differentiating between healthy and glaucomatous eyes.6 These results suggest that OCT-A measurements identify early damage to tissues which my contribute to the pathophysiology of glaucoma. Similar studies are ongoing for other diseases including optic nerve edema, ischemic optic neuropathy, diabetic retinopathy, and retinal vein occlusions.4,5
In this study, we measured the acute alterations in microvascular perfusion density and macular thickness changes using OCT Angiography associated with increased IOP due to intravitreal anti-VEGF injection. We found that superficial macular vessels preferentially had significantly decreased perfusion, on average 7.5%, immediately following injection as compared with deep vessels, though both were affected. This reduction in angiographic perfusion density that is associated with increased IOP likely contributes to the acute decrease in visual acuity experienced immediately after injections. Patients typically regain vision, as the IOP decreases toward normal and blood flow returns to the macula.
Recently, Takusagawa et. al showed that patients with glaucoma have significantly decreased perfusion in the macula on OCT-A, affecting superficial plexes more than deep.8 These changes match with the acute perfusion effects of intravitreal injections, where the average percent change was only one third in the deep macular vasculature as compared with the superficial, and it is possible that we are seeing the ischemic effects of increased IOP. This lends credence to the idea that intravitreal injections may stress the same structures that get damaged in glaucomatous eyes.
OCT thickness increased significantly in the nasal aspect of the macula and decreased in the temporal aspect of the macula. This may be due to redistribution of fluid or fluid shifts that occur with pressure changes.
In the peripapillary area, OCTA perfusion density was significantly different in both the optic nerve and RPC scans, with an average percent change of 3.3% in the ONH and 2.9% in the peripapillary RPC, and in both scans the temporal aspect of the nerve was affected. These results agree with several other studies9, including a study by Hollo G, et al. in which peripapillary superficial capillary perfusion density was significantly increased with an IOP reduction of 50% or more (over a period of approximately 1 month).10 Falavarajni et al. found that retinal capillary perfusion density measured 1 month after injection of anti-VEGF was unchanged,11 suggesting that changes like those measured in our study are short term effects more likely to be IOP related than medication related. This study also agrees with other reports that overall OCT thickness does not change significantly following acute IOP elevation due to intravitreal injections.11
In the current study, OCT-A was used to measure acute macular and peripapillary changes in both OCT thickness and perfusion density resulting from intravitreal injections. The IOP measurements were taken approximately 15 seconds after injection, whereas the OCT-A imaging followed approximately 2 minutes thereafter. As a result, angiographic changes likely correlate to elevated intraocular pressures already in the process of equilibration. While our acute pressure readings in the sampled patients averaged 50mmHg, it has been shown that IOP decreases to 35mmHg 2–3 minutes post-injection, and back to a baseline of 15mmHg within 30 minutes.2 In a small pilot study in our clinic, we measured the IOP of 10 patients 30 seconds, 90 seconds, and 180 seconds after injection and found similar results. The mean IOP was 44.5mmHg at 30 seconds, 36.8mmHg at 90 seconds, and 32.3mmHg at 180 seconds. Quite possibly, if the OCT-A images had been taken closer to the time of injection, they may have shown even greater changes in perfusion density or OCT thickness.
It is important to note that while IOP rises to such high pressures immediately upon injection, the pressures are not sustained. A major risk stems from the repeating nature of such injections and the potential of cumulative trauma to the retina and optic nerve.3 The sectoral changes we see around the optic nerve may indicate areas more susceptible to glaucomatous damage from repeated spikes in IOP due to injections. These areas of the RNFL, especially the temporal aspect, may be more at risk to damage and should be preferentially monitored for evidence of early RNFL thinning following intravitreal injections. Ganglion cells which rely on perfusion of the superficial macular plexus may be especially vulnerable.
Larger, long-term studies will be helpful to identify glaucomatous changes in patients who undergo repeated injections. Perhaps we should consider pre-treating all or a subset of patients most susceptible to injury with IOP lowering medications. The impact of greater injection volumes, such as those given 0.1 mL bevacizumab for radiation retinopathy or those receiving 0.1mL Triamcinolone needs further investigation. In our study, the sample size of patients that received 0.1mL injections was small, and even though mean IOP in these patients was higher after injection, it is difficult to draw any conclusions given the limited number of patients receiving this dose.
Our study population was heterogeneous with regard to diagnosis, age, and other patient and disease characteristics. The patient population may have contained individuals with undiagnosed glaucoma or other changes that may skew the data. The effects of intravitreal injections in each disease state or patient may vary, and may affect the outcomes we measured. However, all patients were used as their own controls, and the changes that occur within each individual patient correlated well with our overall results. Future studies of larger patient populations will be helpful to confirm that these changes are real and reproducible.
As with all studies involving OCT-A, image artifacts such as segmentation and motion artifacts may influence outcomes. In its current state of development, OCT-A is more prone to motion artifacts than fluorescein angiography or indocyanine green angiography.12 Artifacts on OCT-A include segmentation errors, motion artifacts, projection artifacts of vessels onto deeper layers, unmasking of deeper layers similar to window defects in fluorescein angiography, as well as blink, stretching, and banding. Failure to recognize artifacts may lead to incorrect diagnosis and treatment, and artifacts are typically more prevalent in eyes with retinal or choroidal pathology than in normal control eyes. In one study, 89.4% of patients had an artifact: the most common artifacts were banding (89.4%), segmentation (61.4%), and motion (49.1%). However, in only 17.6% of patients did these artifacts preclude identification of the foveal avascular zone, choroidal neovascular membrane borders, or area of nonperfusion - three key assessments used in OCT-A. 12 In our patients with retinal pathology, it is possible that artefactual changes simulated effects that were not real. Though we attempted to correct for segmentation artifacts and excluded eyes with poor quality scans, this is still a potential issue.
In conclusion, intravitreal injections induce acute changes in IOP and retinal angiographic perfusion density. This preliminary study of 40 eyes shows that the superficial layers of the macula are more affected than deep layers by these changes, and that temporal OCT thickness decreases and nasal OCT thickness increases acutely after injections. These alterations may explain the sudden change in vision patients have immediately post-injection, and relate to changes in macular perfusion seen in glaucomatous eyes.8 Additionally, there are significant perfusion decreases preferentially in the temporal area of the optic nerve, that are not related to age, initial IOP, nor IOP change during injection. Given these peripapillary changes, it may be prudent to follow these temporal areas with serial perfusion scans, RNFL measurements, and visual fields to assess the effects of our intravitreal injections. These changes need to be researched further with larger sample sizes and with longitudinal data about glaucoma progression.
Longer studies are necessary to ensure intravitreal injections are not inflicting damage due to repeated pressure spikes, as there is already evidence that greater injection exposure correlates with increased need for glaucoma surgery.3 These studies will also provide some window into the pathophysiology of perfusion change that occur during other instances of acute IOP elevations such as acute angle closure, malignant glaucoma, and during intraocular surgery and help point to more effective therapeutic interventions.
Acknowledgments
Grant Information:
This study was supported by the National Eye Institute of the National Institutes of Health under award number R01EY027301. The content is solely the responsibility of the authors and does not necessarily represent the official views of the National Institutes of Health. Additional funding for this research was provided by the Marrus Family Foundation, and the Geraldine Violett Foundation. The sponsors and funding organizations had no role in the design or conduct of this research.
This research was performed at the New York Eye and Ear Infirmary of Mount Sinai, NY, NY USA. The authors have not published or submitted any related papers from the same study.
Footnotes
Commercial Relationship(s):
Richard B. Rosen: OptoVue: Code C (Consultant); Boehringer-Ingelheim: Code C (Consultant); Astellas: Code C; Genentech-Roche: Code C; NanoRetina: Code C; OD-OS: Code C; Opticology: Code I (Personal Financial Interest); Guardion: Code I (Personal Financial Interest); GlaucoHealth: Code I (Personal Financial Interest); Regeneron: Code C; Bayer: Code C;
Toco YP Chui: None
Alexander Barash: None
Patricia Garcia: None
References:
- 1.Williams G IVT Injections: Health Policy Implications. Review of Ophthalmology 2014.
- 2.Lee JW, Park H, Choi JH, et al. Short-term changes of intraocular pressure and ocular perfusion pressure after intravitreal injection of bevacizumab or ranibizumab. BMC Ophthalmol 2016;16:69. [DOI] [PMC free article] [PubMed] [Google Scholar]
- 3.Eadie BD, Etminan M, Carleton BC, Maberley DA, Mikelberg FS. Association of Repeated Intravitreous Bevacizumab Injections With Risk for Glaucoma Surgery. JAMA Ophthalmol 2017;135(4):363–368. [DOI] [PMC free article] [PubMed] [Google Scholar]
- 4.Chen CL, Wang RK. Optical coherence tomography based angiography [Invited]. Biomed Opt Express 2017;8(2):1056–1082. [DOI] [PMC free article] [PubMed] [Google Scholar]
- 5.de Carlo TE, Romano A, Waheed NK, Duker JS. A review of optical coherence tomography angiography (OCTA). Int J Retina Vitreous 2015;1:5. [DOI] [PMC free article] [PubMed] [Google Scholar]
- 6.Yarmohammadi A, Zangwill LM, Diniz-Filho A, et al. Optical Coherence Tomography Angiography Vessel Density in Healthy, Glaucoma Suspect, and Glaucoma Eyes. Invest Ophthalmol Vis Sci 2016;57(9):OCT451–459. [DOI] [PMC free article] [PubMed] [Google Scholar]
- 7.Shin JW, Lee J, Kwon J, Choi J, Kook MS. Regional vascular density-visual field sensitivity relationship in glaucoma according to disease severity. Br J Ophthalmol 2017. [DOI] [PubMed]
- 8.Takusagawa HL, Liu L, Ma KN, et al. Projection-Resolved Optical Coherence Tomography Angiography of Macular Retinal Circulation in Glaucoma. Ophthalmology 2017;124(11):1589–1599. [DOI] [PMC free article] [PubMed] [Google Scholar]
- 9.Schmidl D, Boltz A, Kaya S, et al. Comparison of choroidal and optic nerve head blood flow regulation during changes in ocular perfusion pressure. Invest Ophthalmol Vis Sci 2012;53(8):4337–4346. [DOI] [PubMed] [Google Scholar]
- 10.Hollo G Influence of Large Intraocular Pressure Reduction on Peripapillary OCT Vessel Density in Ocular Hypertensive and Glaucoma Eyes. J Glaucoma 2017;26(1):e7–e10. [DOI] [PubMed] [Google Scholar]
- 11.Ghasemi Falavarjani K, Iafe NA, Hubschman JP, Tsui I, Sadda SR, Sarraf D. Optical Coherence Tomography Angiography Analysis of the Foveal Avascular Zone and Macular Vessel Density After Anti-VEGF Therapy in Eyes With Diabetic Macular Edema and Retinal Vein Occlusion. Invest Ophthalmol Vis Sci 2017;58(1):30–34. [DOI] [PubMed] [Google Scholar]
- 12.Ghasemi Falavarjani K, Al-Sheikh M, Akil H, Sadda SR. Image artefacts in swept-source optical coherence tomography angiography. Br J Ophthalmol 2017;101(5):564–568. [DOI] [PubMed] [Google Scholar]


