Abstract
Cytokine dysregulation is a central driver of chronic inflammatory diseases such as multiple sclerosis (MS). Here we sought to determine the characteristic cellular and cytokine polarization profile in patients with relapsing-remitting multiple sclerosis (RRMS) by high-dimensional single-cell mass cytometry (CyTOF). Using a combination of neural network-based representation learning algorithms, we identified an expanded T helper cell subset in MS patients, characterized by the expression of GM-CSF and the C-X-C chemokine receptor type 4. This cellular signature, which includes expression of very late antigen 4 (VLA4) in peripheral blood, was also enriched in the central nervous system of RRMS patients. In independent validation cohorts, we confirmed that this cell population is increased in MS patients compared to other inflammatory and non-inflammatory conditions. Lastly, we also found the population to be reduced under effective disease-modifying therapy, suggesting that the identified T cell profile represents a specific therapeutic target in MS.
Introduction
MS is a chronic inflammatory disease characterized by periodic infiltration of blood-derived leukocytes into the central nervous system (CNS) leading to damage of neuronal connections and progressive disability (1). Given the complexity of MS, there is a long-standing interest in identifying biomarkers and signatures from easily accessible, liquid biopsy material (blood). Numerous immune cell types including T cells, B cells, natural killer (NK) cells as well as myeloid cells together with their associated cytokine production have been implicated in the pathophysiology of MS (2–4). More specifically, while reduced regulatory T (Treg) cell function (5), increased frequencies of type-1 Th (Th1) cells (6, 7) and Th17 (8) or GM-CSF-secreting effector T cells (9, 10) have been reported in MS, the precise contribution of the different Th subsets is still controversial. One reason for the lack of solid biomarkers in PBMCs of MS patients is likely to be the hypothesis-driven nature of the investigations, which are inherently limited in their overall resolution and thus may bias the investigation toward arbitrarily classified cell subsets and biomarkers. High-parametric single-cell analysis (11–13) combined with automated computational tools (14–18) now provide a unique opportunity to comprehensively describe the peripheral immune compartment of patients with autoimmune diseases in an unbiased manner (13, 19, 20).
Here, we deeply analyzed PBMC samples from independent cohorts of MS patients by mass cytometry in conjunction with unsupervised neural network (FlowSOM) and supervised representation learning (CellCNN) approaches. This allowed the convergent identification of a specific Th-cell signature in MS, characterized by the expression of GM-CSF, tumor necrosis factor (TNF), interferon gamma (IFN- γ), interleukin 2 (IL-2) and C-X-C chemokine receptor type 4 (CXCR4). Of note, we here show that this signature is dramatically reduced upon disease-modifying therapy, namely dimethyl fumarate (DMF). Finally, we identify an enrichment of this signature population in the CNS of MS patients, highlighting its potential contribution to MS pathophysiology.
Results
Algorithm-guided identification of cytokine-expressing leukocytes in MS
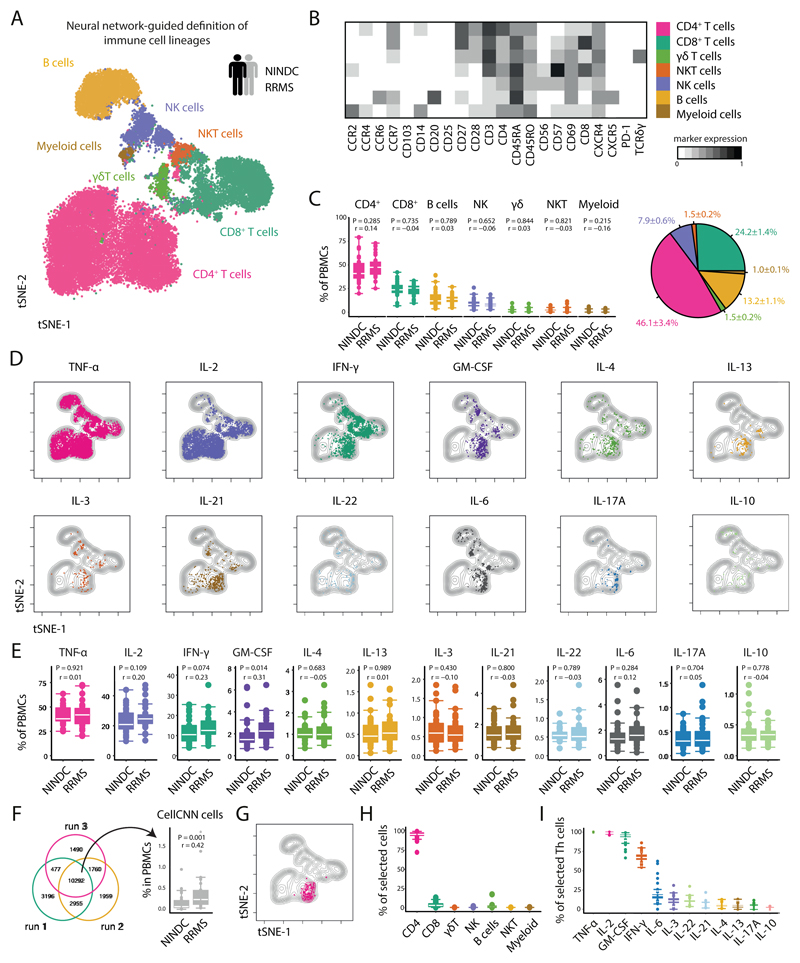
To provide a comprehensive landscape of cytokine production patterns of peripheral immune cells from MS patients, we collected PBMCs of a large cohort of healthy donors (HD), non-inflammatory neurological disease control (NINDC) and RRMS patients (clinical parameters are described in Table S1). PBMCs were briefly stimulated in an antigen-independent manner and analyzed for the protein expression of several lineage-, activation-, and trafficking-associated surface markers, together with the simultaneous analysis of twelve cytokines with single cell resolution (Table S2). To define the major immune lineages directly based on their high-dimensional expression pattern, we employed the powerful abilities of FlowSOM, an artificial neural networks-based algorithm (16, 21). Specifically, FlowSOM-defined nodes were then manually annotated into CD4+, CD8+ and γδ T cells, NK and NKT cells, as well as B cells and myeloid cells (Fig. 1A,B, Extended Data Fig.1A,B and Extended Data Fig.2A-C). Next, we compared the composition of peripheral immune cells between RRMS patients and NINDC patients (additional clinical groups are compared in Extended Data Fig.1-6 and Tables S3-S4) without finding significant differences in their respective frequencies across these sample groups (Fig. 1C and Extended Data Fig.2C).
Fig 1. Automated data analysis of cytokine-producing immune cells identifies a dysregulation of GM-CSF in MS.
PBMCs from all sample groups were restimulated with PMA/ionomycin and analyzed by mass cytometry. (A) The tSNE algorithm (20,000 cells, randomly selected from NINDC (n = 31) and RRMS patients (n = 31)) was used to depict different populations therein (bottom). FlowSOM-based immune cell populations are overlaid as a color dimension. (B) Mean population expression levels of all markers used for tSNE visualization and FlowSOM clustering. (C) Frequencies of immune cell lineages in peripheral leukocytes between NINDC (n = 31) and RRMS patients (n = 31) (left) and as a fraction within the total cohort (right). (D) tSNE-based overview of cytokine+ cells across NINDC (n = 31) and RRMS patients (n = 31) groups. (E) Frequencies of cytokine+ cells within PBMCs between clinical groups. (F) Cells identified by CellCNN across three independent runs (left) and frequency of these cells in PBMCs between clinical groups (right). (G) CellCNN-selected signature cells (colored) are overlaid on a tSNE visualization of the major immune cell lineages from all samples. (H) Composition of signature cells using FlowSOM-based lineage definitions from NINDC (n = 9) and RRMS patients (n = 19). (I) Frequencies of cytokine+ cells within selected Th cells from NINDC (n = 9) and RRMS patients (n = 19). P values are based on two-tailed Mann-Whitney-Wilcoxon tests between the groups. Correlation coefficients (r) were calculated from the z-statistic of the Wilcoxon-Mann-Whitney test. Boxplots depict the IQR with a white horizontal line representing the median. Whiskers extend to the farthest data point within a maximum of 1.5x IQR. Every point represents one individual.
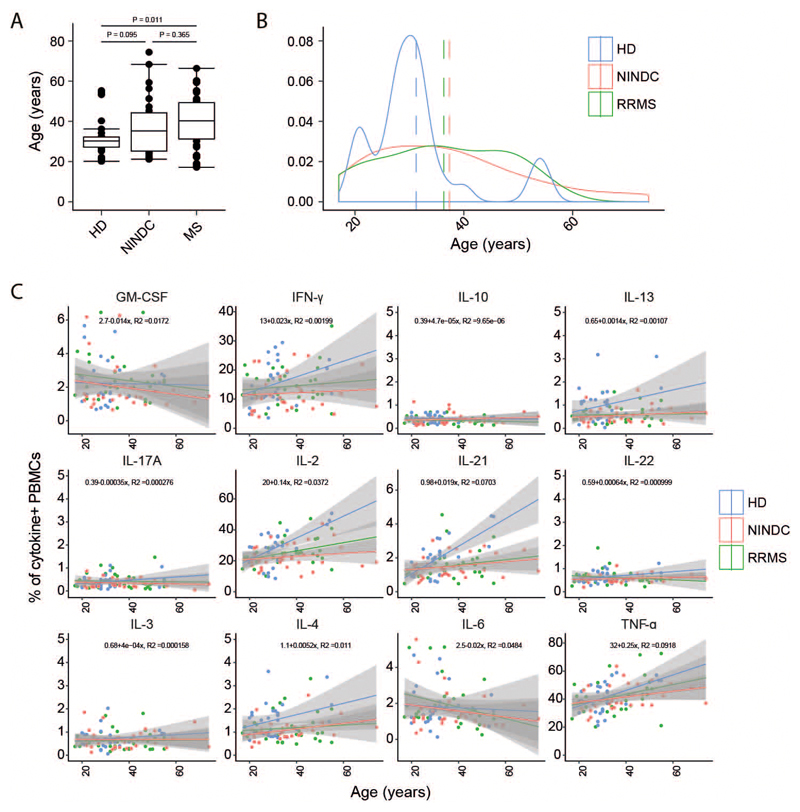
To determine whether functional properties of different leukocyte populations are altered in MS patients, we assessed the production of a broad range of cytokines in individual leukocyte lineages, highlighting a complex pattern of cytokine co-expression across different immune cell subsets (Fig. 1D). We then interrogated the influence of aging on cytokine production and found that while most of the analyzed cytokines show a positive correlation with age (22), GM-CSF and IL-6 production by PBMCs display a negative trend (Extended Data Fig.3A-C).
In line with previous reports (23), when comparing cytokine production patterns in RRMS patients with NINDC patients, we observed several signs of cytokine dysregulation (Fig. 1E and Extended Data Fig.2F), including a trend towards increased production of IL-2 (P=0.109, r = 0.20) and IFN-γ (P = 0.074, r = 0.23) by peripheral blood cells in RRMS patients. More strikingly (r = 0.31), we observed an increased GM-CSF production in RRMS patients (2.2 +/- 0.2%, median +/- s.e.m) compared to NINDC patients PBMCs (1.5 +/- 0.1%, P = 0.014).
In an effort to identify a MS-specific signature in a hypothesis-free and thus more unbiased manner, we employed CellCNN, a representation-learning approach specifically designed for the detection of rare, disease-associated subpopulations (18). CellCNN robustly identified a small subset of cells overrepresented in RRMS vs. NINDC patients (Fig. 1F). To better describe their composition, we superimposed the previously FlowSOM-defined conventional immune populations. We found that the CellCNN-identified signature was almost exclusively comprised of Th cells (Fig. 1G,H) largely expressing TNF, IL-2 and GM-CSF and partly IFN-γ (Fig. 1I), and only a minor fraction of CD8+ T cells.
Th cell GM-CSF production is modulated in MS
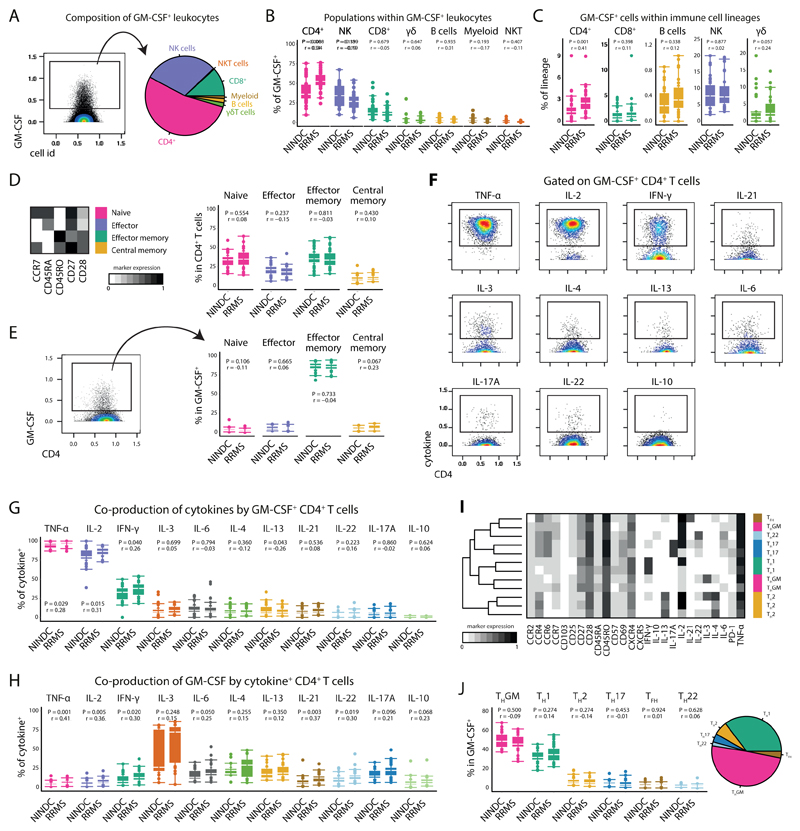
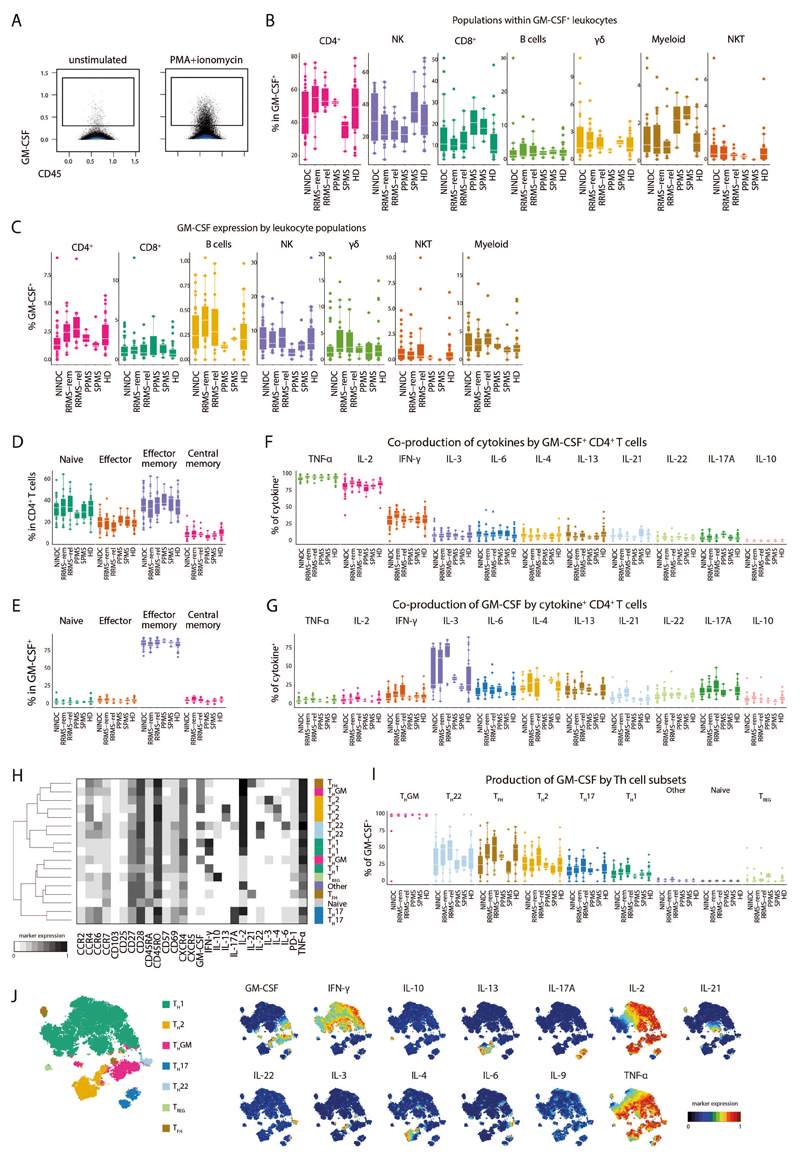
Given the initial increase in total GM-CSF production, its unbiased identification by supervised machine learning together with previous reports about its potential role in the pathogenesis of MS (9, 10, 24), we further investigated whether MS-associated augmentation of GM-CSF expression can be ascribed to a specific immune cell lineage. To this, we first established an overview of all GM-CSF competent immune subsets (Fig. 2A and Extended Data Fig.4A-C). CD4+ T cells constituted the largest fraction of peripheral GM-CSF expressing leukocytes across our cohort, followed by NK cells and CD8+ T cells. γδ T cells and B cells contributed to a lesser extent to GM-CSF production, whereas we only detected minor fractions of GM-CSF+ myeloid cells and NKT cells.
Fig 2. GM-CSF competent T-helper cells are increased in MS.
(A) Single, live, CD45+ cells positive for GM-CSF expression were selected (left) and their composition across RRMS (n = 31) and NINDC (n = 31) patient samples based on previously defined lineages is shown (right). (B) Frequencies of immune cell lineages within GM-CSF+ cells as in B stratified to compare RRMS (n = 31) vs. NINDC patients (n = 29). (C) Frequency of GM-CSF positive cells in major immune lineages in patients. .Th cells from RRMS (n = 31) and NINDC patients (n = 31) were subdivided into naïve, effector, effector memory and central memory cells based on FlowSOM-defined nodes. (D) Mean population expression levels of the indicated differentiation markers (left). Frequencies of Th subsets in RRMS (n = 31) and NINDC patients (n = 31). (E) Frequencies of GM-CSF+ Th cells in patients as in D in RRMS (n = 30) and NINDC patients (n = 29). (F) Coproduction of other cytokines by GM-CSF+ Th cells. (G) Frequencies of cytokine coproduction by GM-CSF+ Th cells in RRMS (n = 30) and NINDC patients (n = 29). (H) Frequencies of GM-CSF production by cytokine+ Th cells in RRMS (n = 20) and NINDC patients (n = 13). (I) FlowSOM was used to identify GM-CSF+ Th cell subsets based on their cytokine production profile (k = 12, elbow criterion). Clusters were manually annotated based on this profile. Shown are mean expression of surface and cytokine markers by the respective Th cell subsets. (J) Frequencies (left) and relative fractions (right) of FlowSOM defined GM-CSF+ Th cell subsets. Data from three independent experiments are shown. P values are based on two-tailed Mann-Whitney-Wilcoxon tests between the groups. Correlation coefficients (r) were calculated from the z-statistic of the Wilcoxon-Mann-Whitney test. Boxplots depict the IQR with a white horizontal line representing the median. Whiskers extend to the farthest data point within a maximum of 1.5x IQR. Every point represents one individual.
Upon stratification for clinical groups, we found the contribution of Th cells to peripheral GM-CSF production to be substantially augmented in RRMS vs. NINDC patients (P = 0.008, r = 0.34, Fig. 2B and Extended Data Fig.4B). We next evaluated whether MS-associated modulation affected the frequencies of GM-CSF-producing cells within each lineage (Fig. 2C and Extended Data Fig.4C). The relative frequency of GM-CSF-producing cells was highest in NK cells, followed by γδ T cells, CD4+ T cells, CD8+ T cells and B cells. Importantly, Th cells represented the population with the most significant increase in MS-associated GM-CSF production (P = 0.001, r = 0.41). We also observed slightly increased GM-CSF expression by γδ T cells and a positive trend in B cells, however not in NK cells or CD8+ T cells. Taken together, Th cells emerge as the major contributor to GM-CSF production in the peripheral immune compartment of MS patients.
GM-CSF producing Th cells constitute a heterogeneous population
We next examined whether GM-CSF production by Th cells is restricted to a specific Th cell subset. FlowSOM nodes were used to separate CD4+ T cells further into naïve, effector, effector memory and central memory cells (Fig. 2D,E and Extended Data Fig.4D,E). GM-CSF production was highest in the effector memory fraction, followed by effector, central memory and naïve Th cells.
Further exploiting the high-dimensional data structure, we analyzed the coproduction of eleven additional cytokines by GM-CSF expressing Th cells (Fig. 2F and Extended Data Fig.4F). The vast majority of GM-CSF producing Th cells co-expressed TNF and IL-2, followed by IFN-γ, which was produced by approximately a third of GM-CSF+ Th cells. A noticeable proportion also co-expressed IL-3, IL-4, IL-6, IL-13 and IL-21. To a lesser extent, GM-CSF expression coincided with IL-22 and IL-17A, while there was virtually no overlap between IL-10 and GM-CSF expression. Conversely, we also examined whether any cytokines were more likely to be co-produced with GM-CSF. IL-3 producing cells had the highest level of GM-CSF co-expression followed by type 2 cytokines IL-4 and IL-13, Th17-associated cytokines such as IL-17A, IL-6 or IL-22 and the type 1 cytokine IFN-γ (Fig. 2H and Extended Data Fig.4G).
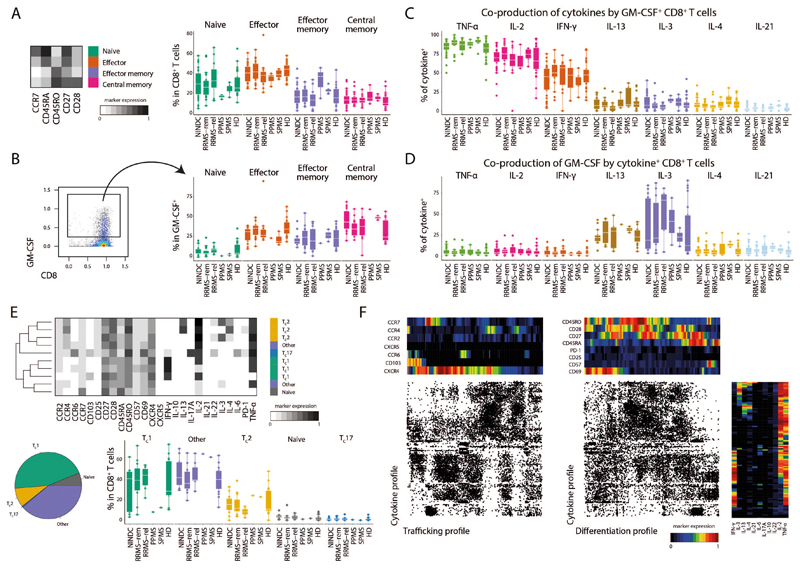
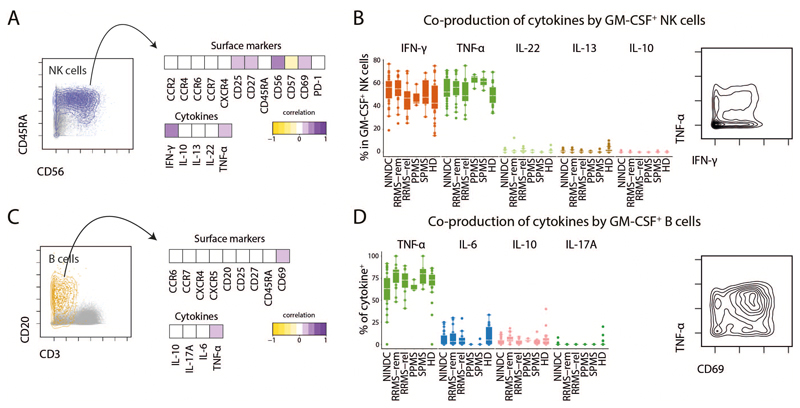
Next, we employed FlowSOM-nodes metaclusters to define several GM-CSF competent Th subsets, including Th1, Th2, Th17, Th22, Tfh (IL-21 expressing Th cells) and a subset not co-expressing any of the other lineage-defining cytokines (hereafter termed ThGM (25)). We were also able to identify regulatory Th cells, which however were not found within GM-CSF+ cells (Fig. 2I,J, Extended Data Fig.4H-J). Most GM-CSF positive Th cells solely co-expressed TNF and IL-2. Further, IFN-γ expressing Th1 cells constituted about a third of GM-CSF producing Th cells, followed by Th2 cells. Th17 and Tfh subsets were also found to contribute, albeit to a lesser extent. Despite the fact that we did not find a major MS-associated modulation of GM-CSF production by other lineages besides Th cells, these cells contribute considerably to peripheral GM-CSF production (Extended Data Fig.5 and Extended Data Fig.6).
CellCNN-identified MS signature is characterized by effector memory T-helper expression of GM-CSF and CXCR4
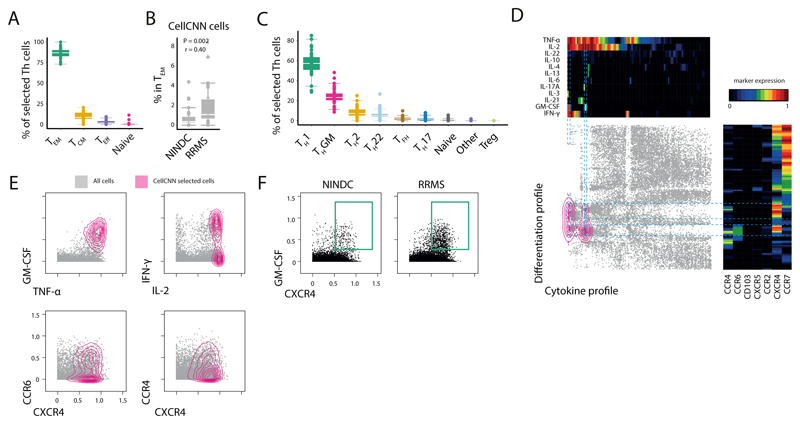
As shown above, GM-CSF-producing Th cells constitute a tremendously heterogeneous population, and a more precise MS-associated cellular signature might be concealed within a particular subpopulation. For this reason, we further characterized the CellCNN-identified, MS-expanded Th-cell signature and found it to mostly belong to the effector memory, and central memory compartments (Fig. 3A,B). Accordingly, MS-expanded Th cells can be mostly described as Th1 and ThGM cells while only minor contributions of Tfh, Th2 and Th22 were identified (Fig. 3C).
Fig 3. Characterization of the CellCNN-identified T-helper signature reveals the coexpression of GM-CSF and CXCR4.
(A) Subtype composition of signature Th cells in RRMS (n = 27) and NINDC (n = 19). (B) Frequency of CellCNN-identified signature Th cells in effector memory Th cells in RRMS (n = 31) and NINDC (n = 30). (C) Th cell subset composition of selected cells in RRMS (n = 27) and NINDC (n = 19). (D) Selected Th cells were used as input for two independent, categorical (cytokines, trafficking) tSNE dimensionality reductions and then plotted against each other. Density distribution of CellCNN-selected cells is overlaid in color. Heat maps depict mean expression levels in each bin. (E) Characterization of selected cells (colored). Non-selected cells are shown in grey. (F) Representative CXCR4 and GM-CSF expression in RRMS and NINDC patients. Representative plots from three independent experiments are shown. P values are based on two-tailed Mann-Whitney-Wilcoxon tests between the groups. Correlation coefficients (r) were calculated from the z-statistic of the Wilcoxon-Mann-Whitney test. Boxplots depict the IQR with a white horizontal line representing the median. Whiskers extend to the farthest data point within a maximum of 1.5x IQR. Every point represents one individual.
To capture the full heterogeneity of Th-associated single-cell cytokine production and trafficking receptor profile, we performed a two-dimensional, categorical tSNE analysis (26). Here, we found the CellCNN-identified population to be characterized by consistent surface expression of the chemokine receptor CXCR4 (Fig. 3D). Fractions of these cells additionally expressed either CCR4, CCR6 or both receptors. Collectively, the production of a specific set of cytokines including GM-CSF, IL-2 and TNF in combination with surface expression of CXCR4 therefore specifically delineates a pathologically expanded Th cell subset in MS (Fig. 3E,F).
T-helper signature is increased in MS compared to other non-inflammatory and inflammatory conditions
To validate our findings we next investigated the immune profile of an independent cohort of age-matched MS patients (n = 12), healthy controls (HC; n = 15), patients diagnosed with clinical isolated syndrome (CIS; n = 8), NINDC (n = 14) and patients affected by other inflammatory diseases (IDC; n = 9) (Table S5, Extended Data Fig.7A,B). To eliminate batch effects, PBMCs from all 72 different donors were live-cell barcoded, stained, and simultaneously acquired (Table S2). Using the same data analysis workflow described above (Extended Data Fig.8A-D), we could confirm signs of cytokine dysregulation in different immune populations (24, 27–29). We found higher frequencies of IL-2 expressing Tc cells in the MS group when compared to HC (P = 0.07) and IDC (P = 0.02), and IL-6 compared to HC (P = 0.01). We also found a trend towards increased GM-CSF production by CD8 T cells in MS. GM-CSF expressing B cells were also significantly increased in MS as compared to HC (P = 0.02), IDC (P = 0.02) and NINDC (P = 0.04), but their overall contribution to GM-CSF production is minimal. Focusing on the Th-cell compartment, we confirmed a significantly increased production of IL-2 (P = 0.02), IFN- γ (P = 0.02) and GM-CSF (P = 0.02) in MS compared to NINDC and compared to HC, while TNF (P = 0.05), IFN-γ (P = 0.04), IL-2 (P = 0.01) and IL-10 (P = 0.01) were increased in MS when comparing with the IDC controls (Extended Data Fig.8E-I).
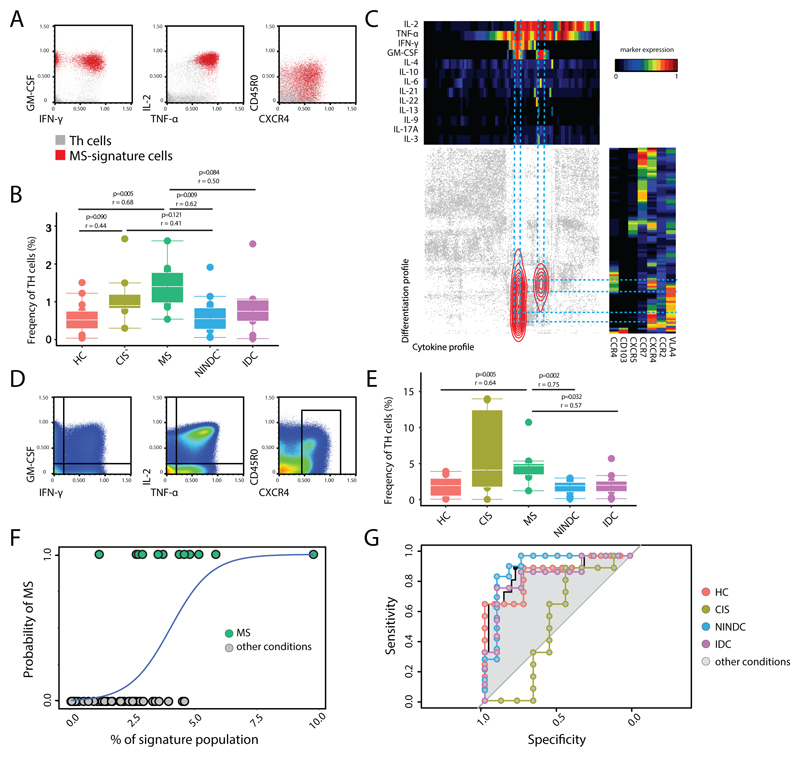
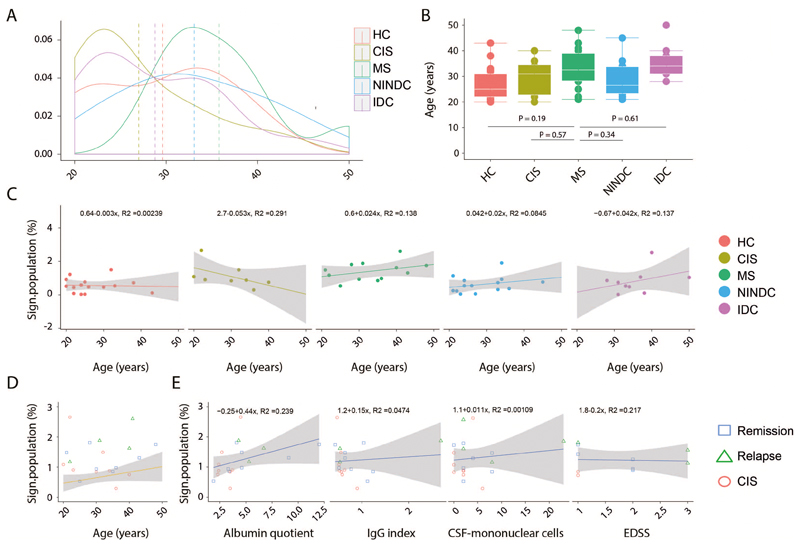
After this confirmation of cytokine dysregulation in MS, we again employed CellCNN and found that the overlay of previously identified CellCNN filters to this new cohort recognized the same signature population to be enriched in the MS group compared to either HC, NINDC or IDC groups (Fig. 4A,B and Extended Data Fig.7C,D). Of note, this signature was also found increased in the CIS group compared to HC group. This population was augmented irrespective of the MS clinical stratification and it correlates with several parameters, most notably with higher albumin quotient, which indicates blood-brain barrier dysfunction (Extended Data Fig.7C,D). Categorical tSNE reduction, as expected, highlighted the surface expression of CXCR4 and the characteristic cytokine profile of this population. A consistent fraction of the signature population also co-expresses surface VLA4, which is involved in T-cell migration into the CNS and is currently an effective immune target in MS (30) (Fig. 4C).
Fig 4. Signature T-helper population is enriched in MS.
An independent validation cohort of total PBMCs from RRMS (n = 12), HC (n = 15), NINDC (n = 14), IDC (n = 9) and CIS (n =8) patients was analyzed by mass cytometry. Representative plots (A) and quantification (B) of CellCNN filters applied to the new cohort. (C) Selected Th cells were used as input for two independent, categorical (cytokines, trafficking) tSNE dimensionality reductions and then plotted against each other. Density distribution of CellCNN-selected cells is overlaid in color. Heat maps depict mean expression levels in each bin. Representative plots of all cells analyzed (D) and quantification (E) of manually-gated GM-CSF, IFN-γ, IL-2, TNF, CXCR4 expressing Th signature. (F) Logistic regression curve of the frequency of the manually-gated population (predictor) in MS and the other clinical conditions. (G) ROC curves representing MS predictivity of the signature population in different settings. P values are based on two-tailed Mann-Whitney-Wilcoxon tests between the groups. Correlation coefficients (r) were calculated from the z-statistic of the Wilcoxon-Mann-Whitney test. Boxplots depict the IQR with a white horizontal line representing the median. Whiskers extend to the farthest data point within a maximum of 1.5x IQR. Every point represents one individual.
To confirm our findings in a readily accessible, low-dimensional space, we limited in-silico the parameterization of our results and translated it into a basic 5-parameters scheme for the analysis of Th compartment (Fig. 4D). The evaluation of the manually gated fraction of GM-CSF, IFN-γ, IL-2, TNF coproducing Th cells that express CXCR4 shows a significantenrichment of this population in the MS group when compared to HC (P=0.005), NINDC (P=0.002) as well as IDC (P=0.032, Fig. 4E).
Finally, further validating the notion that MS patients harbor a disease-specific cellular signature population, we used the frequency of our signature from the combined datasets to predict its MS-association via logistic regression (Fig. 4F). We built a receiver operating characteristic (ROC) curve to control for sensitivity and specificity of our model in characterizing our binary outcome (i.e. diagnosis of MS vs. other condition). Our model provided good predictivity distinguishing MS from other clinical conditions as a whole (AUC: 0.89; CI 0.79-0.91; Power 0.998), or individually from HC (AUC: 0.88; CI 0.74-1; Power 0.98), NINDC (AUC: 0.92; CI 0.80-1; Power 0.99) and IDC (AUC: 0.86 CI 0.68-1; Power 0.89). Interestingly, our predictor did not allow a clear-cut stratification of CIS patients from MS (AUC: 0.53; CI 0.23-0.83; Power 0.04), likely due to the similar pathophysiology of these two conditions (Fig. 4G). Finally, we determined the cut-off threshold that yielded the best sensitivity and specificity of our predictor (signature-frequency threshold = 1.906%, TPR = 0.917, FPR = 0.789), with a notable computed odds-ratio associated to MS (odds-ratio = 10.41). This analysis reinforces our previous findings and links the identified signature to a well-established molecular target in MS (namely VLA-4). Overall, our data suggest an enrichment of this population in the context of MS, while its relative frequency is lower in IDC, and negligible in either HC or NINDC.
MS signature population is decreased by disease-modifying therapy
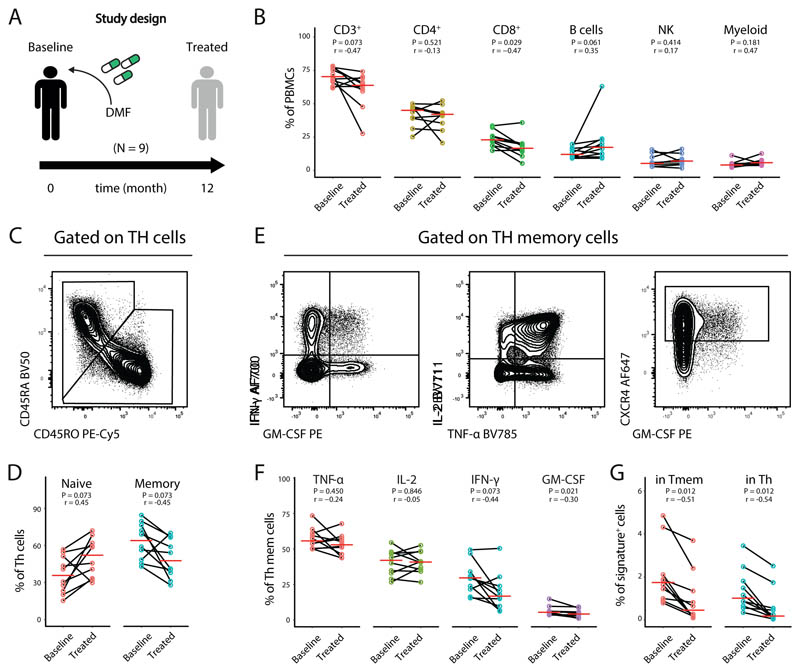
To better understand the contribution of our signature to the disease pathophysiology, we next quantified its frequency within the peripheral compartment of MS patients in a therapeutic setting. Oral dimethyl fumarate (DMF) is an efficient immunomodulatory treatment currently used in relapsing-remitting MS (31, 32). While known to provoke changes in the lymphocyte composition, its precise mechanism of action is still elusive (33–36). To translate our findings into a more accessible clinical setting for biomarker measurements, we collected and analyzed by conventional flow cytometry a cohort of PBMCs longitudinally obtained from MS patients before the initiation of DMF treatment and at one year follow up (clinical information is included in Table S6, Fig.5A).
Fig 5. DMF immunomodulation reduces the identified Th-signature in MS patients.
(A) Total PBMCs from a cohort of MS patients before the initiation of DMF therapy (n = 10) and at 1 year (n = 10) follow-up were longitudinally harvested and analyzed by flow cytometry. (B) Frequencies of the immune populations in blood at baseline (n = 10) and treated patients (n = 10). Th cells were subdivided into naïve and memory Th cells (C) and quantified in baseline (n = 10) and treated patients (n = 10) (D). Representative plots of cytokine staining (E) and quantification of cytokine positive memory Th cells (F) and of the signature population (G) in baseline (n = 10) and treated patients (n = 10). P values are based on paired two-tailed Mann-Whitney-Wilcoxon tests between the groups. Correlation coefficients (r) were calculated from the z-statistic of the Wilcoxon-Mann-Whitney test. A red horizontal line represents the median. Every point represents one individual sampling and each line connects the baseline and follow-up samples of individual patients.
Adopting a similar analytical approach as above, we initially quantified the main immune populations in our samples. Upon stratification at the different time points, we observed a reduced frequency of T cells, and in particular of Tc cells after one year of treatment. We also observed an increased frequency of B cells in treated patients, while the overall frequency of Th, NK and myeloid cells remained unaffected (Fig.5B).
To specifically investigate the impact of DMF on our cell signature, we further interrogated the T-helper compartment. As previously reported (37), memory Th cells were significantly reduced upon DMF treatment with a concomitant increase in the frequency of naïve Th-cells (Fig. 5C,D). Regarding cytokine production, we observed a significant decrease in the frequencies of IFN-γ and GM-CSF producing Th memory cells, while other cytokines were not significantly affected compared to baseline samples. Most importantly, when we compared the frequency of the signature population identified above at the different time-points, we could observe an even stronger reduction of this population both among T helper cells and memory Th cells (Fig. 5E,G). Collectively, while confirming previously reported effects of DMF on systemic leukocyte frequencies, these data clearly indicate a strong and unanticipated impact of DMF on the identified MS-signature in peripheral blood employing an easily reproducible technique, further suggesting a pathological contribution of this population to MS.
Pathologically expanded T cells are found in the CNS of MS patients
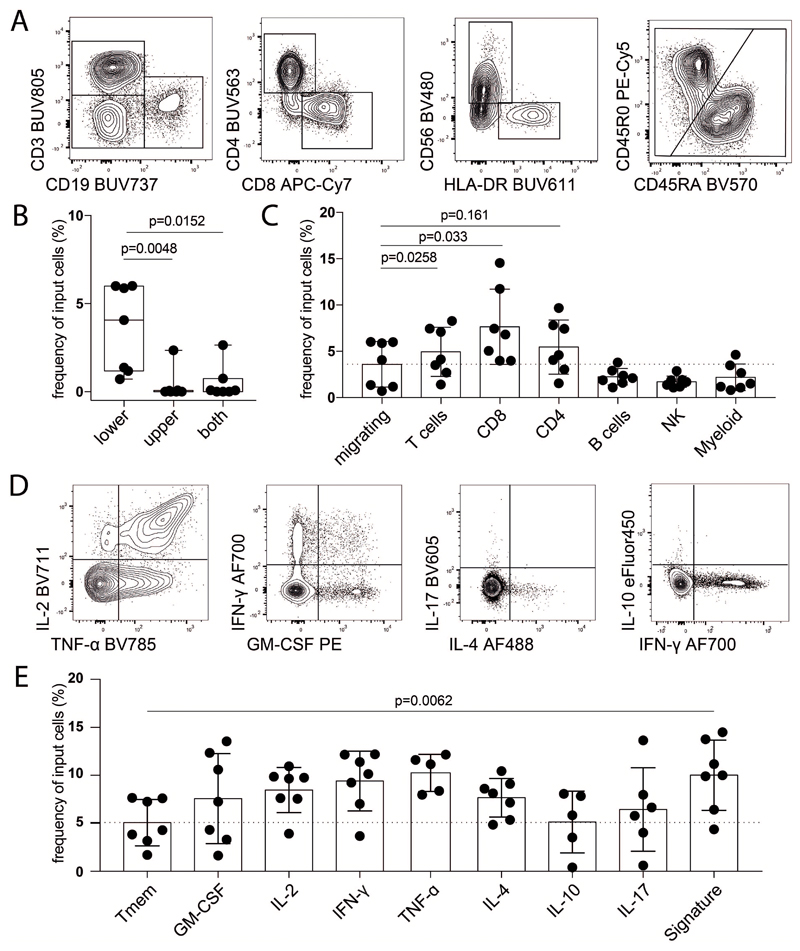
Our analysis allowed the identification of a disease-associated immune signature in peripheral blood, a compartment readily accessible for research and diagnosis. Given the expression of CXCR4 on the identified population and the putative role of its ligand (i.e. SDF1α) in lymphocyte migration in MS (38, 39) we investigated the migratory capacity in a transwell-assay towards a concentration gradient of SDF1α. T cells migrate significantly better toward SDF1α as compared to other immune cells (Extended Data Fig.9A-C). When analyzing migrated T cells regarding their cytokine profile, the identified MS signature population displayed a higher capacity to migrate towards SDF1α compared to memory T-helper cells (Extended Data Fig.9D,E).
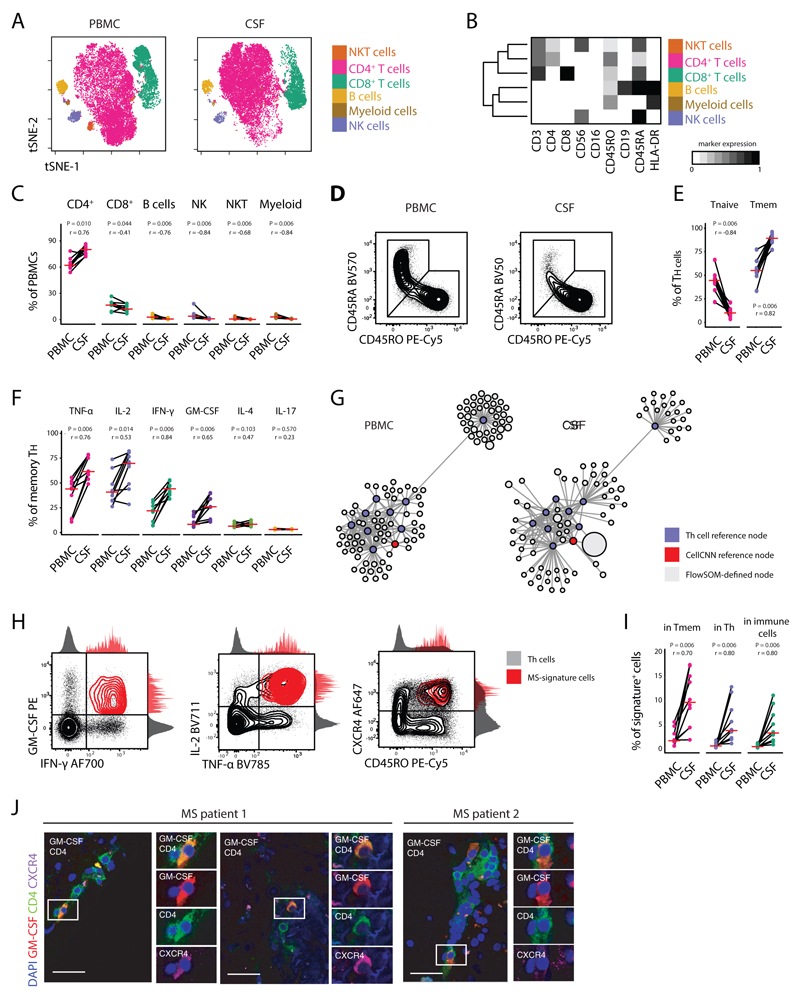
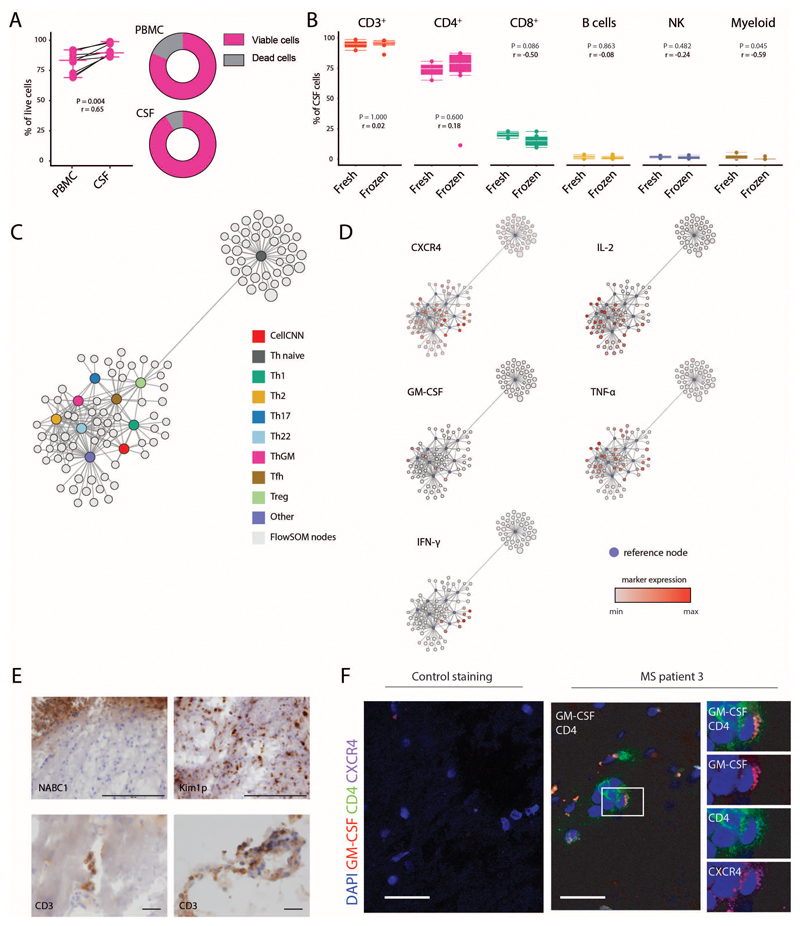
To determine whether the identified signature is indeed equipped to egress into the CNS and there maintained, we additionally investigated the composition and cytokine expression profile of paired cryopreserved CSF and PBMC samples (Table S7) concurrently harvested from RRMS patients (Fig. 6A,B; Table S8). Quality control of the samples was performed for reproducibility (Extended Data Fig.10A-B). In line with previous reports (40, 41), we found higher frequencies of Th cells in the CSF of patients compared to their peripheral blood, while the frequencies of all other identified populations were decreased accordingly (Fig. 6C). Since CSF cells recapitulate important characteristics of intrathecal inflammation, we next interrogated the cytokine expression profile of the identified Th cells. Firstly, memory Th cells were increased in the CSF compartment compared to PBMCs, concurrently to the reduction of naïve Th cells (Fig. 6D,E). To circumvent any potential biases derived from the enrichment in antigen-experienced Th cells in the CSF, we focused our cytokine analysis exclusively on the memory compartment of PBMC- and CSF-derived Th cells. We observed a striking increase in TNF, IL-2, IFN-γ and GM-CSF production by Th cells in the CSF of MS patients (Fig. 6F). Importantly, no significant modification in the frequency of IL-4 and IL-17 producing cells was observed between the two different compartments.
Fig 6. GM-CSF and CXCR4 signature cells are enriched in the CSF of MS patients.
Peripheral blood and CSF cells, concurrently isolated from MS patients (n = 9) were characterized by high-dimensional flow cytometry. (A) The tSNE algorithm (20,000 cells randomly selected) was used to depict the major immune populations in PBMCs (n = 9) and CSF-samples (n = 9). FlowSOM-based immune cell populations are overlaid as a colour dimension. (B) Mean population expression levels of markers used for tSNE-visualization and FlowSOM-clustering. (C) Frequencies of immune cell lineages between paired PBMCs (n = 9) and CSF (n = 9) samples. (D) Naïve and memory Th cells were defined by exclusive CD45RA or CD45RO expression. Representative plots and (E) frequency quantifications in the different compartments (n = 18). (F) Frequencies of cytokine+ cells within memory Th cells between different compartments (n = 18). (G) Scaffold visualization of cytokine-based Th polarization. Violet nodes denote landmarks of CyTOF-based clustering; red nodes indicate landmarks of CellCNN-identified population; grey nodes represent FlowSOM-defined clusters from paired PBMCs (left) and CSF cells (right) mapped on the reference. (H) Representative plots of the corresponding MS signature population in the CSF of MS patients (n = 9). (I) Relative fraction of signature cells within different immune subsets in their distinctive compartment (n = 9). (J) Immunofluorescence of GM-CSF expressing CXCR4+CD4+ T cells in MS brain tissue samples. Immunohistochemical analysis demonstrated inflammatory infiltrates of T cells and demyelination lesions in the MS samples. (See Extended Data Fig.7E). Negative controls were generated from serial sections by staining with secondary antibodies only (See Extended Data Fig.7F). Scale bars = 30 μm. P values are based on paired two-tailed Wilcoxon Signed-Rank tests between the PBMCs and CSF cells isolated from each patient. A red horizontal line represents the median. Correlation coefficients (r) were calculated from the z-statistic of the Wilcoxon-Mann-Whitney test. Points represent individuals.
Next, we employed the Scaffold framework (42) to create a mass cytometry-based reference map of Th cells heterogeneity (Extended Data Fig.10C,D). Using this approach, we successfully matched cells from our flow cytometry analysis to previously identified Th cell subsets which allowed us to identify cells displaying the CellCNN-based MS signature within the CSF (Fig. 6G,H). Importantly, this revealed a dramatic increase of MS-signature cells within the CSF as compared to peripheral blood, with a proportional expansion within memory Th, total Th and overall immune cells (Fig. 6I).
Finally, extending this analysis directly into inflamed CNS tissue, we investigated the expression of GM-CSF and CXCR4 on CD4+ T cells at CNS inflammatory sites in autopsy samples of MS patients not receiving immunomodulatory treatments. Immunofluorescence of CNS tissue samples confirmed the presence of CXCR4+CD4+ T cells that co-produced GM-CSF in lesional sections from all MS patients (Fig. 6J and Extended Data Fig.10E,F). Altogether, this analysis underlined the definition of MS-signature cells, demonstrated that these cells are strongly enriched in the CSF of MS patients and further, showed that they directly locate to sites of inflammation within the CNS.
Discussion
Here we employed high-dimensional mass and flow cytometry in combination with two complementary and converging neural network-based learning approaches to identify a signature sub-population of Th cells characterized by the expression of GM-CSF, TNF, IL-2 and CXCR4 in the peripheral blood and CSF of patients with RRMS. The majority of these cells also secrete IFN-γ, which together with GM-CSF has been shown to modulate myeloid cell function and potentially directly license them for tissue destruction (43–45).
Recently, compelling evidence from several studies highlighted especially GM-CSF to be central in MS pathophysiology (9, 10, 24, 46–49), leading to the design of a phase Ib clinical trial in MS (50). Besides Th cells, previous reports suggested a role of GM-CSF-producing CD8+ T cells (24) and B cells, the latter potentially explaining the efficacy of B cell depleting therapy (BCDT) in MS (27–29). Apart from GM-CSF, other B-cell derived cytokines have been linked to MS as putative target of BCDT (51, 52). However, several lines of evidence suggest an indirect role of B cells in supporting neuroinflammatory loops by antigen presentation, potentially promoting the survival and expansion of a Th-pathogenic repertoire (53). In comparison to previous studies, we exploited mass cytometry’s high dimensionality to provide a better coverage over immune population dynamics within the same experimental setting. To interrogate the immune profile of MS patients, we further employed innovative algorithms for the automated identification of stratifying biomarkers (i.e. CellCNN), devoid from previous assumptions. Even though we found a minor contribution of CD8+ T cells to the cellular signature in MS and an increased GM-CSF production by B cells, our algorithmic approach primarily identified Th cells as the principal source of elevated GM-CSF production in MS.
Antigen specificity of T and B cell responses in MS remains a topic of debate, and thus far no uniquely responsible antigen has been identified. Reports of different T cell receptor avidities, inter-patient variation and epitope-spreading further complicate the topic (1). Given this complexity, we here focused on the antigenic history of patients by capturing cytokine activities in an antigen independent manner across all major leukocyte populations. We discovered a potential link between disease-associated GM-CSF producing Th cells and the chemokine receptor CXCR4, which has been shown to play an important role in regulating immune trafficking in the CNS through the modulation of SDF1α at the blood-brain barrier. In MS active lesions, this molecule redistributes on the luminal side of brain vessels, suggesting a role of CXCR4/SDF1α in the recruitment of pathogenic cells into the CNS (38, 39, 54–56). Similarly, in our signature, we also observed high levels of VLA4, which is also a crucial modulator of immune-cell migration in the CNS and already a successful therapeutic target in MS therapy (30).
Supporting the notion that this population is equipped to egress into the CNS, we additionally analyzed paired CSF and peripheral blood samples of MS patients and we found the Th signature to be further increased in this CNS compartment. Other reports have provided insights on cytokine production in the CSF of MS patients. We similarly observed an increased frequency of memory T cells that express GM-CSF and IFN-γ in this compartment as compared memory cells in the peripheral blood (9, 57), while we did not detect increased frequencies of IL-17 expressing Th cells in CSF, possibly due to our focus on antigen-experienced cells rather than on the bulk Th compartment (58). Moreover, we also identified our Th-signature within inflamed brain tissue of MS patients, indicating that this population can cross the blood brain barrier and infiltrate the CNS parenchyma, where it could either directly contribute to tissue damage or reinforce other inflammatory circuits
While DMF treatment is known to provoke changes in the systemic lymphocyte composition, antigen-experienced T cells were identified as the most relevant population affected (33–36, 59). Using an easily accessible low-dimensional flow cytometric approach, we here observed a strong decrease of the newly identified signature population in the blood of DMF-treated patients. Our analysis does not allow us to discern whether this reduction is per se responsible for the therapeutic effect of DMF rather than a consequence of reduced disease activity, further studies are required to address this question by investigating the DMF-induced immune modulation of our identified signature in responders and non-responding MS patients. Similarly, the analysis of our model on broader, untreated cohorts of neuro-inflammatory disease patients is needed to better address the specificity of our MS-signature.
Taken together, our results associate a specific Th-cell population to a new molecular target, CXCR4, which potentially allows the egress of this pathological subset in the CNS of MS patients. Since this population does not fall into classical Th categories, only pattern recognition allowed the identification of this unique and MS-specific Th signature. We believe that the precise characterization of GM-CSF+, IL-2+, TNF+, T-helper cells co-expressing the chemokine receptor CXCR4 provides new insights into disease etiology and possibly offers both a diagnostic biomarker from an easily accessible compartment such as the peripheral blood, as well as a novel therapeutic target to interfere with the aberrant immune dysregulation of MS without unspecific collateral immune suppression.
Methods
Healthy donor and patient samples
Cryopreserved peripheral blood and cerebrospinal fluid samples for mass cytometry analysis (Table S1) and flow cytometry analysis (Table S7) were collected at the Department of Neurology, Karolinska University Hospital. All donors had given written informed consent and the study was approved by the Stockholm Regional Ethical Vetting Board (no.2009/2107-31/2). For mass cytometry analysis, RRMS was defined according to McDonald´s revised diagnostic criteria for MS (60), and HD as well as NINDC patients were defined according to the consensus definitions guidelines (61). Patients were classified as relapse if presenting new neurological MS symptoms and/or MRI was displaying gadolinium enhancing lesion/s within one month before or after sampling. SLE was used as inflammatory disease control without or with CNS involvement (CNS-SLE; defined as SLE with neuropsychiatric symptoms excluding tension headache, migraine and stroke). For flow cytometry analysis, RRMS was defined according to McDonald´s revised diagnostic criteria for MS (62). For the DMF cohort, cryopreserved peripheral blood mononuclear cells were collected longitudinally at the MS center of the University Hospital of Basel from individuals with RRMS diagnosed according to 2011 revised McDonald criteria (see Table S6). All donors had given written informed consent and the study was approved by the Ethics Committee of northwest/central Switzerland (EKNZ 2014-48/12).
Isolation and cryopreservation of CSF cells
CSF samples (10 ml) were collected into 15 ml polypropylene tubes and centrifuged at 400 rcf for 10 min at 4°C. CSF supernatant (9 ml) was removed from collection tube. An equal volume of RPMI-1640 (PAN biotech) was added to the remaining CSF with cells and held on ice until processing (within 1 hr). CSF with media was centrifuged at 400 rcf for 10 min at 4°C to pellet the cells. The supernatant was discarded, CSF cell pellets were loosened and resuspended in 800 µl of human AB serum (Sigma). Cells were placed on ice and an equal volume of human AB serum with 20% DMSO was added dropwise with gentle mixing. The CSF cell suspension was aliquoted into 2 ml cryotubes, placed in CoolCell container and transferred to a -80°C freezer for 12-72 hours. Subsequently, CSF cells were transferred to a liquid nitrogen tank stored in the vapor phase.
Ex vivo reactivation of PBMCs and CSF cells
Short-term reactivation of cryopreserved PBMCs and subsequent mass cytometry analysis were performed as described recently (19). In short, PBMCs were kept in liquid nitrogen before thawing in a 37 °C water bath. Cells were resuspended in cell culture medium (CCM: RPMI-1640, 10% fetal calf serum (FCS; Biochrom), 1x L-glutamine, 1x penicillin/streptomycin (both life technologies)) supplemented with 1:10'000 benzonase (Sigma), and centrifuged (300 rcf, 7 min, 24 °C). Samples were then rested overnight at 37 °C before restimulation with 50 ng mL-1 phorbol 12-myristate 13-acetate (PMA; Sigma) and 500 ng mL-1 ionomycin (Sigma) in the presence of 1x BrefeldinA (BD) for 4 hours at 37 °C.
Antibodies
For mass cyometry, monoclonal anti-human antibodies (Table S2) were purchased either preconjugated to heavy-metal isotopes (Fluidigm) or conjugated using the Maxpar™ X8 chelating polymer kit (Fluidigm). Flow-cytometry antibodies were purchased pre-conjugated (Table S8).
Live cell barcoding for mass cytometry
To minimize inter-sample staining variability, sample handling time and antibody consumption, we made use of a live cell barcoding approach (63). In short, isothiocyanobenzyl-EDTA (Dojindo) was loaded with palladium isotopes (104Pd, 105Pd, 106Pd, 108Pd, 110Pd, all from Trace Sciences International) as described (64), or niobium (93Nb) and tantalum (Ta181), and conjugated to anti-human CD45 (Biolegend). 89Y-CD45 (Fluidigm) was used as an additional barcoding reagent. Samples were stained with anti-CD45 antibodies following reactivation at 37 °C for 25 min in cell staining medium (CSM; RPMI-1640, 4% FCS) on a rotating shaker (500 rpm), washed twice with CSM and combined into a single reaction vessel for further staining steps. Using this approach, up to 20 samples (equal ratio of RRMS patients and controls) were combined and processed together. In total, multiple barcoding reactions were performed on three independent occasions. Up to 73 samples were barcoded, combined and stained in one reaction vessel our validation cohort.
Surface staining
For mass cytometry, the barcoded and combined sample was resuspended in 400 μL of surface-antibody mixture (Table S2) in CSM. Surface staining was performed for 20 min at 37 °C on a rotating shaker (500 rpm). To identify dead cells, 2.5 μM cisplatin (Sigma) was added for 2 min on ice. For flow cytometry, 50 μL of surface-antibody mixture (Table S8) was added to the samples, followed by incubation for 30 min at RT.
Intracellular cytokine staining
For mass cytometry, the combined surface- and live/dead-stained sample was fixed with 1.6% paraformaldehyde in PBS (PFA; Electron Microscopy Sciences) for 30 min at 4 °C on a rotary shaker (500 rpm). Fixed cells were washed twice with permeabilization buffer (PBS, 0.5% saponin, 2% BSA and 0.01% sodium azide, (all Sigma)). Cells were resuspended in 400 μL of intracellular antibody mixture (Table S2) in permeabilization buffer for 1 h at 4 °C on a rotary shaker (500 rpm). The sample was washed, supernatant removed and the cells resuspended in 1x iridium intercalator solution (Fluidigm) over night. Lastly, the sample was washed twice with PBS/BSA, once with ddH2O before acquisition. For flow cytometry, similar fixation and permeabilization was performed. Cells were resuspended in 50 μL of intracellular antibody mixture (Table S8) in permeabilization buffer for 1 h at 4 °C on a rotatory shaker. Samples were then washed with CSM.
Acquisition and data preprocessing
Quality control and tuning of the CyTOF2 mass cytometer (Fluidigm) was performed daily. Acquisitions from different days (three independent acquisitions were performed) were normalized using 5-element beads (Fluidigm) (65). For downstream analysis, live, single cells were identified based on event length, DNA (191Ir and 193Ir) and live cell (195Pt) channels using FlowJo (Treestar). The combined sample was debarcoded using matlab-based software (64). Flow cytometry samples were acquired on a FACSymphony (BD Biosciences). Cytometry data from control and MS patients was transformed with an inverse hyperbolic sine (arcsinh) function (mass cytometry: cofactor of 5; flow cytometry cofactor 150) using the R environment (66). To balance the influence of markers with different dynamic ranges, we performed background subtraction and channel-based percentile normalization using the 99.9th percentile of each marker across the whole barcoded dataset (15). Individual cytokine positivity threshold was determined based on the 0.99 percentile of the residual staining in an unstimulated control sample.
Algorithm-based high-dimensional analysis
Preprocessed data was down-sampled to a maximum of 100’000 cells per donor. In the validation cohort, patient matching the age of the MS group (namely, subject under 50 years old) were considered for the analysis. All FlowSOM-based clustering was performed on the combined dataset to enable identification of small populations. For Th cells, resulting nodes were metaclustered with the indicated k-values (based on the elbow criterion) and annotated manually. The elbow point can be identified by examining the percent of variance explained in relation to the number of clusters. Two- and one-dimensional tSNE projections were calculated using the Rtsne package (perplexity = 50, theta = 0.1). CellCNN-based analysis was performed by training a randomly selected subset of cells. Default values were used for most CellCNN hyperparameters, except for the following: ncell = 2000, scale = False, maxpool percentages = [0.5, 1, 2.5, 5, 10]. Three independent subsamplings of 20’000 cells per donor were used to train the algorithm, and only the shared identified cells were used for subsequent analysis. Scaffold maps were created using the statisticalScaffold package (67) with mass cytometry data as landmark nodes. All plots were drawn using ggplot2.
Migration assay
Cryopreserved PBMCs were thawed and rested over-night before used in a chemotaxis migration assay (68). Briefly, cells were cultured in starvation medium (CCM: RPMI-1640, 1% fetal calf serum (FCS; Biochrom), 1x L-glutamine, 1x penicillin/streptomycin (both life technologies) for 3 hours and then loaded in the upper chamber for 3 additional hours in an incubator at 37°C 5%CO2. SDF-1α was used at a concentration of 100 ng/ml in the upper, lower or upper and lower chambers of the transwell. Cells were then counted, restimulated for 4 hours and stained as previously described, and acquired on a FACSymphony (BD Biosciences). Cell migration was calculated as a percentage of the specifically phenotyped input cell-type.
Immunohistochemistry
MS brain tissues were obtained from the archives of the Institute of Neuropathology at the University Medical Centre Göttingen, Germany. The study was approved by the local ethics committee (#14/5/03 and #29/9/10). Brain tissue from three autopsied MS patients was analyzed. Tissues were cryosectioned (10 μm thick) for immunohistochemistry using a Hyrax C60 cryostat (Zeiss) and stored at -80°C. Brain sections were fixed in 2% PFA and acetone, washed in PBS, and blocked with PBS supplemented with 0.1% Triton X-100 and 4% normal goat serum. Subsequently, sections were incubated with the following primary antibodies (diluted in blocking solution) overnight at 4°C: rat anti-GM-CSF antibody (BD Pharmingen, clone BVD2-21C11, 1:50), mouse anti-CD4 antibody (Biolegend, clone RPA-T4, 1:50) and rabbit anti-CXCR4 (abcam, clone UMB2, 1:50). Sections were then washed in PBS and incubated with AF647-labeled goat anti-rat, AF488-labeled goat anti-mouse and AF555-labeled donkey anti-rabbit secondary antibodies (Life Technologies, 1:500) overnight at 4°C or at room temperature for 1 h. Sections were mounted with SlowFade Gold antifade reagent with DAPI (Invitrogen). Fluorescence photomicrographs were captured with a SP5 Leica confocal laser scanning microscope (SP5; Leica) equipped with argon and helium lasers using the 40x objective (oil immersion, NA1.25). Images were processed and merged by Imaris imaging software (Bitplane). Further immunohistochemistry stainings were performed as follow: Cryosections were incubated overnight in 4% PFA. For epitope demasking sections were heated in a steamer with 10 mM citric acid buffer (pH 6.0), washed with bidistilled water and transferred to 0.3% H2O2 in PBS for 10 min at 4°C to block endogenous peroxidase. The sections were then washed with PBS and subsequently incubated with blocking buffer (10%FCS/PBS) for at least 20 min. Thereafter, the sections were prepared for primary and secondary antibody incubation. The following primary antibodies were used: mouse anti-BCAS1 antibody (Santa Cruz, sc-136342, 1:500), mouse anti-macrophage/activated microglia antibody (clone KiM1P, 1:5000, kind gift of Prof. Dr. Heinz-Joachim Radzun, Göttingen) and CD3 (DCS, C1597CO1, 1:150). Antibody binding was visualized using biotinylated secondary antibodies (GE Healthcare, Jackson ImmunoResearch and DCS Innovative Diagnostic Systems), peroxidase-conjugated avidin and DAB (Sigma-Aldrich).
Statistical analysis
Frequencies of immune populations were compared with the non-parametric Wilcoxon-Mann-Whitney test using the R package coin. Parent populations with few cells were excluded from the statistical analysis. Controlling for multiple comparisons was accomplished with the Benjamini-Hochberg approach (69, 70). Pearson’s correlation coefficients (r) were calculated from the z-statistic of the Wilcoxon-Mann-Whitney test. The ROC predictivity and power (calculated as 1 – false positive rate) analysis and odds ratio calculation were obtained using the pROC and oddratio R package. Cut-off for odds ratio calculation was based on Youden’s J statistical method (71) and also obtained using the oddratio R package. For the CSF analysis paired Wilcoxon Signed-Rank test was used to compare different populations.
Study approval
All donors had given written informed consent and the study was approved by the regional ethical review board of Stockholm (PBMCs and CSF samples), Basel (PBMCs) and Göttingen (brain biopsies).
Reporting Summary
Further information on experimental design is available in the Life Science Reporting Summary linked to this article.
Extended Data
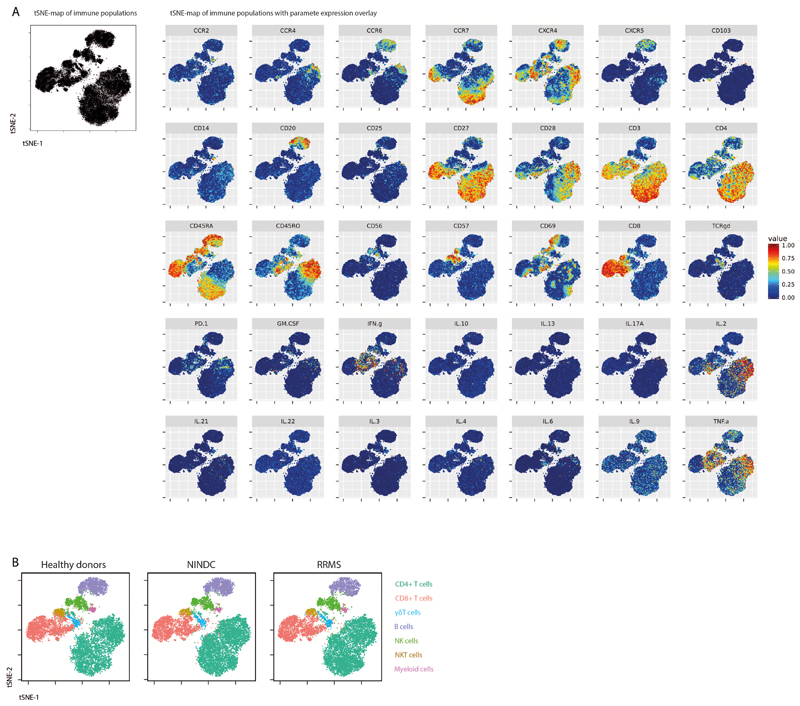
Extended Data Fig.1. Single-cell t-SNE profiling of immune cells.
PBMCs from all sample groups were restimulated with PMA/ionomycin and analyzed by mass cytometry. The tSNE algorithm (30,000 cells, equally selected from HD (n = 29) and NINDC patients (n = 31) and MS (n = 31) groups and from all samples) was used to depict different populations therein. (A) Expression of each indicated marker is overlaid. (B) FlowSOM-based immune cell populations are overlaid as a color dimension.
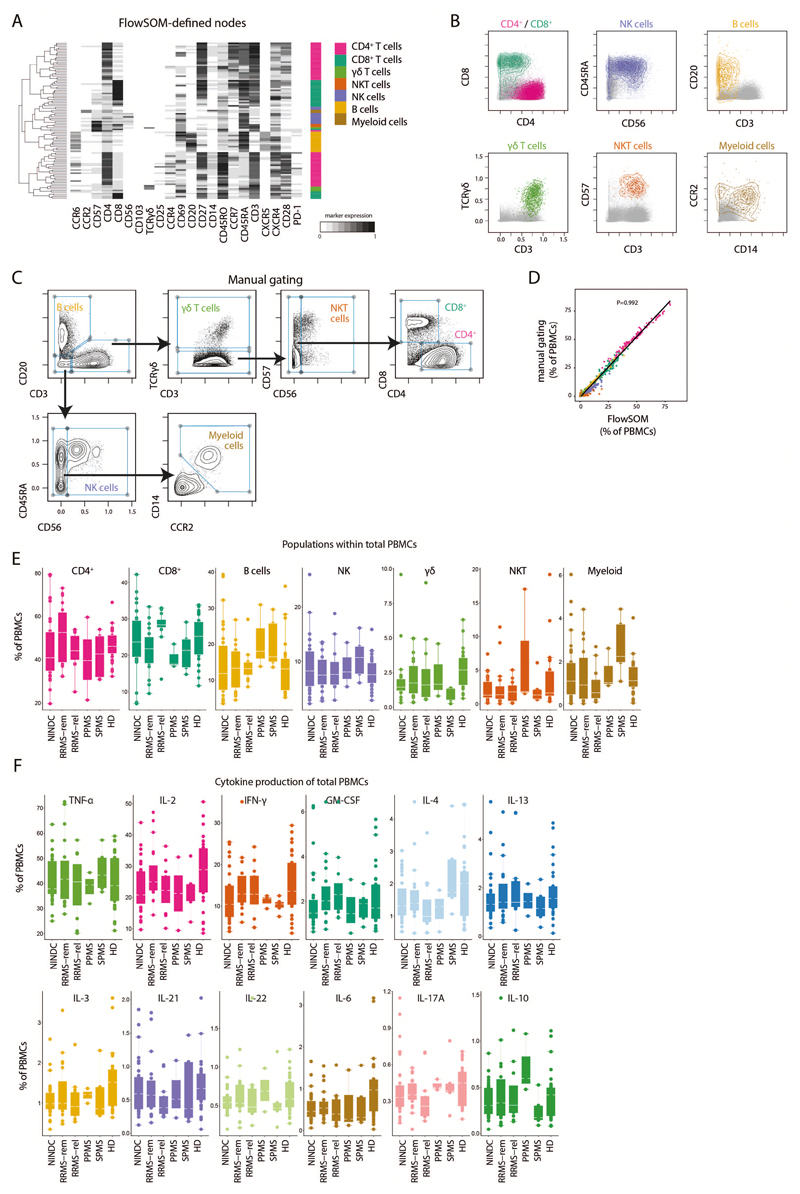
Extended Data Fig.2. FlowSOM-guided clustering of peripheral blood immune cell lineages.
(A) PBMCs from HD (n = 29) and NINDC patients (n = 31) and MS (n = 31) were restimulated with PMA/ionomycin and analyzed by mass cytometry. Heatmap of FlowSOM-identified initial nodes and their mean surface marker expression levels, together with their lineage assignment (color-coded). (B) Biaxial plots showing the expression of the main lineage markers of FlowSOM-based populations (colored). The total samples from HD (n = 29) and NINDC patients (n = 31) and MS (n = 31) is shown in grey. (C) Data as in A was manually gated to define the same populations. Samples from 3 independent runs are analyzed. (D) Correlation of frequencies for the immune populations (color-coded) as defined by FlowSOM and manual gating. Each dot represents the frequency of a leukocyte population of one donor (n = 91). P-value was calculated using linear regression. (E) Frequencies of immune cell lineages in peripheral leukocytes between NINDC (n = 31) and RRMS patients during remission (n = 18), or during relapse (n = 12), SPMS patients (n = 5), PPMS patients (n = 3) and HD (n = 29). (F) Frequencies of cytokine+ cells within PBMCs between NINDC (n = 31) and RRMS patients during remission (n = 18), or during relapse (n = 12), SPMS patients (n = 5), PPMS patients (n = 3) and HD (n = 29). Boxplots depict the interquartile range (IQR) with a horizontal line representing the median. Whiskers extend to the farthest data point within a maximum of 1.5x IQR. Points represent individuals.
Extended Data Fig.3. Age analysis of MS and control groups.
(A) Boxplots depict the age of patients in HD (n = 29) and NINDC patients (n = 31) and MS (n = 39). (B) Age distribution among HD (n = 29) and NINDC patients (n = 31) and MS (n = 39). (C) Correlation between frequencies of cytokine producing PBMCs and age. Regression curve with confidence intervals are depicted in HD (n = 29), NINDC (n = 31) or MS (n = 39) groups. Boxplots depict the IQR with a white horizontal line representing the median. Whiskers extend to the farthest data point within a maximum of 1.5x IQR. P values are based on two-tailed Mann-Whitney-Wilcoxon tests between the groups. Controlling for multiple comparisons was accomplished with the Benjamini-Hochberg approach. Every point represents one individual.
Extended Data Fig.4. Leukocyte and cytokine production characterization in MS patient subgroups.
(A) Exemplary GM-CSF production by total leukocytes with (right) or without (left) prior PMA/ionomycin stimulation (three independent experiments). (B) Frequencies of immune cell lineages within GM-CSF+ cells in NINDC (n = 21) and RRMS patients during remission (n = 17), or during relapse (n = 10), SPMS patients (n = 3), PPMS patients (n = 2) and HD (24). (C) Frequency of GM-CSF positive cells in major immune lineages in NINDC (n = 31) and RRMS patients during remission (n = 18), or during relapse (n = 12), SPMS patients (n = 5), PPMS patients (n = 3) and HD (n = 29). (D) Frequencies of FlowSOM-based Th memory subpopulations in total Th cells in NINDC (n = 31) and RRMS patients during remission (n = 18), or during relapse (n = 12), SPMS patients (n = 5), PPMS patients (n = 3) and HD (n = 29). (E) Frequencies of GM-CSF+ Th cells in patients in NINDC (n = 23) and RRMS patients during remission (n = 18), or during relapse (n = 11), SPMS patients (n = 4), PPMS patients (n = 3) and HD (n = 27). (F) Coproduction of other cytokines by GM-CSF+ Th cells in NINDC (n = 23) and RRMS patients during remission (n = 18), or during relapse (n = 11), SPMS patients (n = 4), PPMS patients (n = 3) and HD (n = 27). (G) Frequencies of GM-CSF production by cytokine+ Th cells in NINDC (n = 13) and RRMS patients during remission (n = 14), or during relapse (n = 8), SPMS patients (n = 4), PPMS patients (n = 2) and HD (n = 22). (H) FlowSOM was used to identify total Th cell subsets based on their cytokine production profile (k = 17, elbow criterion). Clusters were manually annotated based on this profile. Shown are mean expressions of surface and cytokine markers by the respective Th cell subsets. (I) Frequencies of FlowSOM defined GM-CSF+ Th cell subsets in NINDC (n = 31) and RRMS patients during remission (n = 19), or during relapse (n = 12), SPMS patients (n = 5), PPMS patients (n = 3) and HD (n = 29). (J) The tSNE algorithm (30,000 cytokine-expressing Th cells, equally selected from different clinical groups and from all samples) was used to depict different populations therein. FlowSOM-based Th subsets (left) and expression of each indicated marker (right) is overlaid. Representation plots from randomly selected cells from 3 independent experiments. Boxplots depict the IQR with a white horizontal line representing the median. Whiskers extend to the farthest data point within a maximum of 1.5x IQR. Every point represents one individual.
Extended Data Fig.5. GM-CSF producing CD8+ T cells display largely analogous cytokine production profiles to CD4+ T cells.
CD8+ T cells were subdivided into naïve, effector, effector memory and central memory cells based on FlowSOM-defined clusters. (A) Mean expression levels of the indicated surface markers in the respective subpopulation (left). Frequencies of these subpopulations in total CD8+ T cells in NINDC (n = 31), RRMS patients during remission (n = 18), or during relapse (n = 12), SPMS patients (n = 5), PPMS patients (n = 3) and HD (n = 29). (B) Frequency of these subpopulations in GM-CSF+ CD8+ T cells in NINDC (n = 16), RRMS patients during remission (n = 16), or during relapse (n = 10), SPMS patients (n = 3), PPMS patients (n = 1) and HD (n = 21). (C) Frequency of cytokine+ in GM-CSF+ CD8+ T cells. (D) Production of GM-CSF by CD8+ T cells positive for the indicated cytokine cells in NINDC (n = 11), RRMS patients during remission (n = 5), or during relapse (n = 3), SPMS patients (n = 2), PPMS patients (n = 1) and HD (n = 14). (E) FlowSOM was used to identify GM-CSF+ CD8+ T cell subsets based on their cytokine production profile (k = 10, elbow criterion). Clusters were manually annotated based on this production profile. Mean expression of surface and cytokine markers by the respective subsets (top). Relative fractions (bottom, left) and absolute frequencies (bottom, right) of FlowSOM defined GM-CSF+ CD8+ T cell subsets in NINDC (n = 11), RRMS patients during remission (n = 12), or during relapse (n = 6), SPMS patients (n = 1), PPMS patients (n = 1) and HD (n = 14). (F) Categorical tSNE analysis with heatmaps depicting mean expression levels in each bin. Boxplots depict the IQR with a white horizontal line representing the median. Whiskers extend to the farthest data point within a maximum of 1.5x IQR. Every point represents one individual.
Extended Data Fig.6. Co-production profiles of GM-CSF expressing NK and B cells.
(A) Total NK cells were selected and the expression level of all relevant surface markers was correlated (Pearson’s r) with GM-CSF expression on a single-cell level. Heatmap depicts Spearman correlation coefficients. (B) Frequencies (left) and example (right) of cytokine coexpression by GM-CSF+ NK cells in NINDC (n = 31), RRMS patients during remission (n = 19), or during relapse (n = 12), SPMS patients (n = 5), PPMS patients (n = 3) and HD (n = 29). (C) B cells were selected and the expression level of all relevant surface markers was correlated (Pearson’s r) with GM-CSF expression on a single-cell level. (D) Frequencies (left) and example (right) of cytokine expression by GM-CSF+ B cells in patients as in B. Boxplots depict the IQR with a white horizontal line representing the median. Whiskers extend to the farthest data point within a maximum of 1.5x IQR. Every point represents one individual.
Extended Data Fig.7. Clinical correlations in the validation cohort.
(A) Age distribution among RRMS (n = 12), HC (n = 15), NINDC (n = 14), IDC (n = 9) and CIS (n =8) patients. (B) Boxplots depict the age in RRMS (n = 12), HC (n = 15), NINDC (n = 14), IDC (n = 9) and CIS (n =8) patients. (C) Correlation between frequencies of the CellCNN-defined immune signature and age in RRMS (n = 12), HC (n = 15), NINDC (n = 14), IDC (n = 9) and CIS (n =8) patients. Regression curve with confidence intervals are depicted per each group. (D) Correlation of the frequency of the signature population in T-helper cells and age among RRMS (n = 12), HC (n = 15), NINDC (n = 14), IDC (n = 9) and CIS (n =8) patients. Each symbol identifies an individual patient among CIS (n = 8), RRMS in remission (n = 8) or relapsing (n = 4) groups. The regression line with confidence intervals are based on the frequency of the signature population among the other control groups. (E) Correlation between frequencies of the CellCNN-defined immune signature and clinical parameters in RRMS in remission (n = 8) or relapsing (n = 3) and CIS (n = 8) patients. Regression curve with confidence intervals are depicted for each parameter. Boxplots depict the IQR with a white horizontal line representing the median. Whiskers extend to the farthest data point within a maximum of 1.5x IQR. P values are based on two-tailed Mann-Whitney-Wilcoxon tests between the groups. Linear correlation equation is calculated on the pool of all analysed samples. Every point represents one individual.
Extended Data Fig.8. Immune profiling of validation cohort.
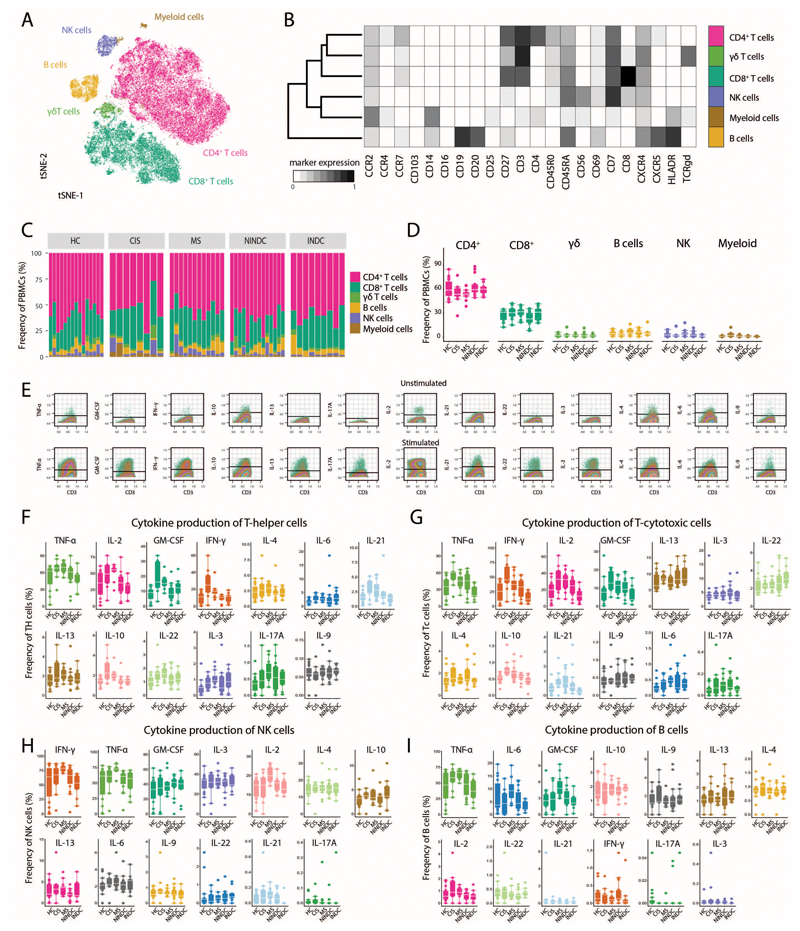
(A) PBMCs from RRMS (n = 12), HC (n = 15), NINDC (n = 14), IDC (n = 9) and CIS (n =8) patients were restimulated with PMA/ionomycin and analyzed by mass cytometry. The tSNE algorithm (20,000 cells, randomly selected from all samples) was used to depict different populations therein. FlowSOM-based immune cell populations are overlaid as a color dimension. (B) Mean population expression levels of all markers used for tSNE visualization and FlowSOM clustering. (C) Sample specific and (D) frequencies of immune cell lineages in peripheral leukocytes in RRMS (n = 12), HC (n = 15), NINDC (n = 14), IDC (n = 9) and CIS (n =8) patients. (E) Representative plot of cytokine staining in the unstimulated control (upper) and stimulated samples (lower). Cells randomly selected from the experimental run are shown. Positivity threshold was set on the residual staining as described in the methods section. Frequencies of cytokine production by Th cells (F), Tc cells (G), NK cells (H) and B cells (I) among RRMS (n = 12), HC (n = 15), NINDC (n = 14), IDC (n = 9) and CIS (n =8) patients. Boxplots depict the IQR with a white horizontal line representing the median. Whiskers extend to the farthest data point within a maximum of 1.5x IQR. Every point represents one individual.
Extended Data Fig.9. SDF1α induces signature-cells migration toward a chemokine gradient.
(A) Representative plots of gating strategy of immune cells populations (n = 7). (B) Frequency of migrating cells when SDF1α was added to the lower, upper or both chambers (n = 7). (C) Frequency migrating cells in the lower chamber toward an SDF1α gradient calculated as frequency of population specific input cells (n = 7). Representative plots (D) and quantification (E) of different cytokine-producing T-helper cells calculated as frequency of input cells (n = 7). Representative plots of 2 independent experiments. P values are based on two-tailed Mann-Whitney-Wilcoxon tests between the groups. Boxplots depict the IQR with a horizontal line representing the median. Columns plot represent the mean. Whiskers extend to the farthest data point within a maximum of 1.5x IQR. Every point represents one individual.
Extended Data Fig.10. CNS immune features of MS patients.
Quantification (A) of cell viability in paired PBMC- CSF-samples (n = 9). (B) Frequencies of immune cell lineages in CSF between fresh (n = 3) and cryopreserved (n = 9) CSF samples. (C) Scaffold reference map of the Th cell compartment was constructed from mass cytometry data. Grey bubbles represent the 100 FlowSOM nodes and colored landmarks are based on FlowSOM defined Th cell subsets. (D) Expression of CellCNN signature-defining cytokines and chemokine receptors within mapped FlowSOM nodes. (E) Immunohistochemistry of MS brain lesions depicting a demyelinated lesion (top left; myelin IHC) with KiM1P positive macrophages/activated microglial cells (top right, scale bar 200µm); CD3 positive perivenular T cell infiltration within the demyelinated lesion (bottom left) as well as in the meninges (bottom right, scale bar 30 µm). (F) Immunofluorescence control for secondary antibodies staining (left) and MS-brain lesion (right). Experiment repeated from brain biopsies of 3 individual MS patients as for Figure 6J. Scale bars = 30 µm. P values are based on two-tailed Mann-Whitney-Wilcoxon tests between the groups. Correlation coefficients (r) were calculated from the z-statistic of the Wilcoxon-Mann-Whitney test. Boxplots depict the IQR with a white horizontal line representing the median. Whiskers extend to the farthest data point within a maximum of 1.5x IQR. Every point represents one individual.
Supplementary Material
Acknowledgments
This work was supported by grants from the Swiss National Science Foundation (310030_170320, and 316030_150768, CRSII5_183478) (both to B.B.), the European Union FP7 projects NeuroKine (both to B.B.) and the Swiss Multiple Sclerosis Society (B.B.). F.J.H. received a van Riemsdijk PhD fellowship. Lymph node cryosections for establishing histological staining conditions were kindly provided by the tissue bank of the Institute of Pathology and Molecular Pathology of the University Hospital Zurich (USZ).
Footnotes
Data availability.
Mass cytometry and flow cytometry data analyzed in the manuscript (Figure 1-6) are available in a public repository and can be found at http://flowrepository.org/experiments/2166/. Patient-related data not included in the manuscript may be subject to patient confidentiality. The R-based custom workflow and source codes are available and can be found at https://github.com/GalliES/MS_manuscript.
Author contributions: E.G. designed and performed all cytometry experiments and analyzed the data of the validation cohort, DMF cohort and CSF samples. E.G. and F.J.H. designed and performed the cytometry experiments and analyzed the data of the discovery cohort and wrote the manuscript. B.S. and C.S. performed all histological analysis. F.I., performed cytometry experiments in the DMF cohort. D.M., C.K. and helped with the experiments. E.A. and M.C. performed the CellCNN analysis. T.D., N.S, M.D., C.S., F.v.d.M., M.K., F.A.N., F.P. and T.O. selected and characterized the patient cohorts. B.B. supervised and funded the study and wrote the manuscript.
Conflict of interest: T.O. has received unrestricted ms research grants from Biogen, Novartis, Sanofi, Merck and Roche. In addition lecture and or advisory board honoraria from the same companies. M.D. received speaker honoraria from Biogen Switzerland used exclusively for research purposes. F.P. has received research grants from Biogen, Genzyme, Merck KGaA and Novartis, and fees for serving as Chair of DMC in clinical trials with Parexel. T.D. received financial compensation for participation in advisory boards, steering committees, and data safety monitoring boards, and for consultation of Novartis Pharma, Merck, Biogen, Celgene, GeNeuro, Mitsubishi Pharma, MedDay, Roche, und Sanofi Genzyme. He received research support from Novartis and Biogen, the Swiss National research foundation, the European Union, and the Swiss MS Society.
References
- 1.Dendrou CA, Fugger L, Friese MA. Immunopathology of multiple sclerosis. Nat Rev Immunol. 2015;15(9):545–58. doi: 10.1038/nri3871. [DOI] [PubMed] [Google Scholar]
- 2.Krumbholz M, Derfuss T, Hohlfeld R, Meinl E. B cells and antibodies in multiple sclerosis pathogenesis and therapy. Nat Rev Neurol. 2012;8(11):613–23. doi: 10.1038/nrneurol.2012.203. [DOI] [PubMed] [Google Scholar]
- 3.Chanvillard C, Jacolik RF, Infante-Duarte C, Nayak RC. The role of natural killer cells in multiple sclerosis and their therapeutic implications. Front Immunol. 2013;4(63) doi: 10.3389/fimmu.2013.00063. [DOI] [PMC free article] [PubMed] [Google Scholar]
- 4.Mishra MK, Yong VW. Myeloid cells - targets of medication in multiple sclerosis. Nat Rev Neurol. 2016;12(9):539–51. doi: 10.1038/nrneurol.2016.110. [DOI] [PubMed] [Google Scholar]
- 5.Kleinewietfeld M, Hafler DA. Regulatory T cells in autoimmune neuroinflammation. Immunol Rev. 2014;259(1):231–44. doi: 10.1111/imr.12169. [DOI] [PMC free article] [PubMed] [Google Scholar]
- 6.Panitch HS, Hirsch RL, Haley AS, Johnson KP. Exacerbations of multiple sclerosis in patients treated with gamma interferon. Lancet. 1987;1(8538):893–5. doi: 10.1016/s0140-6736(87)92863-7. [DOI] [PubMed] [Google Scholar]
- 7.Olsson T, Zhi WW, Hojeberg B, Kostulas V, Jiang YP, Anderson G, Ekre HP, Link H. Autoreactive T lymphocytes in multiple sclerosis determined by antigen-induced secretion of interferon-gamma. J Clin Invest. 1990;86(3):981–5. doi: 10.1172/JCI114800. [DOI] [PMC free article] [PubMed] [Google Scholar]
- 8.Tzartos JS, Friese MA, Craner MJ, Palace J, Newcombe J, Esiri MM, Fugger L. Interleukin-17 production in central nervous system-infiltrating T cells and glial cells is associated with active disease in multiple sclerosis. Am J Pathol. 2008;172(1):146–55. doi: 10.2353/ajpath.2008.070690. [DOI] [PMC free article] [PubMed] [Google Scholar]
- 9.Noster R, Riedel R, Mashreghi MF, Radbruch H, Harms L, Haftmann C, Chang HD, Radbruch A, Zielinski CE. IL-17 and GM-CSF expression are antagonistically regulated by human T helper cells. Sci Transl Med. 2014;6(241):241ra80. doi: 10.1126/scitranslmed.3008706. [DOI] [PubMed] [Google Scholar]
- 10.Hartmann FJ, Khademi M, Aram J, Ammann S, Kockum I, Constantinescu C, Gran B, Piehl F, Olsson T, Codarri L, et al. Multiple sclerosis-associated IL2RA polymorphism controls GM-CSF production in human TH cells. Nature communications. 2014;5 doi: 10.1038/ncomms6056. 5056. [DOI] [PubMed] [Google Scholar]
- 11.Ornatsky O, Bandura D, Baranov V, Nitz M, Winnik MA, Tanner S. Highly multiparametric analysis by mass cytometry. J Immunol Methods. 2010;361(1–2):1–20. doi: 10.1016/j.jim.2010.07.002. [DOI] [PubMed] [Google Scholar]
- 12.Bendall SC, Nolan GP, Roederer M, Chattopadhyay PK. A deep profiler's guide to cytometry. Trends Immunol. 2012;33(7):323–32. doi: 10.1016/j.it.2012.02.010. [DOI] [PMC free article] [PubMed] [Google Scholar]
- 13.Galli E, Friebel E, Ingelfinger F, Unger S, Nunez NG, Becher B. The end of omics? High dimensional single cell analysis in precision medicine. European journal of immunology. 2019 doi: 10.1002/eji.201847758. [DOI] [PubMed] [Google Scholar]
- 14.Qiu P, Simonds EF, Bendall SC, Gibbs KD, Jr, Bruggner RV, Linderman MD, Sachs K, Nolan GP, Plevritis SK. Extracting a cellular hierarchy from high-dimensional cytometry data with SPADE. Nat Biotechnol. 2011;29(10):886–91. doi: 10.1038/nbt.1991. [DOI] [PMC free article] [PubMed] [Google Scholar]
- 15.Levine JH, Simonds EF, Bendall SC, Davis KL, Amir el AD, Tadmor MD, Litvin O, Fienberg HG, Jager A, Zunder ER, et al. Data-Driven Phenotypic Dissection of AML Reveals Progenitor-like Cells that Correlate with Prognosis. Cell. 2015;162(1):184–97. doi: 10.1016/j.cell.2015.05.047. [DOI] [PMC free article] [PubMed] [Google Scholar]
- 16.Van Gassen S, Callebaut B, Van Helden MJ, Lambrecht BN, Demeester P, Dhaene T, Saeys Y. FlowSOM: Using self-organizing maps for visualization and interpretation of cytometry data. Cytometry A. 2015;87(7):636–45. doi: 10.1002/cyto.a.22625. [DOI] [PubMed] [Google Scholar]
- 17.Bruggner RV, Bodenmiller B, Dill DL, Tibshirani RJ, Nolan GP. Automated identification of stratifying signatures in cellular subpopulations. Proc Natl Acad Sci U S A. 2014;111(26):E2770–7. doi: 10.1073/pnas.1408792111. [DOI] [PMC free article] [PubMed] [Google Scholar]
- 18.Arvaniti E, Claassen M. Sensitive detection of rare disease-associated cell subsets via representation learning. Nat Commun. 2017;8 doi: 10.1038/ncomms14825. 14825. [DOI] [PMC free article] [PubMed] [Google Scholar]
- 19.Hartmann FJ, Bernard-Valnet R, Queriault C, Mrdjen D, Weber LM, Galli E, Krieg C, Robinson MD, Nguyen XH, Dauvilliers Y, et al. High-dimensional single-cell analysis reveals the immune signature of narcolepsy. The Journal of experimental medicine. 2016;213(12):2621–33. doi: 10.1084/jem.20160897. [DOI] [PMC free article] [PubMed] [Google Scholar]
- 20.Rao DA, Gurish MF, Marshall JL, Slowikowski K, Fonseka CY, Liu Y, Donlin LT, Henderson LA, Wei K, Mizoguchi F, et al. Pathologically expanded peripheral T helper cell subset drives B cells in rheumatoid arthritis. Nature. 2017;542(7639):110–4. doi: 10.1038/nature20810. [DOI] [PMC free article] [PubMed] [Google Scholar]
- 21.Weber LM, Robinson MD. Comparison of clustering methods for high-dimensional single-cell flow and mass cytometry data. Cytometry A. 2016;89(12):1084–96. doi: 10.1002/cyto.a.23030. [DOI] [PubMed] [Google Scholar]
- 22.Pietschmann P, Gollob E, Brosch S, Hahn P, Kudlacek S, Willheim M, Woloszczuk W, Peterlik M, Tragl KH. The effect of age and gender on cytokine production by human peripheral blood mononuclear cells and markers of bone metabolism. Experimental gerontology. 2003;38(10):1119–27. doi: 10.1016/s0531-5565(03)00189-x. [DOI] [PubMed] [Google Scholar]
- 23.Andreakos ET, Foxwell BM, Brennan FM, Maini RN, Feldmann M. Cytokines and anti-cytokine biologicals in autoimmunity: present and future. Cytokine Growth Factor Rev. 2002;13(4–5):299–313. doi: 10.1016/s1359-6101(02)00018-7. [DOI] [PubMed] [Google Scholar]
- 24.Rasouli J, Ciric B, Imitola J, Gonnella P, Hwang D, Mahajan K, Mari ER, Safavi F, Leist TP, Zhang GX, et al. Expression of GM-CSF in T Cells Is Increased in Multiple Sclerosis and Suppressed by IFN-beta Therapy. J Immunol. 2015;194(11):5085–93. doi: 10.4049/jimmunol.1403243. [DOI] [PMC free article] [PubMed] [Google Scholar]
- 25.Herndler-Brandstetter D, Flavell RA. Producing GM-CSF: a unique T helper subset? Cell Res. 2014;24(12):1379–80. doi: 10.1038/cr.2014.155. [DOI] [PMC free article] [PubMed] [Google Scholar]
- 26.Cheng Y, Wong MT, van der Maaten L, Newell EW. Categorical Analysis of Human T Cell Heterogeneity with One-Dimensional Soli-Expression by Nonlinear Stochastic Embedding. J Immunol. 2016;196(2):924–32. doi: 10.4049/jimmunol.1501928. [DOI] [PMC free article] [PubMed] [Google Scholar]
- 27.O'Gorman WE, Hsieh EWY, Savig ES, Gherardini PF, Hernandez JD, Hansmann L, Balboni IM, Utz PJ, Bendall SC, Fantl WJ, et al. Single-cell systems-level analysis of human Toll-like receptor activation defines a chemokine signature in patients with systemic lupus erythematosus. Journal of Allergy and Clinical Immunology. 2015;136:1326–36. doi: 10.1016/j.jaci.2015.04.008. [DOI] [PMC free article] [PubMed] [Google Scholar]
- 28.Hauser SL, Bar-Or A, Comi G, Giovannoni G, Hartung HP, Hemmer B, Lublin F, Montalban X, Rammohan KW, Selmaj K, et al. Ocrelizumab versus Interferon Beta-1a in Relapsing Multiple Sclerosis. N Engl J Med. 2017;376(3):221–34. doi: 10.1056/NEJMoa1601277. [DOI] [PubMed] [Google Scholar]
- 29.Hauser SL, Waubant E, Arnold DL, Vollmer T, Antel J, Fox RJ, Bar-Or A, Panzara M, Sarkar N, Agarwal S, et al. B-cell depletion with rituximab in relapsing-remitting multiple sclerosis. N Engl J Med. 2008;358(7):676–88. doi: 10.1056/NEJMoa0706383. [DOI] [PubMed] [Google Scholar]
- 30.Rice GP, Hartung HP, Calabresi PA. Anti-alpha4 integrin therapy for multiple sclerosis: mechanisms and rationale. Neurology. 2005;64(8):1336–42. doi: 10.1212/01.WNL.0000158329.30470.D0. [DOI] [PubMed] [Google Scholar]
- 31.Gold R, Kappos L, Arnold DL, Bar-Or A, Giovannoni G, Selmaj K, Tornatore C, Sweetser MT, Yang M, Sheikh SI, et al. Placebo-controlled phase 3 study of oral BG-12 for relapsing multiple sclerosis. The New England journal of medicine. 2012;367(12):1098–107. doi: 10.1056/NEJMoa1114287. [DOI] [PubMed] [Google Scholar]
- 32.Fox RJ, Miller DH, Phillips JT, Hutchinson M, Havrdova E, Kita M, Yang M, Raghupathi K, Novas M, Sweetser MT, et al. Placebo-controlled phase 3 study of oral BG-12 or glatiramer in multiple sclerosis. The New England journal of medicine. 2012;367(12):1087–97. doi: 10.1056/NEJMoa1206328. [DOI] [PubMed] [Google Scholar]
- 33.Spencer CM, Crabtree-Hartman EC, Lehmann-Horn K, Cree BA, Zamvil SS. Reduction of CD8(+) T lymphocytes in multiple sclerosis patients treated with dimethyl fumarate. Neurology(R) neuroimmunology & neuroinflammation. 2015;2(3):e76. doi: 10.1212/NXI.0000000000000076. [DOI] [PMC free article] [PubMed] [Google Scholar]
- 34.Gross CC, Schulte-Mecklenbeck A, Klinsing S, Posevitz-Fejfar A, Wiendl H, Klotz L. Dimethyl fumarate treatment alters circulating T helper cell subsets in multiple sclerosis. Neurology(R) neuroimmunology & neuroinflammation. 2016;3(1):e183. doi: 10.1212/NXI.0000000000000183. [DOI] [PMC free article] [PubMed] [Google Scholar]
- 35.Wu Q, Wang Q, Mao G, Dowling CA, Lundy SK, Mao-Draayer Y. Dimethyl Fumarate Selectively Reduces Memory T Cells and Shifts the Balance between Th1/Th17 and Th2 in Multiple Sclerosis Patients. J Immunol. 2017;198(8):3069–80. doi: 10.4049/jimmunol.1601532. [DOI] [PMC free article] [PubMed] [Google Scholar]
- 36.Li R, Rezk A, Ghadiri M, Luessi F, Zipp F, Li H, Giacomini PS, Antel J, Bar-Or A. Dimethyl Fumarate Treatment Mediates an Anti-Inflammatory Shift in B Cell Subsets of Patients with Multiple Sclerosis. J Immunol. 2017;198(2):691–8. doi: 10.4049/jimmunol.1601649. [DOI] [PubMed] [Google Scholar]
- 37.Diebold M, Sievers C, Bantug G, Sanderson N, Kappos L, Kuhle J, Lindberg RLP, Derfuss T. Dimethyl fumarate influences innate and adaptive immunity in multiple sclerosis. J Autoimmun. 2018;86:39–50. doi: 10.1016/j.jaut.2017.09.009. [DOI] [PubMed] [Google Scholar]
- 38.McCandless EE, Piccio L, Woerner BM, Schmidt RE, Rubin JB, Cross AH, Klein RS. Pathological expression of CXCL12 at the blood-brain barrier correlates with severity of multiple sclerosis. The American journal of pathology. 2008;172(3):799–808. doi: 10.2353/ajpath.2008.070918. [DOI] [PMC free article] [PubMed] [Google Scholar]
- 39.Holman DW, Klein RS, Ransohoff RM. The blood-brain barrier, chemokines and multiple sclerosis. Biochimica et biophysica acta. 2011;1812(2):220–30. doi: 10.1016/j.bbadis.2010.07.019. [DOI] [PMC free article] [PubMed] [Google Scholar]
- 40.Kowarik MC, Pellkofer HL, Cepok S, Korn T, Kumpfel T, Buck D, Hohlfeld R, Berthele A, Hemmer B. Differential effects of fingolimod (FTY720) on immune cells in the CSF and blood of patients with MS. Neurology. 2011;76(14):1214–21. doi: 10.1212/WNL.0b013e3182143564. [DOI] [PubMed] [Google Scholar]
- 41.Kowarik MC, Grummel V, Wemlinger S, Buck D, Weber MS, Berthele A, Hemmer B. Immune cell subtyping in the cerebrospinal fluid of patients with neurological diseases. J Neurol. 2014;261(1):130–43. doi: 10.1007/s00415-013-7145-2. [DOI] [PubMed] [Google Scholar]
- 42.Spitzer MH, Gherardini PF, Fragiadakis GK, Bhattacharya N, Yuan RT, Hotson AN, Finck R, Carmi Y, Zunder ER, Fantl WJ, et al. IMMUNOLOGY. An interactive reference framework for modeling a dynamic immune system. Science. 2015;349(6244) doi: 10.1126/science.1259425. 1259425. [DOI] [PMC free article] [PubMed] [Google Scholar]
- 43.Croxford AL, Lanzinger M, Hartmann FJ, Schreiner B, Mair F, Pelczar P, Clausen BE, Jung S, Greter M, Becher B. The Cytokine GM-CSF Drives the Inflammatory Signature of CCR2+ Monocytes and Licenses Autoimmunity. Immunity. 2015;43(3):502–14. doi: 10.1016/j.immuni.2015.08.010. [DOI] [PubMed] [Google Scholar]
- 44.Croxford AL, Spath S, Becher B. GM-CSF in Neuroinflammation: Licensing Myeloid Cells for Tissue Damage. Trends in immunology. 2015;36(10):651–62. doi: 10.1016/j.it.2015.08.004. [DOI] [PubMed] [Google Scholar]
- 45.Komuczki J, Tuzlak S, Friebel E, Hartwig T, Spath S, Rosenstiel P, Waisman A, Opitz L, Oukka M, Schreiner B, et al. Fate-Mapping of GM-CSF Expression Identifies a Discrete Subset of Inflammation-Driving T Helper Cells Regulated by Cytokines IL-23 and IL-1beta. Immunity. 2019;50(5):1289–304 e6. doi: 10.1016/j.immuni.2019.04.006. [DOI] [PubMed] [Google Scholar]
- 46.Spath S, Komuczki J, Hermann M, Pelczar P, Mair F, Schreiner B, Becher B. Dysregulation of the Cytokine GM-CSF Induces Spontaneous Phagocyte Invasion and Immunopathology in the Central Nervous System. Immunity. 2017;46(2):245–60. doi: 10.1016/j.immuni.2017.01.007. [DOI] [PubMed] [Google Scholar]
- 47.Codarri L, Gyulveszi G, Tosevski V, Hesske L, Fontana A, Magnenat L, Suter T, Becher B. RORgammat drives production of the cytokine GM-CSF in helper T cells, which is essential for the effector phase of autoimmune neuroinflammation. Nature immunology. 2011;12(6):560–7. doi: 10.1038/ni.2027. [DOI] [PubMed] [Google Scholar]
- 48.Imitola J, Rasouli J, Watanabe F, Mahajan K, Sharan AD, Ciric B, Zhang GX, Rostami A. Elevated expression of granulocyte-macrophage colony-stimulating factor receptor in multiple sclerosis lesions. Journal of neuroimmunology. 2018;317:45–54. doi: 10.1016/j.jneuroim.2017.12.017. [DOI] [PMC free article] [PubMed] [Google Scholar]
- 49.Sheng W, Yang F, Zhou Y, Yang H, Low PY, Kemeny DM, Tan P, Moh A, Kaplan MH, Zhang Y, et al. STAT5 programs a distinct subset of GM-CSF-producing T helper cells that is essential for autoimmune neuroinflammation. Cell research. 2014;24(12):1387–402. doi: 10.1038/cr.2014.154. [DOI] [PMC free article] [PubMed] [Google Scholar]
- 50.Constantinescu CS, Asher A, Fryze W, Kozubski W, Wagner F, Aram J, Tanasescu R, Korolkiewicz RP, Dirnberger-Hertweck M, Steidl S, et al. Randomized phase 1b trial of MOR103, a human antibody to GM-CSF, in multiple sclerosis. Neurol Neuroimmunol Neuroinflamm. 2015;2(4):e117. doi: 10.1212/NXI.0000000000000117. [DOI] [PMC free article] [PubMed] [Google Scholar]
- 51.Barr TA, Shen P, Brown S, Lampropoulou V, Roch T, Lawrie S, Fan B, O'Connor RA, Anderton SM, Bar-Or A, et al. B cell depletion therapy ameliorates autoimmune disease through ablation of IL-6-producing B cells. J Exp Med. 2012;209(5):1001–10. doi: 10.1084/jem.20111675. [DOI] [PMC free article] [PubMed] [Google Scholar]
- 52.Duddy M, Niino M, Adatia F, Hebert S, Freedman M, Atkins H, Kim HJ, Bar-Or A. Distinct effector cytokine profiles of memory and naive human B cell subsets and implication in multiple sclerosis. J Immunol. 2007;178(10):6092–9. doi: 10.4049/jimmunol.178.10.6092. [DOI] [PubMed] [Google Scholar]
- 53.Jelcic I, Al Nimer F, Wang J, Lentsch V, Planas R, Jelcic I, Madjovski A, Ruhrmann S, Faigle W, Frauenknecht K, et al. Memory B Cells Activate Brain-Homing, Autoreactive CD4(+) T Cells in Multiple Sclerosis. Cell. 2018;175(1):85–100 e23. doi: 10.1016/j.cell.2018.08.011. [DOI] [PMC free article] [PubMed] [Google Scholar]
- 54.Krumbholz M, Theil D, Cepok S, Hemmer B, Kivisakk P, Ransohoff RM, Hofbauer M, Farina C, Derfuss T, Hartle C, et al. Chemokines in multiple sclerosis: CXCL12 and CXCL13 up-regulation is differentially linked to CNS immune cell recruitment. Brain : a journal of neurology. 2006;129(Pt 1):200–11. doi: 10.1093/brain/awh680. [DOI] [PubMed] [Google Scholar]
- 55.Giunti D, Borsellino G, Benelli R, Marchese M, Capello E, Valle MT, Pedemonte E, Noonan D, Albini A, Bernardi G, et al. Phenotypic and functional analysis of T cells homing into the CSF of subjects with inflammatory diseases of the CNS. Journal of leukocyte biology. 2003;73(5):584–90. doi: 10.1189/jlb.1202598. [DOI] [PubMed] [Google Scholar]
- 56.Calderon TM, Eugenin EA, Lopez L, Kumar SS, Hesselgesser J, Raine CS, Berman JW. A role for CXCL12 (SDF-1alpha) in the pathogenesis of multiple sclerosis: regulation of CXCL12 expression in astrocytes by soluble myelin basic protein. Journal of neuroimmunology. 2006;177(1–2):27–39. doi: 10.1016/j.jneuroim.2006.05.003. [DOI] [PubMed] [Google Scholar]
- 57.Restorick SM, Durant L, Kalra S, Hassan-Smith G, Rathbone E, Douglas MR, Curnow SJ. CCR6(+) Th cells in the cerebrospinal fluid of persons with multiple sclerosis are dominated by pathogenic non-classic Th1 cells and GM-CSF-only-secreting Th cells. Brain Behav Immun. 2017;64:71–9. doi: 10.1016/j.bbi.2017.03.008. [DOI] [PMC free article] [PubMed] [Google Scholar]
- 58.Brucklacher-Waldert V, Stuerner K, Kolster M, Wolthausen J, Tolosa E. Phenotypical and functional characterization of T helper 17 cells in multiple sclerosis. Brain. 2009;132(Pt 12):3329–41. doi: 10.1093/brain/awp289. [DOI] [PubMed] [Google Scholar]
- 59.Kornberg MD, Bhargava P, Kim PM, Putluri V, Snowman AM, Putluri N, Calabresi PA, Snyder SH. Dimethyl fumarate targets GAPDH and aerobic glycolysis to modulate immunity. Science. 2018;360(6387):449–53. doi: 10.1126/science.aan4665. [DOI] [PMC free article] [PubMed] [Google Scholar]
- 60.Polman CH, Reingold SC, Banwell B, Clanet M, Cohen JA, Filippi M, Fujihara K, Havrdova E, Hutchinson M, Kappos L, et al. Diagnostic criteria for multiple sclerosis: 2010 revisions to the McDonald criteria. Ann Neurol. 2011;69(2):292–302. doi: 10.1002/ana.22366. [DOI] [PMC free article] [PubMed] [Google Scholar]
- 61.Teunissen C, Menge T, Altintas A, Alvarez-Cermeno JC, Bertolotto A, Berven FS, Brundin L, Comabella M, Degn M, Deisenhammer F, et al. Consensus definitions and application guidelines for control groups in cerebrospinal fluid biomarker studies in multiple sclerosis. Mult Scler. 2013;19(13):1802–9. doi: 10.1177/1352458513488232. [DOI] [PubMed] [Google Scholar]
- 62.Thompson AJ, Banwell BL, Barkhof F, Carroll WM, Coetzee T, Comi G, Correale J, Fazekas F, Filippi M, Freedman MS, et al. Diagnosis of multiple sclerosis: 2017 revisions of the McDonald criteria. Lancet Neurol. 2018;17(2):162–73. doi: 10.1016/S1474-4422(17)30470-2. [DOI] [PubMed] [Google Scholar]
- 63.Mei HE, Leipold MD, Schulz AR, Chester C, Maecker HT. Barcoding of live human peripheral blood mononuclear cells for multiplexed mass cytometry. J Immunol. 2015;194(4):2022–31. doi: 10.4049/jimmunol.1402661. [DOI] [PMC free article] [PubMed] [Google Scholar]
- 64.Zunder ER, Finck R, Behbehani GK, Amir el AD, Krishnaswamy S, Gonzalez VD, Lorang CG, Bjornson Z, Spitzer MH, Bodenmiller B, et al. Palladium-based mass tag cell barcoding with a doublet-filtering scheme and single-cell deconvolution algorithm. Nature protocols. 2015;10(2):316–33. doi: 10.1038/nprot.2015.020. [DOI] [PMC free article] [PubMed] [Google Scholar]
- 65.Finck R, Simonds EF, Jager A, Krishnaswamy S, Sachs K, Fantl W, Pe'er D, Nolan GP, Bendall SC. Normalization of mass cytometry data with bead standards. Cytometry A. 2013;83(5):483–94. doi: 10.1002/cyto.a.22271. [DOI] [PMC free article] [PubMed] [Google Scholar]
- 66.R Development Core Team. R: A language and Environment for Statistical Computing. Vienna, Austria: 2010. [Google Scholar]
- 67.Spitzer MH, Carmi Y, Reticker-Flynn NE, Kwek SS, Madhireddy D, Martins MM, Gherardini PF, Prestwood TR, Chabon J, Bendall SC, et al. Systemic Immunity Is Required for Effective Cancer Immunotherapy. Cell. 2017;168(3):487–502 e15. doi: 10.1016/j.cell.2016.12.022. [DOI] [PMC free article] [PubMed] [Google Scholar]
- 68.Poznansky MC, Olszak IT, Foxall R, Evans RH, Luster AD, Scadden DT. Active movement of T cells away from a chemokine. Nature medicine. 2000;6(5):543–8. doi: 10.1038/75022. [DOI] [PubMed] [Google Scholar]
- 69.Noble WS. How does multiple testing correction work? Nat Biotechnol. 2009;27(12):1135–7. doi: 10.1038/nbt1209-1135. [DOI] [PMC free article] [PubMed] [Google Scholar]
- 70.McDonald J. Handbook of Biological Statistic. 3rd, ed. Sparky House Publishing; Baltimore, Maryland: 2014. [Google Scholar]
- 71.Youden WJ. Index for rating diagnostic tests. Cancer. 1950;3(1):32–5. doi: 10.1002/1097-0142(1950)3:1<32::aid-cncr2820030106>3.0.co;2-3. [DOI] [PubMed] [Google Scholar]
Associated Data
This section collects any data citations, data availability statements, or supplementary materials included in this article.


