

Abstract
Animal body coloration is a complex trait resulting from the interplay of multiple mechanisms. While many studies address the functions of animal coloration, the mechanisms of colour production still remain unknown in most taxa. Here we compare reflectance spectra, cellular, ultra- and nano-structure of colour-producing elements, and pigment types in two freshwater turtles with contrasting courtship behaviour, Trachemys scripta and Pseudemys concinna. The two species differ in the distribution of pigment cell-types and in pigment diversity. We found xanthophores, melanocytes, abundant iridophores and dermal collagen fibres in stripes of both species. The yellow chin and forelimb stripes of both P. concinna and T. scripta contain xanthophores and iridophores, but the post-orbital regions of the two species differ in cell-type distribution. The yellow post-orbital region of P. concinna contains both xanthophores and iridophores, while T. scripta has only xanthophores in the yellow-red postorbital/zygomatic regions. Moreover, in both species, the xanthophores colouring the yellow-red skin contain carotenoids, pterins and riboflavin, but T. scripta has a higher diversity of pigments than P. concinna. Trachemys s. elegans is sexually dichromatic. Differences in the distribution of pigment cell types across body regions in the two species may be related to visual signalling but do not match predictions based on courtship position. Our results demonstrate that archelosaurs share some colour production mechanisms with amphibians and lepidosaurs (i.e. vertical layering/stacking of different pigment cell types and interplay of carotenoids and pterins), but also employ novel mechanisms (i.e. nano-organization of dermal collagen) shared with mammals.
Keywords: Chelonia, Trachemys scripta, Pseudemys concinna, nanostructure, pigments, chromatophores
1. Introduction
Identifying the evolutionary origins and the selective processes responsible for the maintenance of complex morphological traits remains a persistent challenge in biology. Animal coloration is a complex morphological trait resulting from the interaction of multiple elements that evolve for various roles and only later are co-opted to produce colour [1,2]. Variation in body coloration during evolution is the result of two processes [3]: the integration of colour-producing elements to produce a given colour [4], and the independent development and evolution of those same colour-producing elements [5]. The intricate relationships between colour-producing elements and their functional roles stress the need to study the proximate causes of colour production [6]. While there has been progress in our understanding of the functions of animal coloration [7,8], our knowledge of colour production mechanisms in most groups of animals is still scarce.
Animal colours are produced by ultrastructural elements of the integument interacting with incident light, by light-absorbing pigments, or by a combination of both. In vertebrates, the majority of compounds responsible for the coloration of the integument are found in pigment cells which are derived from the neural crest [9–11]. Pigment cells are classified into five types: reflecting dermal pigment cells (iridophores, leucophores), absorbing dermal pigment cells (xanthophores, erythrophores, cyanophores), melanocytes with non-motile organelles (dermal melanocytes), melanocytes with motile organelles (dermal melanophores), and organelle transferring melanocytes (interfollicular and follicular epidermal melanocytes) [12].
Iridophores contain reflecting platelets of mainly guanine, while absorbing dermal pigment cells contain pterins in pterinosomes, or carotenoids dissolved in lipids in carotenoid vesicles. Melanocytes and melanophores contain melanins in melanosomes. Single cells with characteristics of two or more pigment cell types, e.g. xanthophore and iridophore, are occasionally found and are known as mosaic chromatophores [13,14]. Often, pigment cells of the same type are organized in more or less continuous layers that are roughly parallel to the skin surface. The vertical layering and relative thickness of the different pigment cells, thickness, orientation, number, and geometry of reflecting elements, as well as characteristics of the pigments within the cells determine the final colour of the skin [8,15,16]. Ectodermal keratinocytes (epidermis) and mesenchymal fibroblasts (dermis) also participate in colour production via reflection of light on the intra/extracellular protein matrix these cells produce [17–21].
Turtles are an early-diverging clade of Archelosauria, the evolutionary lineage of tetrapods leading to crocodiles and birds [22]. Although many turtles have a uniform dull colour, conspicuous striped and spotted patterns are common in all major lineages (for a comprehensive collection of photographs see [23–26]). These conspicuous colour patterns may be present in the hard-horny skin of shells, and/or in the soft skin of the head, limbs or tail. The dark areas of the skin of turtles may have a threefold origin consisting either of dermal, epidermal, or both epidermal and dermal melanocytes. Colourful bright regions are thought to be the result of the presence of xanthophores in the dermis [27] and their interplay with dermal melanophores [28]. Iridophores have not been shown to play a role in the coloration of turtles [27,29].
Pigment-bearing xanthophores were first described in the dermis of the Chinese softshell turtle (Pelodiscus sinensis) [29]. Xanthophores have also been found sporadically in the dermis of the spiny softshell turtle Apalone spinifera, the Murray river turtle (Emydura macquarii) and in the painted turtle (Chrysemys picta) [27]. Such scarcity of carotenoid/pterin-containing cells is in contrast with chemical analyses of the yellow and red regions of the integument in C. picta and in the red-eared slider (Trachemys scripta elegans) [30,31]. Two major classes of carotenoids have been described in the integument of these turtles: short wavelength-absorbing apocarotenoids and longer wavelength-absorbing ketocarotenoids [30]. In addition to carotenoids, Steffen et al. [30] speculated that small quantities of some pterin could play a minor role in colour production in the integument of turtles. In support of this hypothesis, Alibardi [27] observed pterinosomes with characteristic concentric lamellae in the xanthophores of turtles. In the skin of the Japanese pond turtle (Mauremys japonica), Odate et al. [32] found two colourless pterins (biopterin and pterin-6-carboxylic acid) but did not find pterin, the precursor of yellowish xanthopterin, or isoxanthopterin. Thus, to this day there is no conclusive evidence of pterins playing a role in colour production in the skin of turtles, or in the skin of any other archelosaur.
Deirochelyinae are freshwater turtles of the family Emydidae, all of which, except one species (the diamond-back terrapin, Malaclemys terrapin), display a pattern of conspicuous stripes on the skin of the head and legs [33,34]. This striped pattern usually consists of alternating yellow and black regions, but red regions are also found in some species. The coloration of deirocheline turtles is thought to play a role in mate choice [30,35]. Some species are sexually dichromatic, with males often displaying the brightest, most conspicuous colours (reviewed in [19]); however sexual dichromatism is limited to particular regions of the body [36,37]. It has been suggested that some of the colourful regions found particularly in males may potentially be involved in intersexual communication and mate choice [36,38]. Colour ornaments are designed to maximize their conspicuousness only in certain, ethologically relevant contexts [39], e.g. when exposed to rivals during contests or to mates during courtship [40,41]. Courtship in freshwater turtles takes place underwater and males adopt characteristic positions relative to the female [42]. Deirocheline turtles are characterized by elaborate courtship behaviour including a complex forelimb display known as titillation [42]. Males in most species of deirocheline turtles perform the titillation display facing the female while swimming backwards in front of her, close to the water surface; however, males of the genus Pseudemys titillate while swimming above and parallel to the female, facing the same direction as her [42–47]. Thus, depending on the position adopted during courtship (face-to-face versus swim above) males of different species expose different body areas to females. By comparing different deirocheline species, it may be possible to examine whether there is a relationship between colour and colour-producing mechanisms and courtship position in these turtles.
In this study we compare the structure and pigment types of striped skin in two species of deirocheline freshwater turtles, the pond slider (Trachemys scripta) and the river cooter (Pseudemys concinna), with contrasting courtship behaviour. Males of T. scripta court females in a face-to-face position while males of P. concinna court females in a swim-above position. To determine if colour production mechanisms differ depending on the species-specific male position during courtship, we describe the cellular and ultrastructural make-up of those body regions that likely play a role during courtship behaviour (head, limbs) and the chemical nature of pigments involved in colour production. We combine multiple approaches to study the mechanisms of colour production: (i) reflectance spectrophotometry to objectively determine the colour of the turtles' body surfaces, (ii) transmission electron microscopy and image analyses to study the structure of the skin and the ultrastructure of colour-producing elements, and (iii) liquid chromatography coupled with mass spectrometry to determine the contribution of carotenoids/pterins to the turtles' coloration. We predict that regions of the skin that males expose during courtship to females should be more conspicuous and richer in pigment types than regions not exposed during courtship. Specifically, in P. concinna we expect the yellow chin to be sexually dichromatic, conspicuous and rich in pigment types compared to other skin surfaces. In T. scripta, on the other hand, we expect all regions exposed during courtship, i.e. dorsal and ventral head and limbs, to be sexually dichromatic, conspicuous and rich in pigment types.
2. Material and methods
2.1. Animals and handling
Two species of freshwater turtles, Trachemys scripta and Pseudemys concinna, were collected for purposes of control of invasive freshwater turtles as a follow-up to project ‘LIFE-Trachemys’ (LIFE09 NAT/ES000529) to the Servicio de Vida Silvestre, D.G. Medi Natural (Generalitat Valenciana). Turtles (P. concinna: 4 males, 8 females; T. s. elegans: 42 males, 39 females; T. s. scripta: 1 male, 2 females) were captured during 2014–2017 with floating or hoop traps in coastal marshes or artificial ponds at several localities in the Comunidad Valenciana (Spain). Turtles were euthanized with an overdose of sodium pentobarbital (Eutanax, Fatro Ibérica, S.L) by authorized personnel. As all applicable international, national and/or institutional guidelines for the care and use of animals were followed (see ethical statement) no other permissions were required prior to conducting this research.
2.2. Spectral reflectance measurements
Pseudemys concinna and the yellow-bellied slider (T. s. scripta) have only yellow stripes on the head, while T. s. elegans also has red markings in the postorbital region. To quantify colour, we measured the spectral reflectance of turtle skin between 300 and 700 nm using a spectrophotometer. Reflectance spectra were taken before euthanasia with an Ocean Optics Jaz System (QR400-7-SR-BX: 400 µm reflection probe attached to JAZ-UV-VIS: Deuterium-Tungsten light source module) and a SONY Vaio computer running SpectraSuite software (Ocean Optics, Dunedin, Florida). The internal trigger was set to 30, integration time to 30, scans average to 30 and boxcar width to 10. The system was calibrated using a Spectralon WS-1 white diffuse reflectance standard, also from Ocean Optics. Reflectance spectra were taken in a darkened room using a hand-held probe oriented perpendicular to the skin surface (i.e. coincident normal measuring geometry [48]). An entomological pin (with acrylic head down) attached to the side of the probe allowed us to maintain a fixed 5 mm distance between the probe and the skin surface. Turtles were kept alive in clean water inside black plastic tanks and the skin surface was dried with a piece of cloth just before taking reflectance measurements. The main median chin yellow stripe (CBC), dorsal head background coloration (DHC), main bright/yellow forelimb stripe (FLBS) and the postorbital marking on the left side (PM) were measured in all specimens of P. concinna and T. s. elegans (figure 1). Unfortunately, as T. s. scripta is rarely found in the Valencia region, reflectance spectra could be obtained from only one specimen (a male). The yellow zygomatic patch (ZP) instead of the PM was measured in T. s. scripta (figure 1b). Adult males of T. s. elegans become melanistic as they get older [49]; therefore, we have not included in our analyses reflectance spectra of 12 males determined as melanistic.
Figure 1.

Photographs of skin regions examined in this study. (a) Lateral view of the head of Trachemys scripta elegans; (b) lateral view of the head of female of Trachemys scripta scripta; (c) lateral view of head of female Pseudemys concinna; (d) ventral side of head of female of T. scripta; (e) front limb of T. scripta; (f) ventral side of P. concinna; (g) front limb of P. concinna. CBC: main median chin yellow stripe; DHC: dorsal head background coloration; FLBS: main bright stripe of the fore limb; PM: postorbital marking; ZP: yellow zygomatic patch.
2.3. Processing and statistical analyses of reflectance spectra
Reflectance spectra binned by 0.37 nm were restricted to the range between 300 and 700 nm. Calculations were performed in R 3.3.2 [50] using the package PAVO [51]. Spectra were processed by smoothing (span = 0.3) and negative values were fixed to be zero. Processed reflectance spectra from each region of each individual of each taxon were summarized by the following variables: luminance or brightness (B1: sum of the relative reflectance over the entire spectral range), hue (H1: wavelength of maximum reflectance), and chroma (relative contribution of a spectral range to total brightness). We calculated five measures of chroma based on the wavelength ranges normally associated with specific colour hues: 300–400 nm (S1.UV), 400–510 nm (S1.blue), 510–605 nm (S1.green), 550–625 nm (S1.yellow), 605–700 nm (S1.red) [51–53]. Reflectance spectra of T. s. scripta were not included in the statistical analyses due to the small sample size available for this lineage. To analyse the contribution of summary variables to differences among species as well as sexes, we performed redundancy analyses (RDA) using the package vegan in R [54]. To overcome difficulties with different scales and variances of summary variables we standardized the data by scaling to zero mean and unit variance [55]. Species identity was the first constraining variable in the RDA to compare P. concinna and T. s. elegans. While testing for differences among species we also controlled for sex in the RDA as a second constraining variable to test for sexual dichromatism. Significance of results was assessed by ANOVA-like permutation tests (9999 permutations) for redundancy analysis (anova.cca) using the vegan package. Partition of variation with respect to explanatory variables (species identity and sex) was assessed using the varpart function also from the vegan package. We also analysed species separately; for this we performed RDA for each species, tested for its significance by anova.cca, and compared means of summary variables between the sexes by ANOVA with Holm's correction for multiple comparisons (see R script of all the analyses at [56]).
2.4. Microscopy
To investigate the cellular composition of the turtles' integument we took samples from CBC, FLBS and PM regions of P. concinna (females = 2) and CBC, DHC, FLBS and PM regions of T. s. elegans (normal males = 3, melanistic males = 2, females = 3). We also took samples of the CBC, PM and ZP of T. s. scripta (female = 2). Pieces of integument measuring ca 1 cm2 from target regions were excised immediately after sacrifice and placed in Karnovsky's fixative (2% paraformaldehyde, 2.5% glutaraldehyde in PB buffer), left overnight at room temperature, and stored in the refrigerator at 4°C for 7 days. Smaller pieces (ca 2 mm3) were cut from the original pieces of tissue. These were washed with 0.1 M PB, postfixed with 2% osmium tetra oxide (in 0.1 M PB solution), dehydrated in an increasing ethanol series, washed with 2% uranyl acetate in 70% ethanol, washed in propylenoxide and transferred to resin (Durcupan, Sigma). Polymerized resin blocks were cut on a Leica UCT Ultracut ultramicrotome. Semi-thin sections were stained with toluidine blue and observed under bright field and phase contrast in a Nikon Eclipse E800 photomicroscope. Ultra-thin sections were stained with lead citrate and observed and photographed using a FEI Tecnai Spirit G2 TEM equipped with a Morada digital camera (Soft Imaging System, Münster, Germany) and image capture software (TIA 4.7 SP3, FEI Tecnai). Magnification ranged from 1250× to 43 000× depending on the structures observed; intensity of the electron beam was adjusted to be in the optimal range for different magnifications.
2.5. Reflecting platelets of iridophores
To infer the role of iridophores in colour production we analysed the geometric properties of intact reflecting platelets as well as of the empty holes that remain after the reflecting platelets dissolve due to the embedding process. For analyses we used multiple electromicrographs of 4500–9900× magnification: P. concinna: PM (N = 8), CBC (N = 8), FLBS (N = 8); T. s. elegans: PM (N = 19), CBC (N = 15), FLBS (N = 9). Unfortunately, measurements of iridophores from the FLBS of P. concinna are not included in the results because the platelets were not well preserved. The scale of each image in nm/pixel was set based on the number of pixels in the scale bar of the original electromicrographs. The length of the minor axis (height) and of the major axis (width) of intact reflecting platelets was measured directly from electromicrographs using the digital callipers utility in ImageJ (1.52a; [57]). Empty holes were analysed automatically by greyscale thresholding and subsequent measurement tools in ImageJ [16,58]. Briefly, electromicrographs were optimized for contrast and ellipses were fitted inside the platelets' bodies. Geometric parameters such as length of major axis of ellipse, length of minor axis, and angle between major axis of the ellipse and x-axis of electromicrographs were calculated (see electromicrographs of reflecting platelets in [56]).
Based on the length of the minor axis of both intact platelets and empty holes we calculated putative reflective wavelengths of reflecting platelets following equation (2) in Morrison [59] as applied by Haisten et al. [60] with refractive index of reflecting platelets 1.83 [61]. However, this model of colour production applies only to reflecting platelets that produce colour through thin-film interference [62], which is characterized by reflecting platelets organized in planes perpendicular to the direction of propagation of incoming light (i.e. parallel to the skin surface). Disorganized reflecting platelets on the other hand act as broadband reflectors producing incoherent scattering and reflect light across the entire wavelength spectrum with little influence on the hue of the specific skin region [16]. Following Saenko et al. [16] we calculated the A/y0 ratio to determine the relative amount of reflecting platelets parallel to the skin surface from the Gaussian curve fitted to the distribution of the density of different angles of the ellipses. A is the amplitude of the Gaussian curve above the background of randomly oriented platelets, and y0 is the background level of randomly oriented platelets, i.e. intersection of the Gaussian curve with y-axis. The lower the A/y0 ratio the lower the portion of platelets parallel to the skin surface, with 0 corresponding to either no platelets parallel to the skin surface, or completely disorganized platelets [16]. High A and low y0 indicate predominant orientation of platelets parallel to the surface and low density of disordered platelets. Full width of half maximum (FWHM) of the peak of the Gaussian curve was computed to characterize the spread of the Gaussian curve fitted to the data, i.e. width of angular distribution, as in Saenko et al. [16].
2.6. Fourier analysis of spatial distribution of dermal collagen arrays
To determine the role of the abundant extracellular collagen fibres in colour production we performed two dimensional discrete Fourier analyses of the spatial distribution of dermal collagen arrays in the superficial layers of the dermis using a Fourier tool [63] in MATLAB R2018a [64] kindly provided by Dr Richard Prum (https://prumlab.yale.edu/research/fourier-tool-analysis-coherent-scattering-biological-nanostructures). Because the tool was originally developed for earlier versions of MATLAB, script syntax had to be updated to secure compatibility with the current version of MATLAB (see description of changes in [56]).
There are two main outputs resulting from two-dimensional discrete Fourier analysis of spatial distribution of dermal collagen fibres: the 2-D Fourier power spectrum, and the radial averages of the power spectra. The colour of each pixel in the 2-D Fourier power spectrum represent the magnitude (the Fourier power) of a given spatial frequency (values on the x- and y-axes) in a given direction in the image [63]. Thus, a narrow ring pattern in the 2-D Fourier power spectrum is observed when the periodicity of the collagen fibres varies in a narrow range of spatial frequencies in all directions from any point in the image [63]. On the other hand, if the 2-D Fourier power spectrum would show two dots symmetrically located above and below the centre of the plot in one straight line, the interpretation would be that there is periodicity predominantly in one direction from each point of the image only and that the collagen fibres have a laminar organization [63]. Completely disorganized collagen fibres would be represented by random noise in the 2-D Fourier power spectrum plot.
The radial averages of the power spectra are derived from 2-D Fourier power spectra and summarize the distribution of the Fourier power of different spatial frequencies, i.e. they are averages of values of the Fourier power for each concentric ring (the frequency bin) in the 2-D Fourier power spectra. As these radial averages are normalized to total Fourier power of each single 2-D Fourier power spectra, it is possible to calculate the average of each frequency bin from cumulative analyses of multiple electromicrographs and to plot the average periodicity of collagen fibres across different samples.
The Fourier analyses followed published procedures [18,63]. In each micrograph (9900× magnification) of cross-sections of the collagen fibre arrays we selected a standardized square portion of the array (800 pixels2), and optimized and standardized contrast in Adobe Photoshop (CS3, [65]). The scale of the image in nm/pixel was set based on the number of pixels in the scale bar of the original electromicrographs. The darker pixels of collagen fibres and lighter pixels of mucopolysaccharide were assigned representative refractive indices of 1.42 and 1.35, respectively [66]. We used the Fourier tool with the 2-D fast Fourier transform (FFT2) algorithm [67], resulting in a 2-D Fourier power spectrum. Cumulative analyses were performed using multiple images for each region examined (P. concinna: PM, N = 8; CBC, N = 8; FLBS, N = 8; T. s. elegans: PM, N = 19; CBC, N = 9; FLBS, N = 9; T. s. scripta: CBC, N = 6; ZP, N = 11) (see electromicrographs of collagen fibres at [56]) to obtain the average radial averages of the power spectra for each region. For results we pooled images of the CBC region of both T. scripta subspecies to increase the sample size for this skin region.
The predicted reflectivity curve derives from radial averages of the power spectra of each electromicrograph analysed. Predicted reflectivity of the region is calculated by each frequency bin separately. First the inverse value of radial average for each spatial frequency is multiplied by twice the average refractive index and expressed as wavelength (nm) [63,68]. Thus, lower spatial frequencies in the radial averages of the power spectra represent longer wavelengths of predicted reflectivity. The predicted reflectivity in visible spectra was calculated for 51 concentric bins of the 2-D Fourier power spectra (corresponding to 51 10 nm wide wavelength intervals from 300 to 800 nm) for each region as described in Prum & Torres [63]. To visualize the composite predicted shape of reflectivity from multiple measurements of collagen fibre arrays per region we fitted a smoothed curve (span = 0.3) to the data using the local fitting loess function in R.
2.7. Pigment analyses
Integument from P. concinna (N = 3), T. s. elegans (N = 2) and T. s. scripta (N = 2) was used for carotenoid analyses. Sampled regions were CBC, FLBS, PM and ZP. Small pieces of integument were removed using micro-scissors and tweezers, cleaned mechanically with scalpel and tweezers, washed briefly with distilled water to get rid of potential contamination from muscles or body fluids and frozen at −20°C. Samples were then transported on ice to Prague (Czech Republic) by plane, where they were stored frozen at −20°C until analyses, but never longer than one month. Samples were extracted with 0.5 ml ethyl acetate. The vials containing the extracts were stored for 3 days at room temperature in complete darkness. The extracts were then evaporated to dryness by stream of nitrogen at 27°C and stored at −18°C. Immediately prior to the analyses samples were diluted in 200 µl of ethyl acetate (EtOAc).
Standards of astaxanthin, canthaxanthin, lutein and zeaxanthin were purchased from Sigma Aldrich (Munich, Germany). Stock solutions of the external standards were prepared at a concentration of 0.1 mg ml−1 by dissolving in EtOAc. The working solution of the mixture of all the studied carotenoids in EtOAc was prepared at concentrations of 50, 100, 200, 500 and 1000 ng ml−1 from the stock solutions.
Carotenoids were determined using UPLC system Dionex Ultimate 3000 (Thermo Fischer, USA) coupled with photodiode array (PDA) detector followed by ultra-high resolution accurate mass (HRAM) Q-TOF mass spectrometer (IMPACT II, Bruker Daltonik, Germany). Carotenoid separation was performed on a Kinetex C18 RP column (2.6 µm, 150 × 2.1 mm; Phenomenex, USA) maintained at 35°C using acetonitrile (A), methanol/water 1 : 1 v/v (B) and a mixture of tert-butyl methyl ether/acetonitrile/methanol—86 : 86 : 8 v/v/v (C) as mobile phases for gradient elution (electronic supplementary material, table S1) with constant flow rate of 0.2 ml/min. Chromatograms were monitored at 445 and 472 nm. The identity of the particular carotenoids was confirmed by HRAM mass spectrometry. Ions were detected in positive mode with electrospray (ESI) as well as atmospheric pressure chemical ionization (APCI) (see details in electronic supplementary material, table S2). A chromatogram of the mixture of all carotenoid standards (1000 ng of each standard dissolved in 1 ml EtOAc) is shown as electronic supplementary material, figure S1a. Chromatograms of the individual carotenoid standards with their absorbance spectra are shown in electronic supplementary material, figure S1c–f.
For analyses of pterins we used integument from one individual of each of the examined taxa. Sampled regions were CBC, FLBS, PM and ZP. Samples of integument were removed, treated and transported as for carotenoid analyses. Samples were extracted with dimethyl sulfoxide (DMSO) following a previously published procedure [69].
Standards of 6-biopterin, d-neopterin, leucopterin, pterin, pterin-6-carboxylic acid (pterin-6-COOH), and riboflavin were purchased from Sigma Aldrich (Munich, Germany). Isoxanthopterin and xanthopterin were obtained from Fluka (Buchs, Switzerland). l-sepiapterin was purchased from the Cayman Chemical Company (Ann Arbor, MI, USA). Erythropterin was kindly provided by Dr Ron Rutowski. Drosopterin was prepared according to Ferré et al. [70]. Stock solutions of the external standards (except drosopterin) were prepared at a concentration of 0.1 mg ml−1 by dissolving in DMSO. The working solution of their mixture in DMSO was prepared at a concentration of 0.01 mg ml−1 from the stock solutions.
All chromatographic measurements were carried out in a HPLC system (Agilent series 1290 coupled with a Triple Quad 6460 tandem mass spectrometer, Agilent Technologies, Waldbronn, Germany). For data acquisition, the Mass Hunter Workstation software was used. A ZIC®-HILIC (4.6 mm × 150 mm, 3.5 µm) column, based on zwitterionic sulfobetaine groups, was chosen (Merck, Darmstadt, Germany). The chromatographic conditions were adapted from Kozlík et al. [71] and Andrade et al. [72]. Separation of all studied compounds (with the exception of drosopterin) was achieved through isocratic elution at a flow rate of 0.5 ml min−1 with the mobile phase consisting of acetonitrile/5 mM ammonium acetate, pH 6.80 at a volume ratio of 85 : 15 (v/v). Since drosopterin exhibits higher polarity compared to other pterins, it was analysed using acetonitrile/10 mM ammonium acetate, pH 6.80 at a volume ratio of 55 : 45 (v/v) and flow rate of 0.8 ml min−1. Tandem mass spectrometric (MS/MS) measurements were performed in the selected reaction monitoring mode (SRM) with positive ionization. SRM conditions used for MS/MS determination are listed in electronic supplementary material, table S3. Pterins eluted with the following retention times (min): l-sepiapterin t = 7.00, pterin t = 9.20, isoxanthopterin t = 12.5, 6-biopterin t = 12.6, xanthopterin t = 16.4, leucopterin t = 18.4, erythropterin t = 25.0, pterin-6-COOH t = 28.0 and d-neopterin t = 28.8. Riboflavin eluted with retention time t = 5.9 min., drosopterin eluted with retention time t = 10.2 min. A chromatogram of the mixture of all standards (except drosopterin) in DMSO at a concentration of 0.01 mg ml−1, measured in the TIC (total ion current) mode is shown as electronic supplementary material, figure S2a; SRM chromatograms of the individual compounds are shown as electronic supplementary material, figure S2b,c.
3. Results
3.1. Spectral reflectance
Average standardized reflectance spectra of Pseudemys concinna and Trachemys scripta are shown in figure 2 (see reflectance data of each individual at [56]). The dorsal head background coloration (DHC) of both T. scripta and P. concinna has a flat reflectance spectrum and low overall reflectance. Moreover, the reflectance of the DHC is further reduced beyond 550 nm. The red postorbital marking (PM) of T. s. elegans also has a relatively flat reflectance spectrum, with low overall reflectance but, in contrast to the DHC, shows increased reflectance at wavelengths longer than 550 nm giving rise to a plateau between 600–700 nm. All reflectance spectra from yellow regions (i.e. main median chin stripe—CBC, and main forelimb stripe—FLBS, of both species, and the PM of P. concinna as well as the zygomatic patch—ZP of T. s. scripta) are similar in that they show two peaks, one minor peak in the UV part of the spectrum between 300 and 400 nm and a larger, primary peak between 500 and 600 nm. The width, shape and height of the primary peak differ slightly among the yellow regions.
Figure 2.

Mean (±s.e.m.) reflectance spectra of focal regions of (a) females of Pseudemys concinna (N = 8), (b) males of P. concinna (N = 4), (c) females of Trachemys scripta elegans (N = 39), and (d) males of T. s. scripta elegans (N = 30). CBC: main median chin yellow stripe; DHC: dorsal head background coloration; FLBS: main bright stripe of the fore limb; PM: postorbital marking. The yellow zygomatic patch (ZP) of T. s. scripta (N = 1) is shown in (d).
Means of summary variables derived from reflectance spectra and their standard deviations for each region of each taxon are shown in table 1 (see summary variables of each individual at [56]). Summary variables derived from reflectance spectra of one individual T. s. scripta overlap with summary variables (mean ± standard deviation) of T. s. elegans but fall outside the values (mean ± standard deviation) of the summary variables for P. concinna. Therefore, the colour of the different regions varies more between species than between subspecies of the same species. For most of the regions T. s. elegans and T. s. scripta can be treated as a single taxon T. scripta.
Table 1.
Summary colour variables for each taxon involved in this study. For P. concinna and T. scripta summary variables are shown as means for both sexes. Asterisk denotes variables that differ significantly between the sexes. B1—sum of the relative reflectance over the entire spectral range; H1—wavelength of maximum reflectance; relative contributions of a spectral ranges to the total brightness: 300–400 nm (S1.UV), 400–510 nm (S1.blue), 510–605 nm (S1.green), 550–625 nm (S1.yellow), 605–700 nm (S1.red). CBC: main median chin yellow stripe; DHC: dorsal head background coloration; FLBS: main bright stripe of the fore limb; PM: postorbital marking; ZP: yellow zygomatic patch. Note that for T. s. scripta the values of summary variables resulted from measurements of only one male.
| variable (s.d.) |
|||||||||
|---|---|---|---|---|---|---|---|---|---|
| taxon (number of individuals) | region | sex | B1 | S1.UV | S1.blue | S1.green | S1.yellow | S1.red | H1 |
|
P. concinna (females, N = 8) (males, N = 4) |
CBC | f | 15002.9 (3159.58) | 0.113 (0.036) | 0.273 (0.021) | 0.334 (0.024) | 0.255 (0.021) | 0.287 (0.027) | 514.75 (12.406) |
| m | 16744.947 (391.134) | 0.080 (0.017) | 0.271 (0.019) | 0.035 (0.017) | 0.27 (0.013) | 0.306 (0.019) | 513.25 (4.856) | ||
| DHC | f | 1781.986 (752.728) | 0.347 (0.054) | 0.348 (0.013) | 0.28 (0.043) | 0.144 (0.028) | 0.032 (0.037) | 384.125 (101.226) | |
| m | 2149.312 (651.104) | 0.376 (0.016) | 0.348 (0.017) | 0.0257 (0.012) | 0.135 (0.012) | 0.026 (0.035) | 327.25 (8.382) | ||
| FLBS | f | 10394.211 (3696.107) | 0.152 (0.038) | 0.266 (0.02) | 0.328 (0.026) | 0.246 (0.022) | 0.262 (0.024) | 539.375 (10.954) | |
| m | 10928.878 (1214.563) | 0.116 (0.024) | 0.234 (0.038) | 0.358 (0.026) | 0.278 (0.024) | 0.299 (0.32) | 541.75 (16.998) | ||
| PM | f | 7067.994 (2582.48) | 0.16 (0.025) | 0.282 (0.025) | 0.338 (0.027) | 0.238 (0.016) | 0.228 (0.038) | 526.25 (12.702) | |
| m | 9190.255 (2912.302) | 0.123 (0.025) | 0.250 (0.02) | 0.365 (0.029) | 0.268 (0.019) | 0.269 (0.013) | 536.75 (5.91) | ||
|
T. s. elegans (females, N = 39) (males, N = 30) |
CBC | f | 10705.771 (3632.844)* | 0.1 (0.04) | 0.225 (0.029) | 0.378 (0.041) | 0.287 (0.030) | 0.305 (0.03) | 550.073 (34.71) |
| m | 14258.388 (4376.958)* | 0.088 (0.025) | 0.214 (0.021) | 0.389 (0.025) | 0.299 (0.018) | 0.317 (0.027) | 544.556 (5.493) | ||
| DHC | f | 1903.384 (1084.486) | 0.346 (0.046) | 0.356 (0.028) | 0.277 (0.023) | 0.137 (0.033) | 0.028 (0.061) | 419.609 (119.7) | |
| m | 1623.636 (1044.952) | 0.363 (0.033) | 0.350 (0.025) | 0.285 (0.036) | 0.129 (0.027) | 0.008 (0.035) | 451.037 (119.264) | ||
| FLBS | f | 11002.409 (3036.267)* | 0.09 (0.024) | 0.195 (0.024)* | 0.404 (0.025) | 0.313 (0.022) | 0.319 (0.025)* | 550.975 (7.837) | |
| m | 13580.557 (2640.995)* | 0.08 (0.024) | 0.174 (0.026)* | 0.407 (0.024) | 0.324 (0.022) | 0.346 (0.029)* | 555.852 (12.63) | ||
| PM | f | 5625.108 (2062.488) | 0.23 (0.035) | 0.242 (0.042) | 0.240 (0.024) | 0.203 (0.029) | 0.294 (0.084) | 602.488 (143.451) | |
| m | 6548.252 (2844.586) | 0.21 (0.037) | 0.213 (0.047) | 0.233 (0.036) | 0.213 (0.035) | 0.35 (0.089) | 652.593 (77.594) | ||
|
T. s. scripta (male, N = 1) |
CBC | m | 11467.67 | 0.094 | 0.229 | 0.375 | 0.28 | 0.309 | 518 |
| DHC | m | 801.896 | 0.29 | 0.37 | 0.346 | 0.159 | 0 | 549 | |
| FLBS | m | 10980.87 | 0.078 | 0.192 | 0.405 | 0.309 | 0.334 | 541 | |
| ZP | m | 12102.164 | 0.172 | 0.252 | 0.323 | 0.239 | 0.261 | 518 | |
The ordination plot resulting from redundancy analyses (RDA) based on summary variables of both T. s elegans and P. concinna is shown in figure 3a. The axis constrained by species identity (RDA1) explains 18% and the axis constrained by sex (RDA2) explains 4% of total variance. The first residual axis (PC1) explains 18% and the second residual axis (PC2) explains 13% of the total variance. The differences between P. concinna and T. s. elegans and between sexes are statistically significant (ANOVA-like permutation test; species identity—F = 17.16, p < 0.001; sex—F = 4.66, p < 0.001). Effect size decreased when the model included sex as a single explanatory variable (adj R2 = 0.038) compared with a model with both species identity and sex as explanatory variables (adj R2 = 0.2) or a model with species identity as a single explanatory variable (adj R2 = 0.163). Thus, compared to species identity, the contribution of sex to colour variation among homologous body regions is relatively minor.
Figure 3.
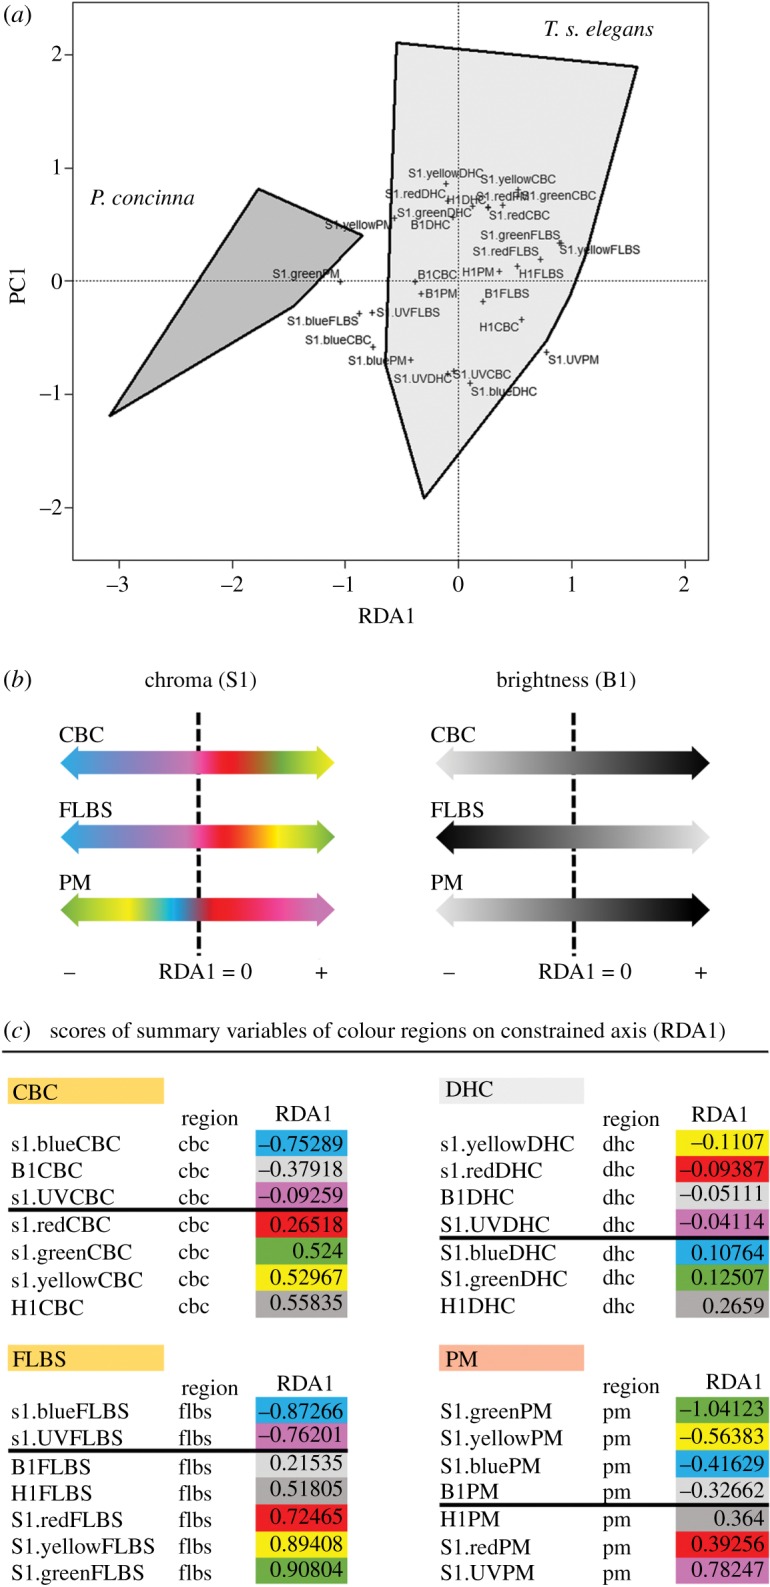
Overall differences in colour between the two studied species. (a) Biplot representing results of RDA of summary variables derived from reflectance spectra of Pseudemys concinna and Trachemys scripta elegans. First axis (RDA1) is constrained by species (explains 17% of total variance). The first residual axis (PC1) explains 18% of total variance. B1: sum of the relative reflectance over the entire spectral range; H1: wavelength of maximum reflectance; relative contributions of a spectral ranges to the total brightness: 300–400 nm (S1.UV), 400–510 nm (S1.blue), 510–605 nm (S1.green), 550–625 nm (S1.yellow), 605–700 nm (S1.red). CBC: main median chin yellow stripe; DHC: dorsal head background coloration; FLBS: main bright stripe of the fore limb; PM: postorbital marking; ZP: yellow zygomatic patch. (b) Schema of the differences between species (distribution along RDA1 axis) in chroma (S1) and brightness (B1) of examined regions. Note that the DHC region aligned rather more with the first residual axis (PC1). (c) Table of scores of summary variables of all colour regions of both species on RDA1 axis. Thick line denotes zero.
Interpretation of the RDA1 axis, and therefore of differences between both species, seems to be region specific. Pseudemys concinna shows increased brightness (B1) along the RDA1 axis in CBC and PM, but decreased brightness in FLBS compared to T. s. elegans. The yellow CBC and FLBS of P. concinna show higher chroma (S1) in the blue and UV segments of reflectance spectra, but the yellow CBC and FLBS T. s. elegans have higher chroma (S1) in the yellow, red and green segments. The yellow PM of P. concinna shows higher chroma in the green, yellow and blue segments of reflectance spectra, while the red PM of T. s. elegans shows higher chroma in the red segment, but also in the UV segment of reflectance spectra (figure 3b). The increased chroma in the UV segment of the PM in T. s. elegans is a consequence of the overall low reflectance of this region rather than exceptionally high reflectance in the UV. Reported patterns of interspecific differences did not change when the PM region was not included in the analyses (data not shown here but see R script together with input data at [56]). Variables pertaining to background colour (DHC) are associated with PC1 rather than with RDA1 (compare values of RDA1 scores of the DHC to scores of summary variables of other regions—figure 3b) and contribute very little to colour differences between both species.
When species are treated separately, RDA shows no difference between sexes in summary variables of P. concinna (ANOVA-like permutation test; F = 1.97, p = 0.091). Also pairwise comparisons among summary variables of P. concinna show no significant sex differences (ANOVA with Holm's correction for multiple comparisons) (electronic supplementary material, table S4). On the other hand, differences in summary variables between sexes of T. s. elegans shown by RDA are significant (ANOVA-like permutation test; F = 3.90, p < 0.001). Axis constrained by sex of T. s. elegans explains 5.5% of total variance in colour of skin regions. The first residual axis explains 21% and the second residual axis explains 17% of the total variance. Pairwise comparisons (ANOVA with Holm's correction) show significant differences in B1CBC (F = 13.22, adj p = 0.014), B1FLBS (F = 12.98, adj p = 0.015), S1.blueFLBS (F = 10.89, adj p < 0.001) and S1.redFLBS (F = 17.22, adj p < 0.001) between males and females of T. s. elegans (see all F and p values in electronic supplementary material, table S4).
In short, the major differences in colour between P. concinna and T. s. elegans are: (i) shorter wavelengths contribute more to yellow colour of the CBC and FLBS in P. concinna compared to T. s. elegans; (ii) CBC and PM are brighter in P. concinna, but the FLBS is brighter in T. s. elegans; (iii) P. concinna shows little sexual dichromatism, but males of T. s. elegans have distinctly brighter CBC, and brighter FLBS with more blue and red chroma than females.
3.2. Microscopy
The epidermis is separated from the dermis by a conspicuous basal lamina (solid arrows in figures 4 and 5). The epidermis differs in thickness between regions and contains multiple layers of keratinocytes. The corneous layer of the epidermis is relatively thin in all regions except in the FLBS where it represents about one fifth of the thickness of the entire epidermis (of all the regions examined only the FLBS is covered by scales). Arrays of collagen fibres are highly abundant in the dermis of every region examined. Four basic pigment cells types are present in the integument of all studied turtles: epidermal melanocytes, and dermal iridophores, melanocytes, and xanthophores (figures 4, 5 and 6). We have not observed finger-like projections of dermal melanocytes that are characteristic of dermal melanophores with motile organelles [12]. Mosaic pigment cells were also found in the dermis of T. s. elegans (figure 6d,g,h). The pigment cell types present in each of the studied regions are summarized in table 2.
Figure 4.

Red postorbital region (PM) of Trachemys scripta elegans. (a) Micrograph of semi-thin section stained with toluidine blue viewed under light microscope; (b) area denoted by rectangle in (a) viewed at higher magnification; (c) electromicrograph showing xanthophores residing in dermis under basal lamina (solid arrows); (d) closer view of xanthophore and its carotenoids vesicles; (e) detail of melanosomes of epidermal melanocyte. D: dermis; E: epidermis; c: collagen fibres; k: keratinocyte; m: melanocyte; x: xanthophore; arrows: basal lamina.
Figure 5.

Yellow postorbital region (PM) of Pseudemys concinna. (a) Semi-thin section stained by toluidine blue viewed under light microscope; (b) area denoted by rectangle in (a) viewed at higher magnification; (c) Electromicrograph showing xanthophores and iridophores in the dermis; (d) closer view of iridophore; (e) closer look on xanthophore with detail of pterinosome in the inset. D: dermis; E: epidermis; c: collagen fibres; k: keratinocyte; solid arrows: basal lamina; clear arrows: xanthophore; arrowheads: iridophores.
Figure 6.

Boundary between the red postorbital region (PM) and its surrounding black line of Trachemys scripta elegans; (a) photography of the lateral view of the head, region of interest highlighted by white rectangle; (b) edge between two different regions viewed under binocular microscope; (c) electromicrograph of section of red postorbital region, orange line: xanthophores; white line: basal lamina; (d) edge of black region, turquoise line: iridophore; white line: basal lamina; m: epidermal melanocyte; white arrow: dermal melanocytes; asterisk: mosaic chromatophore; (e) detail of vesicles of xanthophores of the red postorbital region—carotenoid vesicles and pterinosomes; (f) detail of vesicles of dermal melanocytes of black region, melanosomes; (g) detail on small iridophore next to dermal melanocytes in the black region; arrowhead: iridophore, white arrow: dermal melanocytes, black arrows: basal lamina. White line: basal lamina; asterisk: mosaic chromatophore; (h) high magnification of vesicles of mosaic chromatophore, showing co-localization of carotenoid vesicles and melanosomes.
Table 2.
Presence (✓ present/✗ absent) of pigment cell types in different regions of the integument in the studied taxa. CBC: main median chin yellow stripe; DHC: dorsal head background coloration; FLBS: main bright stripe of the fore limb; PM: postorbital marking; ZP: yellow zygomatic patch.
| pigment cell type |
|||||
|---|---|---|---|---|---|
| epidermal |
dermal |
||||
| taxon | region | melanocytes | iridophores | melanocytes | xanthophores |
| P. concinna | CBC | ✗ | ✓ | ✗ | ✓ |
| DHC | ✓ | ✓ | ✓ | ✓ | |
| FLBS | ✗ | ✓ | ✗ | ✓ | |
| PM | ✗ | ✓ | ✗ | ✓ | |
| T. s. elegans | CBC | ✗ | ✓ | ✗ | ✓ |
| DHC | ✓ | ✓ | ✓ | ✓ | |
| FLBS | ✗ | ✓ | ✗ | ✓ | |
| PM | ✓ | ✗ | ✗ | ✓ | |
| T. s. scripta | CBC | ✗ | ✓ | ✗ | ✓ |
| DHC | ✓ | ✓ | ✓ | ✓ | |
| FLBS | ✗ | ✓ | ✗ | ✓ | |
| ZP | ✗ | ✗ | ✗ | ✓ | |
Epidermal melanocytes are present in the epidermis in the PM and DHC of T. scripta (figures 7e and 8a–c), and DHC of P. concinna. Epidermal melanocytes are located just above the basal lamina and are surrounded by keratinocytes. In samples with epidermal melanocytes the surrounding keratinocytes contain melanosomes. In some samples, however, the epidermal melanocytes are contracted and contain only a few melanosomes; those samples lack melanosomes deposited in keratinocytes. The PM of T. s. elegans contains mostly contracted epidermal melanocytes and almost no transferred melanosomes (figure 8a). In contrast, the PM of T. s. scripta contains enlarged epidermal melanocytes and melanosomes distributed among many keratinocytes (figure 8c). Pseudemys concinna does not have epidermal melanocytes in the PM (figures 5 and 8e,f).
Figure 7.
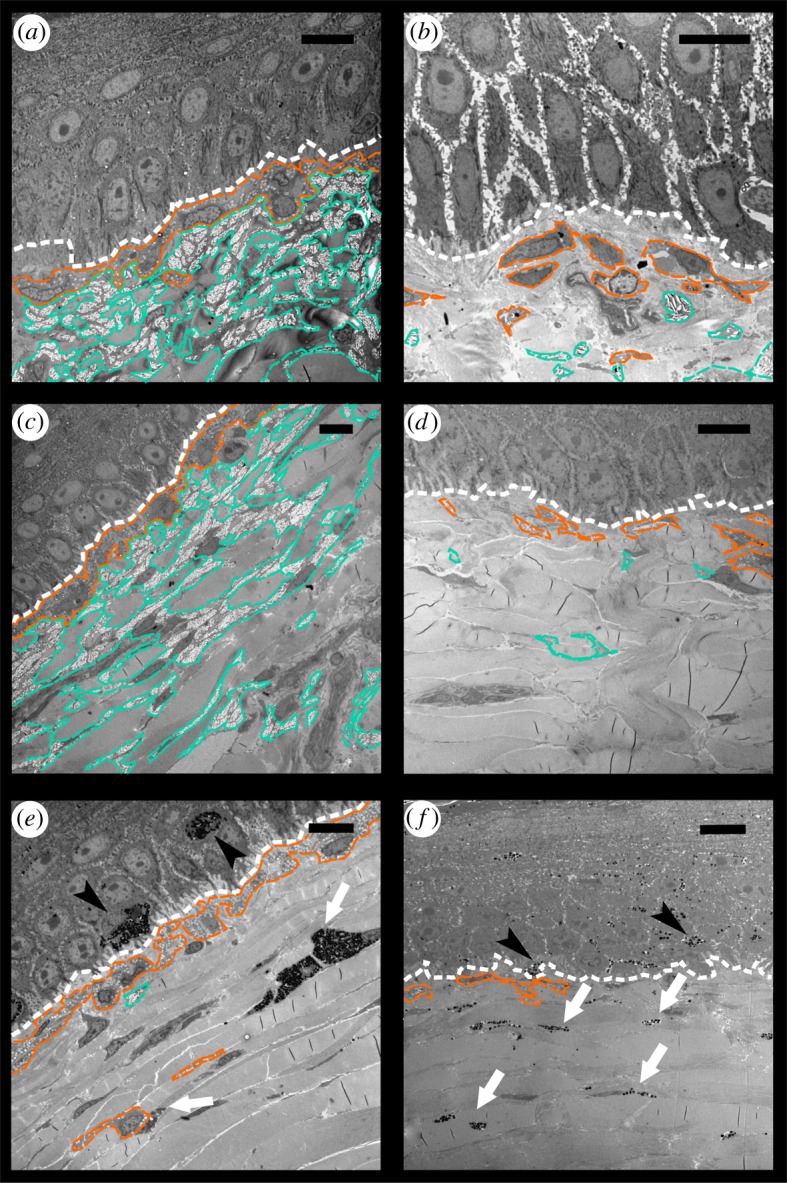
Electromicrographs of different regions of turtles' integument. (a) Yellow chin (CBC) region of Trachemys scripta; (b) CBC region of Pseudemys concinna; (c) yellow front limb (FLBS) region of T. scripta; (d) FLBS region of P. concinna; (e) Dorsal dark head (DHC) region of T. s. elegans; (f) DHC region of T. s. scripta. White line: basal lamina; orange line: xanthophores; turquoise line: iridophores; black arrowheads: epidermal melanocytes; white arrows: dermal melanocytes. Scale bar represents 10 µm. Note that magnification differs.
Figure 8.
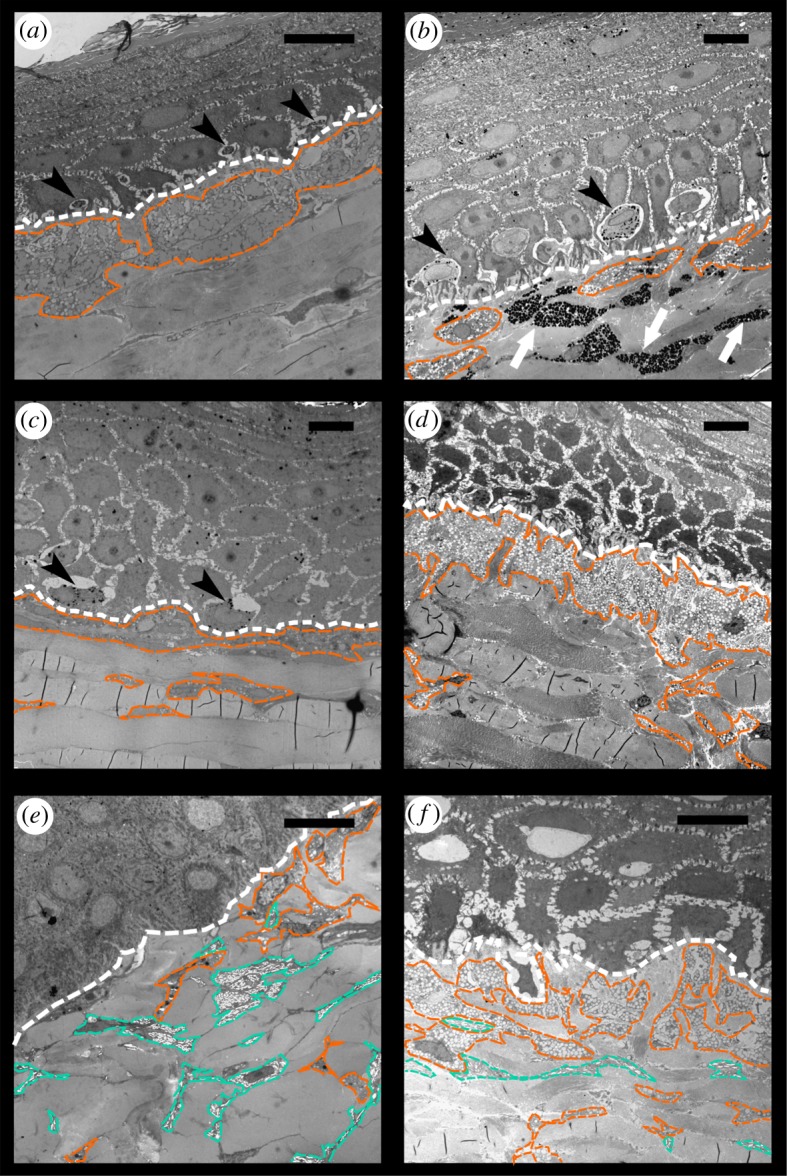
Electromicrographs of different regions of turtles' integument. (a) Red postorbital (PM) region of Trachemys scripta elegans, note small epidermal melanocytes and no melanosomes in keratinocytes; (b) red PM region of melanistic male of T. s. elegans, note enlarged epidermal melanocytes, but few melanosomes in keratinocytes; (c) dark PM region of T. s. scripta, note enlarged epidermal melanocytes and abundant melanosomes in keratinocytes; (d) yellow zygomatic patch (ZP) region of T. s. scripta, note that there are no epidermal melanocytes; (e) yellow PM region of P. concinna; (f) yellow PM region of different specimen of P. concinna than in (e), see the difference in abundance of xanthophores and iridophores, here xanthophores form almost continuous layer, it is possible that these differences are due to the different localization within the PM stripe on head, or these differences may be due to intraspecific variability. White line: basal lamina; orange line: xanthophores; turquoise line: iridophores; black arrowheads: epidermal melanocytes; white arrows: dermal melanocytes. Scale bar represents 10 µm. Note that magnification differs.
Iridophores are present in the dermis of the CBC, FLBS, and PM of P. concinna, and in the CBC, FLBS of T. scripta, but are missing in the PM and ZP of T. scripta. Iridophores are present also in the DHC, but these are very rare, small and seem haphazardly distributed (figure 7e). The iridophores of P. concinna do not form a continuous layer. They are rather scarce in the CBC and FLBS (figure 7b,d), and more abundant in the PM (figure 8e). In the CBC and FLBS of T. scripta iridophores are abundant and form an almost continuous layer several cells thick (figure 7a,c).
Dermal melanocytes are abundant in the DHC (figure 7e,f) and in the narrow black lines outlining the yellow-red regions (figure 6). In the DHC melanocytes are dispersed throughout the upper parts of dermis but do not generally form a continuous layer. In contrast, the dermal melanocytes in the narrow black lines form a continuous layer. Dermal melanocytes were present also in the PM of a melanistic male of T. s. elegans (figure 8b).
Xanthophores are present in the dermis of all regions examined just beneath the basal lamina and just above iridophores when those are present. In the CBC, FLBS (figure 7b,d) and PM (figure 8e,f) of P. concinna the xanthophores are sparse and do not form a continuous layer. The xanthophores form a thick continuous layer in the PM of T. s. elegans (figure 8a) and in the ZP of T. s. scripta (figure 8d). In the CBC and FLBS of T. s. elegans (figure 7a,c) and PM of T. s. scripta (figure 8c) the xanthophore layer is also continuous but its thickness is reduced compared to the PM of T. s. elegans or ZP of T. s. scripta. In the two melanistic males of T. s. elegans that we examined, the xanthophores of the PM region are interspersed with dermal melanocytes and do not form a continuous layer (figure 8b). Xanthophores are also found in the DHC where they form aggregates of interconnected cells, but not a continuous layer (figure 7e). Xanthophores contain three types of pigment bearing organelles: two types of carotenoid vesicles with different electron density but without internal structure, and pterinosomes (figure 9). Unlike carotenoid vesicles, mature pterinosomes are characterized by the presence of concentric lamellae [73,74]. Mosaic pigment cells containing carotenoid vesicles, pterinosomes and melanosomes are present at the boundary between the PM and its black surrounding line in T. s. elegans (figure 6g,h).
Figure 9.

Examples of three different types of vesicles present in the xanthophores of examined turtles. (a) Electron dense vesicles present predominantly in the PM of Trachemys scripta elegans; (b) vesicles with lower electron density present predominantly in the ZP of Trachemys scripta scripta; (c) pterinosomes; (d) detail of electron dense vesicles from (a), these vesicles lack any internal structure and possibly contain ketocarotenoids; (e) detail of vesicles with lower electron density shown in (b); (f) detail of pterinosomes shown in (c), typical by concentric lamellae. Scalebar 2 µm (a,b,c) and 500 nm (d,e,f). Note that magnification of (a) differ.
Pseudemys concinna has the same pigment cell types in the ventral and dorsal sides of the head. In contrast, the dorsal and ventral regions of the head in the two subspecies of T. scripta differ in the distribution of colour-producing pigment cells (figure 10). The ventral CBC (figure 7a) and FLBS (figure 7c,d) of P. concinna and T. scripta contain iridophores together with xanthophores in the dermis. This organization is found also in the PM of P. concinna (figures 7b and 8e,f). However, the dorsal head regions of both subspecies of T. scripta, i.e. yellow YP of T. s. scripta (figure 8d), the dark PM of T. s. scripta (figure 8c), and the red PM of T. s. elegans (figure 8a) contain only xanthophores in the dermis. Another difference among the studied species is that, unlike T. scripta, the pigment cells of P. concinna do not form continuous layers.
Figure 10.

Schematic diagram of cellular composition of colourful region of Emydinae. Ventral chin stripe (CBC), and dorsal postorbital marking (PM) and zygomatic patch (ZP) of examined turtles composed of epidermal melanocytes and dermal xanthophores and iridophores. Both ventral and dorsal regions of Pseudemys concinna (d) consist of xanthophores and iridophores (a). However, integument of Trachemys scripta elegans (e) and T. s. scripta (f) contain xanthophores together with iridophores on ventral side. On dorsal side there are only xanthophores in the dermis (b,c) present in both subspecies of T. scripta. There are no epidermal melanocytes in neither PM nor CBC of P. concinna (a), but there are epidermal melanocytes in dorsal integument of T. scripta. These epidermal melanocytes are small, without apparent melanosome transferring activity (b) in red PM of T. s. elegans and yellow zygomatic region (ZP) of T. s. scripta. In dark PM region of T. s. scripta (c) epidermal melanosomes are enlarged and epidermal keratinocytes contain transferred melanosomes (grey dots). The dermis contains abundant collagen fibres.
Pigment cells form continuous layers whose composition differs between colour regions (figures 7 and 8). Bright colour regions contain both single cell type layers (xanthophores) and two cell type layers (xanthophores + iridophores) (figure 10). The dark stripes and the background coloration are characterized by the presence of all three cell types but with a predominance of dermal melanocytes. The dermal pigment cells of all studied turtles are embedded in abundant collagen fibres, which in P. concinna make up most of the mass of the dermis adjacent to the epidermis (compare figure 4a,b and figure 5a,b).
3.3. Reflecting platelets of iridophores
The reflecting platelets present in the iridophores of all regions examined are roughly rectangular (figure 11). Characteristics and counts of intact reflecting platelets as well as empty holes are summarized in table 2. Only in the FLBS of T. s. elegans and the CBC of P. concinna reflecting platelets are mostly parallel to the skin surface (predominant angles of orientation are −1.98° and 2.49°, respectively), while the major axes of reflecting platelets in the CBC of T. s. elegans and in the PM of P. concinna have average angles differing from zero (30.86° and 68.3°, respectively). Moreover, the reflecting platelets of the FLBS of T. s. elegans are more aligned with the skin surface and regularly organized (A/y0 = 607.28, FWHM = 59.19°) than other regions examined (CBC of P. concinna—A/y0 = 10.85, FWHM = 95.3°; CBC of T. s. elegans—A/y0 = 6.31, FWHM = 106.24°; PM of P. concinna—A/y0 = 4.91, FWHM = 112.42°) (see electronic supplementary material, figure S3a–d for distributions of angles of reflecting platelets for different regions; see measurements of reflecting platelets in [56]).
Figure 11.

Electromicrograph of iridophores in the turtle integument. E: epidermis; D: dermis; x: xanthophore; arrowheads: iridophore. In the inset is detailed view of reflecting platelet.
Only the FLBS of T. s. elegans meets the full conditions of the thin layer interference model. Figure 12a,b shows the predicted reflectivity of iridophores of the FLBS of T. s. elegans. The peak of the highest density at the predicted reflected wavelength differs slightly depending on whether intact reflecting platelets or empty holes are measured (see electronic supplementary material, figure S3e–h for distributions of thickness of reflecting platelets for different regions based on the two methods of measurement): 618 nm based on measurements of intact platelets and 637 nm based on measurements of empty holes.
Figure 12.

Distribution of predicted reflectivity of reflecting platelets of iridophores based on thin layer interference model. (a) Based on size of intact reflecting platelets of FLBS—yellow front limb region of Trachemys scripta. (b) Based on size of empty holes of FLBS region of T. scripta left after staining of EM sample. Dashed line in (a) and (b) represent shape of reflectance spectra predicted from reflecting platelets properties based on thin layer interference model. (c) Distribution of predicted reflectivity of reflecting platelets of iridophores in regions where assumption of thin layer interference model does not seem to be appropriate.
Due to the organization of their platelets, the iridophores in the CBC of P. concinna probably function as broadband reflectors. The same probably applies to the iridophores in the CBC of T. s. elegans and the PM of P. concinna, which in addition to disorganized reflecting platelets also possess platelets of variable size (figure 12c). Only the iridophores of the FLBS of T. s. elegans seem capable of intense narrowband colour production.
3.4. Fourier analysis of spatial distribution of dermal collagen arrays
The 2-D Fourier power spectra show that none of the single collagen fibre arrays examined (see examples of electromicrographs analysed in figure 13; see output files of Fourier analyses for each electromicrograph analysed in [56]) are organized randomly with respect to wavelengths of light. In other words, the distances between collagen fibres are of the same order of magnitude as wavelengths of light [63]. However, the collagen arrays of T. s. elegans show variation in the spatial frequencies of the 2-D Fourier power spectra within regions (electronic supplementary material, figure S4a–c). In contrast, the power spectra of collagen arrays of P. concinna show reduced variation in organization within regions (electronic supplementary material, figure S4d–f). Collagen arrays of the PM of P. concinna are unambiguously organized in a way which results in a small disc pattern of 2-D Fourier power spectra at low spatial frequencies across all micrographs analysed. Collagen arrays of the FLBS of P. concinna show a two-sided symmetric pattern of 2-D Fourier power spectra at intermediate spatial frequencies rather than a disc pattern, suggesting predominant periodicity in one direction perpendicular to the fibres. In the CBC of P. concinna power spectra show a ring pattern at intermediate spatial frequencies, pointing to equivalent nanostructure in all directions perpendicular to the fibres.
Figure 13.

Electromicrographs of details of collagen fibre arrays. (a) Postorbital marking (PM) of the Trachemys scripta. (b) Main median chin yellow stripe (CBC) of T. scripta. (c) Main bright stripe forelimb stripe of T. scripta. (d) PM region of Pseudemys concinna. (e) CBC region of P. concinna. (f) FLBS region of P. concinna. Scalebar represent 200 nm.
Normalized average radial means of the Fourier power spectra for each region of P. concinna and T. s. elegans are shown in figure 14. Radial means of the Fourier power spectra of all examined regions of both species show increased power values in the lowest spatial frequencies (less than 0.0034 nm−1) compared to spatial frequencies relevant to coherent scattering in the visible light (figure 14a–f; electronic supplementary material, figure S5a). These values of spatial frequencies indicate that the largest portion of light reflected by collagen fibre arrays in these regions belongs to the infrared part of the light spectrum. However, for the CBC of P. concinna this peak of low spatial frequencies lies immediately next to the segment of spatial frequencies relevant to coherent scattering in visible light (from 0.0034 to 0.0092 nm−1) (figure 14e). Radial means of spatial frequencies of collagen fibres of the CBC of P. concinna relevant to coherent scattering in visible light are somewhat elevated compared to the radial means of all regions of T. scripta and the PM of P. concinna (figure 14d). In the FLBS of P. concinna collagen fibres are organized at appropriate spatial frequencies to produce coherent scattering in the visible spectrum (figure 14f).
Figure 14.

Radial means of the Fourier power spectra of electromicrographs of collagen fibre arrays. (a) Postorbital marking (PM) of the Trachemys scripta. (b) Main median chin yellow stripe (CBC) of T. scripta. (c) Main bright stripe forelimb stripe of T. scripta. (d) PM region of Pseudemys concinna. (e) CBC region of P. concinna. (f) FLBS region of P. concinna. Grey rectangle denotes spatial frequencies relevant to coherent scattering in visible light, on the other hand lower frequencies (to the left from the grey rectangle) are relevant to scattering in the infrared part of light spectrum.
Reflectivity of collagen fibre arrays of P. concinna and T. s. elegans predicted by Fourier analyses is shown in figure 15 together with normalized measured reflectance spectra. These predictions describe how the reflecting shield of collagen fibres could contribute to the colour of the skin of turtles through its interaction with incident light. All predicted normalized reflectivity curves have three distinct peaks (360–400, 450–500 and 560–570 nm) except for the YP of T. s. scripta which has four peaks (370, 450, 520 and 570 nm; electronic supplementary material, figure S5b). All predicted normalized reflectivity curves increase beyond 600 nm, but in the CBC of both T. s. elegans (figure 15b) and P. concinna (figure 15e) there is an additional peak/plateau at 660–680 nm. The overall shapes of the predicted normalized reflectivity of collagen fibre arrays are more similar among regions than among species. The PMs of both species (figure 15a,d) have few distinct predicted peaks with a pronounced peak at 560 nm in the PM of P. concinna. The CBC of both species (figure 15b,e) have four significant predicted peaks with the highest at 490–500 nm. The FLBS (figure 15c,f) are characterized by predicted major peaks in the UV spectrum at 360–380 nm. As most of the predicted reflectivity curves increase beyond 600 nm we conclude that the reflective shield of collagen fibres serves primarily to protect against overheating by reflecting infrared wavelengths.
Figure 15.

Measured reflectance spectra of the skin regions (solid line) and reflectance spectra predicted by Fourier analyses of dermal collagen fibres (dashed line). (a) Postorbital marking (PM) of the Trachemys scripta. (b) Main median chin yellow stripe (CBC) of T. scripta. (c) Main bright stripe forelimb stripe of T. scripta. (d) PM region of Pseudemys concinna. (e) CBC region of P. concinna. (f) FLBS region of P. concinna. Note that both measured reflectance and Fourier power are both normalized to have minimum zero and maximum one.
Peaks of the predicted normalized reflectivity of collagen fibre arrays correspond roughly to peaks of normalized measured reflectance spectra. However, there are differences in the overall shapes of the predicted and measured curves. Differences between measured and predicted spectra probably arise due to interactions between colour-producing pigment cells and the intercellular matrix of collagen fibre arrays. Even though the radial means of the Fourier power spectra of the FLBS of P. concinna suggest appropriate spatial frequencies to produce colour by coherent scattering, the predicted reflectivity curve does not match the measured reflectance spectra. However, at least in the CBC of P. concinna the organization of collagen fibres, the radial means of the Fourier power spectra, and the congruence of the predicted reflectivity curve with the measured reflectance spectra all suggest a role of collagen fibre arrays in colour production by coherent scattering. The majority of the Fourier power falls in the infrared part of the light spectrum, the contribution of collagen fibre arrays to the overall reflectance being only minor in most other regions. This suggests that the main function of collagen fibres is to reflect infrared radiation and only in some instances collagen fibres have been co-opted to function in colour production.
3.5. Pigment types
Results of pigment diversity analyses for carotenoids, pterins and riboflavin are summarized in table 4. Examples of UPLC chromatograms resulting from analyses of carotenoids can be found in the supplementary materials (electronic supplementary material, figure S1b,g,h,i,j). The red PM of T. s. elegans contains a rich mixture of various carotenoids which, according to UV/VIS absorbance spectra, are predominantly ketocarotenoids. The two largest retention peaks were determined as astaxanthin (RT = 11.8 min, λmax = 471 nm, [M + H]+ = 597.3944) and canthaxanthin (RT = 13.7 min, λmax = 466, [M]+ = 565.4046). Other regions (yellow CBC, yellow FLBS of both species, yellow PM of P. concinna, and dark PM and yellow ZP of T. s. scripta) had no ketocarotenoids, but contained a relatively complex mixture of hydroxylated xanthophylls, of which lutein (RT = 12.9 min, λmax = 444, [M]•+ = 568.4254) and zeaxanthin (RT = 13.1 min., λmax = 449, [M]•+ = 568.4253) was by far the most abundant.
Table 4.
Presence (✓ present/✗ absent) of different types of pterins, predominant carotenoids and riboflavin in different regions of the integument in the studied taxa (Pseudemys concinna, Trachemys scripta elegans, Trachemys scripta scripta). CBC: main median chin yellow stripe; FLBS: main bright stripe of the fore limb; PM: postorbital marking; ZP: yellow zygomatic patch.
| pterins |
|||||||||||
|---|---|---|---|---|---|---|---|---|---|---|---|
| taxon | region | 6-biopterin | d-neopterin | drosopterin | erythropterin | isoxanthopterin | l-sepiapterin | leucopterin | pterin | pterin-6-COOH | xanthopterin |
| P. concinna | CBC | ✓ | ✓ | ✗ | ✗ | ✗ | ✗ | ✓ | ✗ | ✓ | ✗ |
| FLBS | ✓ | ✓ | ✗ | ✗ | ✗ | ✗ | ✓ | ✗ | ✓ | ✗ | |
| PM | ✓ | ✓ | ✗ | ✗ | ✗ | ✗ | ✓ | ✗ | ✓ | ✗ | |
| T. s. elegans | CBC | ✓ | ✓ | ✗ | ✗ | ✓ | ✗ | ✓ | ✗ | ✓ | ✓ |
| FLBS | ✓ | ✓ | ✗ | ✗ | ✓ | ✗ | ✓ | ✗ | ✓ | ✓ | |
| PM | ✓ | ✓ | ✗ | ✗ | ✓ | ✗ | ✓ | ✓ | ✓ | ✓ | |
| T. s. scripta | CBC | ✓ | ✓ | ✗ | ✗ | ✓ | ✗ | ✓ | ✗ | ✓ | ✓ |
| FLBS | ✓ | ✓ | ✗ | ✗ | ✓ | ✗ | ✓ | ✗ | ✓ | ✓ | |
| ZP | ✓ | ✓ | ✗ | ✗ | ✓ | ✗ | ✓ | ✗ | ✓ | ✓ | |
| predominant carotenoids | flavins | ||||||||||
|---|---|---|---|---|---|---|---|---|---|---|---|
| astaxanthin | canthaxanthin | lutein | zeaxanthin | riboflavin | |||||||
| P. concinna | CBC | ✗ | ✗ | ✓ | ✓ | ✓ | |||||
| FLBS | ✗ | ✗ | ✓ | ✓ | ✓ | ||||||
| PM | ✗ | ✗ | ✓ | ✓ | ✗ | ||||||
| T. s. elegans | CBC | ✗ | ✗ | ✓ | ✓ | ✓ | |||||
| FLBS | ✗ | ✗ | ✓ | ✓ | ✓ | ||||||
| PM | ✓ | ✓ | ✗ | ✗ | ✓ | ||||||
| T. s. scripta | CBC | ✗ | ✗ | ✓ | ✓ | ✓ | |||||
| FLBS | ✗ | ✗ | ✓ | ✓ | ✓ | ||||||
| ZP | ✗ | ✗ | ✓ | ✓ | ✓ | ||||||
Examples of SRM chromatograms of pterins are given in the supplementary material (electronic supplementary material, figure S6). Out of 10 pterins tested, seven were found in the integument of the turtles analysed. l-sepiapterin, erythropterin and drosopterin were not detected in any sample. All other pterins, i.e. 6-biopterin, pterin-6-COOH, isoxanthopterin, leucopterin, d-neopterin, pterin and xanthopterin, were found together only in the red PM of T. s. elegans. The yellow CBC and FLBS of both lineages of T. scripta and the ZP of T. s. scripta contain 6-biopterin, pterin-6-COOH, isoxanthopterin, leucopterin, d-neopterin, and xanthopterin, but not pterin. Only four types of pterins, namely 6-biopterin, pterin-6-COOH, leucopterin and d-neopterin, were detected in the CBC, FLBS and PM of P. concinna. Riboflavin was found in all yellow-red samples except the yellow PM of P. concinna.
4. Discussion
Although animal coloration research has traditionally focused on other groups, many turtles have bright, conspicuous colours [75]. Information on the mechanisms of turtle colour production is particularly scant [27,29,30]. In fact, there is more information on colour production in some fossil extinct taxa than in extant turtles [76–82]. Research on the functional role of turtle chromatic signals is also limited [42]. Given the revised phylogenetic position of turtles as part of archelosauria [22,83–85], studying turtle coloration and colour-producing mechanisms is crucial to understanding the evolution of colour and colour-producing mechanisms in vertebrates in general.
In this study we have analysed the pigment cell organization of the integument, the ultrastructure of colour-producing elements, and the chemical nature of pigments that produce skin colour in Pseudemys concinna and Trachemys scripta, two species of freshwater turtles with contrasting courtship behaviour. We found striking interspecific differences in the distribution of chromatophores in the dorsal and ventral head surfaces. Trachemys scripta shows a different chromatophore composition in the ventral and dorsal sides of the head, whereas P. concinna shows similar chromatophore composition on both sides. Also, there are more pigment types present in the colour patches of T. scripta than in those of P. concinna.
Turtle skin coloration is produced by the combined action of different types of pigment cells in the dermis similarly to amphibians and lepidosaurs. In addition to xanthophores and melanophores, previously described in turtles [27] and also in crocodiles [86], we found abundant iridophores containing rectangular reflecting platelets in yellow skin of both species. To our knowledge, this is the first report of iridophores playing a role in integumental colour production in any archelosaurian species [86,87]. In addition, our pigment analyses suggest that both pterins and carotenoids are involved in the production of the yellow-red skin colours, which had not been clearly documented in the integument of turtles to this date.
We also show that abundant collagen fibre arrays in the skin may serve to prevent infrared light from penetrating into the body of turtles, but in some cases collagen fibre arrays may be capable of reflecting visible wavelengths and therefore affect colour. Taken together, these results suggest that turtle coloration and colour-producing mechanisms are more complex than previously thought.
4.1. The coloration of deirocheline turtles: interspecific and sex differences
Our results reveal interspecific differences in colour-producing mechanisms at multiple levels: differences can be found in the distribution of chromatophores along the dorsoventral body axis, in the ultrastructure of pigment-bearing vesicles of xanthophores, and in the chemical nature of pigments. As for the distribution of chromatophores, T. scripta has both xanthophores and iridophores in the yellow-red regions of the ventral side of the head, but only xanthophores on the dorsal side. Such dorsoventral patterning is lacking in P. concinna which has xanthophores and iridophores on both sides of the head (figure 10). As iridophores increase the overall reflectance of a patch of skin [4,20,88], their presence on the ventral side of the head may provide some sort of countershading to enhance crypsis [89–91] or may be related to signalling (see below). The fact that both species of turtles also have a light plastron, but a dark coloured carapace is consistent with the hypothesis that the increased reflectance caused by the presence of iridophores on the ventral side of the head might serve a camouflage function. The background head coloration (DHC), which has been previously reported to change in response to substrate colour [37,92–94], is produced in both T. scripta and P. concinna by epidermal melanosomes and a combination of all three dermal pigment cell types (figure 7e,f). However, we found epidermal melanocytes in the PM of both lineages of T. scripta (figures 4 and 8a–c), but not in the PM of P. concinna (figures 5 and 8e,f) or in other yellow regions of the examined turtles (figure 7b,d).
Our results show that the conspicuous yellow stripes in the head and limbs of deirocheline turtles exhibit, in addition to a primary reflectance peak responsible for the human-perceived yellow hue, a small secondary peak of reflectance in the UV range of the spectrum. This confirms the results of several previous studies [30,95]. However, we did not find support for the spectral shapes reported by Wang et al. [96]; in fact, we contend that the small 372 nm blip that these authors found in all their reflectance spectra (see their fig. 1 [96]) is an artefact possibly caused by the illumination source. As turtles are capable of seeing into the UV range [97,98], the small peak of UV reflectance may account for chromatic variation among different individuals and contribute to the conspicuousness of the yellow stripes, at least during close-range interactions with conspecifics [30].
We found intersexual differences in the reflectance spectra of CBC and FLBS of T. s. elegans but not P. concinna (table 1). These results contrast with a previous study reporting no intersexual differences in coloration in T. s. elegans [84]. The small sample sizes may be responsible for our inability to statistically support the effect of sex on colour in P. concinna. Sexual dichromatism is apparently present in some deirocheline turtles. For example, males of the northern map turtle (Graptemys geographica) have brighter postorbital patches than females [36]. However, in other species, such as Chrysemys picta [37] and Malaclemmys terrapin [35], there is little or no sexual dichromatism. Sexual dichromatism has been hypothesized to result from females becoming duller as they grow and age [37]. Growth is known to affect the reflectance spectra of colourful regions in some turtles [99]. Moreover, males of some species of deirocheline turtles undergo ontogenetic colour change as they get larger and older [49,100]. As we have excluded melanistic males from the spectral measurements, the sexual dichromatism of T. s. elegans found here is not due to ontogenetic colour change of males. Nevertheless, it will be interesting in the future to examine the postnatal ontogenesis of colour-producing mechanisms in deirocheline turtles to see how sexual dichromatism arises as the turtles grow and age.
4.2. Mechanisms of colour production
The red and yellow regions of turtle skin contain at least three morphologically distinct types of vesicles in xanthophores. Two of these have been previously [72,74,101] identified as carotenoid vesicles, and differ in electron density, shape and size (figure 9a,b,d,e). The third type of xanthophore vesicles are pterinosomes, likely containing pterins (figure 9c,f). These are recognizable by their prominent concentric lamellae [73,74]. Xanthophores containing oval carotenoid vesicles with low electron density (figure 9a,d) are abundant only in the red PM of T. scripta elegans, while xanthophores containing round carotenoid vesicles with high electron density (figure 9b,e) and/or pterinosomes (figure 9c,f) are found in yellow regions of both species. We assume that differences in the ultrastructure of carotenoid vesicles reflect differences in their pigment contents, as in the case of red and yellow retinal oil droplets [102] known to differ in carotenoid content [31,103,104]. However, similar structures have been previously described as vesicles in different stages of maturation [105]. Further study using appropriate methods is necessary to unambiguously determine the types of pigments contained in vesicles with different ultrastructure.
Continuous layers of iridophores with organized reflecting platelets are found in T. scripta but not in P. concinna. The colour produced by the scattering of incident light on arrays of particles depends on the organization, size and the refractive index of particles [106]. Incoherent scattering occurs when the distances between individual particles are random (e.g. reflecting platelets are randomly arranged in iridophores) causing the phases of waves of light to nearly cancel out. In contrast, coherent scattering occurs when the distances between individual particles are similar (e.g. when reflecting platelets are organized in iridophores) causing the phases of waves of light either to completely cancel out or add up to produce relatively high reflectance. As the reflecting platelets of iridophores from the FLBS of T. scripta are highly organized they could produce colour by coherent scattering. Highly organized reflecting platelets in orange and yellow skin regions of the lizards Uta stansburiana [60], Sceloporus undulatus and S. magister [59] reflect orange and yellow wavelengths due to thin-film interference, which is a special case of coherent scattering. The thin-film interference model predicts the highest reflectivity of the FLBS of T. scripta to be between 618 and 637 nm (figure 12a,b). Other regions of turtle skin containing iridophores, i.e. the yellow CBC of T. scripta and all yellow regions of P. concinna, do not have organized reflecting platelets. Iridophores with randomly organized platelets in red and white skin of Phelsuma grandis produce broadband reflection which enhances the overall brightness of the corresponding skin patch [16]. The disorganized prismatic guanin crystals of some spiders produce matte-white colour by incoherent (diffuse) light scattering [107]. However, prismatic crystals of spiders are around one micrometre in size [108], while the disorganized reflecting platelets of fish [107], lizards [16] and turtles (table 3) are much smaller. The yellow regions containing iridophores in T. scripta have increased brightness relative to yellow regions without iridophores (figure 2). Thus even if they do not produce colour through thin-film interference, the iridophores most likely increase the brightness of colour patches and their overall conspicuousness to observers, thus contributing to colour [4,109]. Whether or not the scattering on disorganized reflecting platelets in turtles is coherent or incoherent remains to be answered.
Table 3.
Characteristics of reflective platelets of iridophores in CBC (main median chin yellow stripe), FLBS (main bright stripe of the fore limb) regions of Pseudemys concinna, and CBC, PM (postorbital marking) of Trachemys scripta elegans. The A/y0 ratio represents the relative number of reflecting platelets parallel to the skin surface. A: amplitude of Gaussian curve above the background of randomly oriented platelets; y0: background level of randomly oriented platelets; FWHM: full width of half maximum of the peak of Gaussian curve fitted to the data, i.e. width of angular distribution of reflecting platelets.
|
P. concinna |
T. s. elegans |
|||
|---|---|---|---|---|
| variable | CBC | PM | CBC | FLBS |
| number of platelets measured—intact | 65 | 100 | 59 | 74 |
| number of platelets measured—empty holes | 456 | 625 | 2777 | 2366 |
| mean minor axis length—intact ± s.d. (nm) | 143.44 (64.52) | 91.5 (44.57) | 86.34 (30.65) | 85.85 (33.49) |
| mean minor axis length—empty holes ± s.d. (nm) | 124.63 (47.55) | 100.95 (47.55) | 104.43 (51.20) | 93.95 (42.65) |
| mean major axis length—intact ± s.d. (nm) | 457.51 (221.97) | 414.93 (222.31) | 370.4 (145.88) | 395.52 (179.60) |
| mean major axis length—empty holes ± s.d. (nm) | 420.30 (223.63) | 333.70 (208.98) | 364.25 (240.22) | 347.40 (221.04) |
| A/y0 (A;y0) | 10.85 (0.0090; 0.0008) | 4.91 (0.0069; 0.0014) | 6.31 (0.0076; 0.0012) | 607.28 (0.0158; 0.000026) |
| FWHM (°) | 95.3 | 112.42 | 106.24 | 59.19 |
| predominant orientation (°) | 2.49 | 68.3 | 30.86 | −1.98 |
All yellow regions of both species contain hydroxylated xanthophylls such as lutein and zeaxanthin, while the red PM of T. s. elegans contains the ketocarotenoids astaxanthin and canthaxanthin (table 4; electronic supplementary material, figure S1). Such difference is in partial agreement with previous analyses of carotenoid contents in yellow and red regions of T. s. elegans and Chrysemys picta [30]. Two major classes of carotenoids have been described in the integument of these turtles: short wavelength absorbing apocarotenoids and longer wavelength absorbing ketocarotenoids [30]. In the yellow chin of C. picta only apocarotenoids were described, whereas the orange neck and leg contained apocarotenoids and ketocarotenoids. A previous report indicated that apocarotenoids are abundant in tissue from yellow chin and neck stripes of T. scripta, its ‘orange’ postorbital region containing only ketocarotenoids [30]. Our results, however, suggest a major role of xanthophylls, rather than apocarotenoids, in yellow colour production in T. scripta and P. concinna. Xanthophylls have been shown to produce yellow coloration in some vertebrates [110–112]. In C. picta, increased ingestion of the xanthophyll carotenoid lutein results in an increase in the yellow and red chroma of yellow and red skin patches [28]. In contrast, it is unclear whether apocarotenoids participate in colour production in animals. Apocarotenoids are cleavage products of carotenoids [113–115]. Transparent and clear cone oil droplets in the retina of birds contain the apocarotenoid galloxanthin, but yellow oil droplets contain the xanthophyll zeaxanthin and red oil droplets contain the ketocarotenoid astaxanthin [116]. The unique yellow colour of the macula lutea in primates is due to the accumulation of xanthophylls in the cells of the retina via downregulation of their cleavage pathway to apocarotenoids [117]. Various carotenoid precursors give rise to a large diversity of apocarotenoids [113], but specific types of apocarotenoids have not been reported in previous studies of turtle coloration [30]. The role of apocarotenoids in turtle coloration will thus remain unclear until the relationship between precursor carotenoids in the skin and apocarotenoids is elucidated.
Steffen et al. [30] suggested that the yellow-red skin of C. picta and the yellow skin (but not the red skin) of T. scripta contain small amounts of pterins. Our results show that both yellow and red regions of turtle skin contain multiple types of pterins (table 4). Red and orange colours are produced in some lizards by drosopterin [118,119] which we have not found in turtles. However, yellowish isoxanthopterin and yellow xanthopterin are present in yellow-red regions of T. scripta. Xanthopterin has been previously reported in yellow and red skin of Phelsuma lizards [16]. The yellow and red skin regions of Phelsuma have identical pigment composition but differ in the cellular pH environment which determines the colour of the skin [16]. Thus, it is possible that xanthopterin and isoxanthopterin could contribute to both yellow and red colour production in the skin in turtles due to differences in the cellular pH among these regions. However, most of the pterins present in the skin of both species of turtles are colourless compounds. Colourless biopterin and 6-pterin-COOH have been previously described in the skin of M. japonica [32]. In lizards colourless pterins have been found in colourful body regions. For example, biopterin has been detected in the yellow-red xanthophores of Phelsuma spp. [16], and varying amounts of colourful and colourless pterins have been found in the yellow-orange-red ventral colour morphs of the European wall lizard (Podarcis muralis) [72]. Since many of these colourless pterins absorb in the UV range [16], which turtles can see [97,98], colourless pterins may in fact affect colour perception in turtles. Moreover, although some pterins may be colourless even to turtles, it may be difficult to separate their influence on colour production from that of colourful pterins, because the colourful pterins are derived from colourless ones and vice versa. For example, yellow sepiapterin is a precursor of colourless biopterin (the precursor of yellow 7-oxobiopterin and pterin) and colourless pterin, the precursor of yellowish isoxanthopterin and its isoform yellow xanthopterin [120]. The content of all individual types of pterins thus depends on the availability of their precursor pterins. The diversity of different pterin types may thus describe the differences between colourful skin regions better than the amount of any single pterin type. In addition to carotenoids and pterins, we found riboflavin in all yellow and red regions of T. scripta. In P. concinna we found riboflavin in the yellow CBC and FLBS but not in the yellow PM. Riboflavin is present in the yellow-red skin of various lizards and snakes but has never been reported in turtle skin [32,72,121]. Therefore, the yellow and red colours of the turtles examined here likely result from a complex interplay between carotenoids, pterins and riboflavin.
4.3. Functional significance of turtle coloration: relationship to courtship behaviour
Whether the differences in colour and colour-producing mechanisms among deirocheline turtles are of functional significance has yet to be determined. However, it is already well established that turtles are capable of visually discriminating different yellow and red colours [35,97,98] and it has been suggested that body coloration may play a role in mate choice in emydid turtles [30,35,36]. Furthermore, there is some evidence that the red and yellow skin regions of T. scripta could play a role in signalling individual quality based on the correlation of colour and induced immune response [122]. Moreover, the spectral properties of colour patches of C. picta are influenced by the amount of ingested carotenoids [28] which is one of the basic assumptions of individual quality signalling [123–125].
Is there a relationship between body coloration, colour-producing mechanisms and male-female position during courtship? Males of T. scripta court females in a face-to-face position with forelimbs outstretched, so that both the dorsal and ventral sides of the head and the limbs of the male are simultaneously exposed to the female. On the other hand, males of P. concinna swim above the female during the final stages of courtship [45]. In this position it may be more difficult for the female to perceive the dorsal side of the male's head. If coloration affects male sexual attractiveness, one would expect those skin regions that males display during courtship to be under selection for conspicuousness and/or condition dependence. This may result in skin patches that are particularly bright (i.e. high luminance), to facilitate detection by the female, or that have a complex chromatophore composition allowing for condition-dependent signalling (e.g. xanthophores containing carotenoids). Some aspects of the coloration of T. scripta and P. concinna are consistent with this hypothesis while others clearly are not.
The red and yellow patches in the head and forelimbs of T. scripta contain a more diverse palette of pterins than the yellow patches of P. concinna (table 4). The face-to-face position may facilitate female assessment of male coloration in T. scripta, where the red and yellow patches could function as signals conveying information about individual male quality. Conversely, the relatively simple pigment composition of species that court using the swim-above position would suggest a reduced role for male head coloration in female mate assessment.
Trachemys scripta and P. concinna also differ in the distribution of chromatophores along the dorsoventral body axis (figure 10). Pseudemys concinna has no epidermal melanosomes in the PM, and xanthophores and iridophores are present both dorsally (PM) and ventrally (CBC) in the head. This should make P. concinna rather conspicuous when viewed from above. On the other hand, T. scripta has red-yellow xanthophores and iridophores in the ventral CBC, but not in the dorsal PM. Thus, the location of the potentially brighter, more conspicuous skin patches on the head of the males of the two species does not match predictions based on the relative position of males and females during courtship.
Female mating preferences for colourful males often result in sexual dichromatism, with brightly coloured males and comparatively dull females [126]. Males of T. scripta, which expose their CBC, FLBS and PM to females during courtship, have brighter CBC and FLBS than females (table 1). Males of T. scripta also have increased red chroma in the PM region compared to females, although the difference is not statistically significant after correcting for multiple comparisons (figure 2; electronic supplementary material, table S4). In P. concinna, on the other hand, there are no sex-related differences in coloration (figure 2, table 1).
Other factors besides courtship position could contribute to interspecific variation in colour and colour-producing mechanisms in deirocheline turtles, including habitat type, predation and evolutionary history. The pattern of alternating dark and light stripes that is typical of emydid turtles could provide camouflage through background matching (e.g. when viewed against underwater vegetation) or as disruptive coloration creating false edges and visually breaking the outline of the body, thus hindering detection of turtles by predators [127]. The presence of iridophores ventrally but not dorsally in the head could enhance the cryptic appearance of T. scripta in aquatic environments by countershading (see above). It is not clear, however, why P. concinna does not possess a similar distribution of pigment cell types and instead has iridophores in the dorsal and ventral head colour patches. Because mating strategies are well-studied in this group, it may be relatively straightforward to test hypotheses about the role of natural and sexual selection in shaping the evolution of colour across the Deirochelinae when more data on colour and colour-producing mechanisms become available. Finally, it is important to note that proximate developmental processes may be responsible for differences in coloration between T. scripta and P. concinna which may not necessarily relate to visual signalling or crypsis, but rather to the intrinsic self-organizing properties of pigment cells [105,128–131]. Further studies are needed to clarify the development of pigment pattern formation in turtles [132,133].
4.4. The reflective shield of collagen fibres
Results of Fourier analyses show that turtle collagen fibres reflect in the infrared part of the spectrum in all regions examined (figure 14). Long wavelengths of light that pass through the xanthophores and iridophores may be absorbed by the melanophores, or they may be reflected back to the surface by the underlying collagenous connective tissue when melanophores are absent or scarce [134]. In many fish and amphibian larvae, the collagen fibres form subepidermal transparent collagenous lamella overlying the dermal chromatophores [20,135,136]. In lizards and snakes collagenous connective tissue is found in the superficial fascia between the integument and the underlying muscle [134], but in other animals such as frogs [137], mammals [17] or birds [18] collagen fibres are part of the dermis. Here we show highly abundant dermal collagen fibre arrays located below the chromatophore layers in turtles (figures 4 and 5). Unlike lizards [16,60,138], turtles lack a layer of dermal melanophores in the red-yellow skin regions. Turtles bask to thermoregulate and overheating may represent an immediate risk for them [139], but basking could also have a social function [140] for which it may be advantageous to accumulate heat at a slow rate. Therefore, the function of dermal collagen fibres may be to prevent infrared wavelengths from reaching the body core to avoid overheating. A thermoprotective function of colour-producing structures has been suggested for iridophores found in frogs [141] or chameleons [58]. A thermoprotective function has also been suggested for the keratinous feathers of birds that reflect infrared wavelengths due to their microstructure [142,143]. The role of melanin in thermoregulation is well documented in a broad range of organisms [144]. Thus, it seems that colour-producing elements often acquire a thermoregulatory function and, conversely, skin structures that play a role in thermoregulation may in some instances be co-opted to produce visible colour.
Colour production by coherent scattering on nanostructured collagen fibre arrays has been previously reported in mammals [17] and birds [15,18]. In mammals the colour produced by scattering on collagen fibres is limited to the blue part of the light spectrum [17], but in birds other colours, such as orange in Trogopan coboti, are produced by coherent scattering on collagen fibre arrays [18]. The collagen fibres in the yellow FLBS of P. concinna show sufficient nanostructural organization to produce yellow by coherent scattering (figure 14f). However, in most other regions the collagen fibres are arranged randomly and thus do not produce bright colours by coherent scattering. Even though the light reflected by collagen fibre arrays is largely achromatic it could nonetheless affect the reflectance spectra, as suggested by [4]. As in the CBC and FLBS of P. concinna chromatophores are scarce, it is possible that collagen fibres play a major role in colour production in this species.
4.5. Significance for vertebrate skin colour evolution
Pigment cells are a defining synapomorphy of vertebrates and tunicates [10]. Vertebrates show two fundamental mechanisms of colour production by pigment cells: morphological and physiological. The former is based on the superposition of different dermal pigment cells (iridophores, melanocytes and xanthophores), and is found in ectotherms [145]. Physiological mechanism of colour production based solely on physiological actions of epidermal melanocytes [146] have evolved only in endothermic tetrapods, i.e. birds and mammals [145]. The archelosauria, comprising ectothermic turtles and crocodiles and endothermic birds [22], has undergone dramatic evolutionary changes affecting the physiology of melanocytes [147,148]. Also, iridophores and xanthophores have evolved differently in the main archelosaurian clades [145,149–151]. Skin pigment cells of crocodiles are not organized into stacked continuous layers and their putative iridophores contain amorphous material rather than reflecting platelets [86]. Cells with lipid vesicles suspected to contain carotenoids have been reported in both the epidermis and the dermis of non-feathered bare skin of some bird taxa [18,152], but this association probably evolved secondarily and does not involve pigment cells but other cell types [151]. Even though xanthophores, iridophores and a broad diversity of pigment cells with unusual pigment vesicles are present in the irises of birds, these cell types are not present in the skin of birds [151]. Here we show that turtles develop all the types of pigment cells (epidermal melanocytes, dermal xanthophores, iridophores and melanocytes) in the skin and organize them as continuous stacked layers as in other ectothermic vertebrates. Thus, early archelosaurs most likely shared with fish [153,154], amphibians [155,156], and lepidosaurs [138,157,158] a mechanism of skin colour production by superposition of pigment cells. It remains to be determined when the evolutionary shift between morphological and physiological mechanism of colour production by pigment cells occurred in the evolution of archelosaurs and whether these changes were parallel or convergent to the emergence of physiological mechanism of colour production in mammals.
Xanthophores are pigment cells that contain carotenoids and pterins [12]. Carotenoids are important to produce colour in the feathers and skin of birds [111,159]. Moreover, except for rare occurrences in feathers of penguins [160] or natal down feathers of domestic chickens [161], pterins have so far been reported only in the iris of birds [162]. However, there is no evidence of carotenoids and pterins acting together to produce colour in the skin of any archelosaur. Analyses of the pigments involved in the production of yellow-red colours of the xanthophore containing skin of turtles suggest that pterins contribute, together with carotenoids, to these colours, which was previously reported in fish [123], amphibians [163], lizards [110,121] and in the irises of birds [151,162,164,165]. Thus, colour production by interplay between carotenoids and pterins presumably represents the ancestral condition in vertebrates. It remains open question whether the loss of xanthophores in the skin of avian archelosaurs led to rare occurrence of pterins in the skin and feathers.
The evidence thus suggests that studies of turtle coloration are crucial to understanding the evolution of chromatic diversity in the archelosaurian clade and in vertebrates in general, because turtles seem to employ most of the mechanisms of colour production known in other groups of vertebrates (figure 16). Moreover, the field of paleo-colour, which aims to reconstruct the coloration of extinct taxa, has grown dramatically in recent years, providing some of the most remarkable breakthroughs in our understanding of the evolution of animal coloration [78,79,147,167–169] and turtles, given their key phylogenetic position [83–85], may provide important insights for the proper interpretation of palaeontological data.
Figure 16.

Phylogeny of extant tetrapods [166] illustrating distribution of colour-producing elements in the skin of tetrapods. All of the tetrapods may feature epidermal melanocytes in the epidermis. (a) Composition of colour-producing elements of amphibian larvae (on the left) is like that of fish. Basal lamina is underlined by layer of subepidermal collagen fibres beneath which are xanthophores, iridophores and melanophores/melanocytes located in the dermis. Adults of amphibians dermal xanthophores, iridophore and melanophores that may form dermal chromatophore units. (b) Lepidosaurs have colour-producing elements similar to those of adult amphibians. (c) Birds do not possess any pigment cell type besides epidermal melanocytes. Birds are known to produce colour by organized collagen fibre arrays. Means of colour production of plumage are not depicted. (d) Crocodiles have dermal pigment cells (xanthophores, iridophores, melanocytes) that do not form continuous layers. Iridophores of crocodiles have been reported to not contain rectangular reflecting platelets. (e) Turtles have a continuous layer of xanthophores in some regions; other regions may be characterized by presence of a continuous double layer of xanthophores together with iridophore. Dermal collagen fibres participate in colour production in turtles (f) and mammals. Mammals do not feature any additional pigment cell type in addition to the epidermal melanocytes.
Supplementary Material
Acknowledgements
We are thankful to Piscífatoria del Palmar for the exceptional hospitality. This study would have not been possible without Vicente Sancho and Ignacio Lacomba who pioneered turtle conservation in the Comunitat Valenciana and are responsible for J.B. and E.F. getting to know each other. This study would have not been possible without Alice Exnerová and Prof. Pavel Štys who put J.B. and Z.B. in contact. We are thankful to Centro de recuperación de fauna, Granja El Saler, for the veterinary expertise. We are thankful to José Manuel Garcia-Verdugo, his laboratory personnel (Patricia García-Tárraga, Arantxa Cebrian-Silla, Mariana Fill), and Mario Soriano for support in electronic microscopy techniques. We are thankful to Jan Krajíček, who conducted the initial analyses of pterins. J.B. is thankful to Radek Šanda for his patience and support as Head of the Department of Zoology in the National museum. We are thankful to Jan Raška, Gerardo Antonio Cordero, and two anonymous reviewers for their fruitful comments on the manuscript. J.B. dedicates this study to his (growing) family.
Ethics
No human tissues were used in this study. All the turtles used in this study were captured in the wild in accordance with Regional Decrees 14/2013 and 213/2009 on control measures on invasive alien species in the Valencian Community. All procedures performed were in accordance with the ethical standards of Direcció General de Medi Natural i d' Avaluació Ambiental, specially the 4/1994 Regional Act on Pets Protection. All applicable international, national and/or institutional guidelines for the care and use of animals were followed. No other permissions were required prior to conducting the research.
Data accessibility
Reflectance spectra data, reflectance spectra summary variables, R script of spectral analyses, reflecting platelets electromicrographs, reflecting platelets measurements and Fourier analyses output files: https://doi.org/10.5061/dryad.b68b048 [56].
Authors' contributions
J.B. conceived the study, designed the study, coordinated the study, measured reflectance spectra, collected sample tissues, carried out the histological laboratory work, carried out microscopical observation, carried out the statistical analyses, carried out reflective platelets measurements and analyses, carried out Fourier analyses, participated in carotenoid analyses, drafted manuscript; J.V.B. carried out the fieldwork, communicated with local authorities; Z.B. supervised and carried out the pterins analyses, helped to draft the manuscript; J.G. participated in Fourier analyses; M.H. carried out pterins analyses; K.K. supervised and financially supported J.B., supervised statistical analyses, helped to draft the manuscript; P.M. conceived the study, carried out the carotenoid analyses, helped to draft the manuscript; E.F. conceived the study, designed the study, financially supported the study, supervised histological and microscopical techniques, coordinated the study, drafted manuscript. All authors gave final approval for publication.
Competing interests
We have no competing interests.
Funding
J.B. was financially supported by the Charles University (SVV 260434/2018) by the Ministry of Culture of the Czech Republic (DKRVO 2019-2023/ 6.VII.a, 00023272). M.H. was financially supported by the Charles University, project GA UK No 760216 and the project of the Specific University Research (SVV260440).
References
- 1.Kleisner K. 2010. Re-semblance and re-evolution: paramorphism and semiotic co-option may explain the re-evolution of similar phenotypes. Sign Syst. Stud. 38, 378–392. ( 10.12697/sss.2010.38.1-4.13) [DOI] [Google Scholar]
- 2.Gould SJ, Vrba ES. 1982. Exaptation—a missing term in the science of form. Paleobiology 8, 4–15. ( 10.1017/S0094837300004310) [DOI] [Google Scholar]
- 3.Badyaev AV. 2004. Developmental perspective on the evolution of sexual ornaments. Evol. Ecol. Res. 6, 975–991. [Google Scholar]
- 4.Grether GF, Kolluru GR, Nersissian K. 2004. Individual colour patches as multicomponent signals. Biol. Rev. 79, 583–610. ( 10.1017/S1464793103006390) [DOI] [PubMed] [Google Scholar]
- 5.Eliason CM, Maia R, Shawkey MD. 2015. Modular color evolution facilitated by a complex nanostructure in birds. Evolution 69, 357–367. ( 10.1111/evo.12575) [DOI] [PubMed] [Google Scholar]
- 6.Eliason CM. 2018. How do complex animal signals evolve? PLoS Biol. 16, e3000093 ( 10.1371/journal.pbio.3000093) [DOI] [PMC free article] [PubMed] [Google Scholar]
- 7.Cuthill IC, et al. 2017. The biology of color. Science 357, eaan0221 ( 10.1126/science.aan0221) [DOI] [PubMed] [Google Scholar]
- 8.Shawkey MD, D'Alba L. 2017. Interactions between colour-producing mechanisms and their effects on the integumentary colour palette. Phil. Trans. R. Soc. B 372, 20160536 ( 10.1098/rstb.2016.0536) [DOI] [PMC free article] [PubMed] [Google Scholar]
- 9.Hall BK. 2008. The neural crest and neural crest cells in vertebrate development and evolution, 400 pp Boston, MA: Springer. [Google Scholar]
- 10.Jeffery WR, Strickler AG, Yamamoto Y. 2004. Migratory neural crest-like cells form body pigmentation in a urochordate embryo. Nature 431, 696–699. ( 10.1038/nature02975) [DOI] [PubMed] [Google Scholar]
- 11.Donoghue PCJ, Graham A, Kelsh RN. 2008. The origin and evolution of the neural crest. Bioessays 30, 530–541. ( 10.1002/bies.20767) [DOI] [PMC free article] [PubMed] [Google Scholar]
- 12.Schartl M, Larue L, Goda M, Bosenberg MW, Hashimoto H, Kelsh RN. 2016. What is a vertebrate pigment cell? Pigment Cell Melanoma Res. 29, 8–14. ( 10.1111/pcmr.12409) [DOI] [PubMed] [Google Scholar]
- 13.Bagnara JT, Matsumoto J, Ferris W, Frost SK, Turner WA, Tchen TT, Taylor JD. 1979. Common origin of pigment cells. Science 203, 410–415. ( 10.1126/science.760198) [DOI] [PubMed] [Google Scholar]
- 14.Sherbrooke WC, Frost SKV. 1989. Integumental chromatophores of a color-change, thermoregulating lizard, Phrynosoma modestum (Iguanidae, Reptilia). American Museum novitates, 2943, 14 p.
- 15.Prum RO, Morrison RL, Ten Eyck GR. 1994. Structural color production by constructive reflection from ordered collagen arrays in a bird (Philepitta castanea: Eurylaimidae). J. Morphol. 222, 61–72. ( 10.1002/jmor.1052220107) [DOI] [PubMed] [Google Scholar]
- 16.Saenko SV, Teyssier J, Van Der Marel D, Milinkovitch MC.. 2013. Precise colocalization of interacting structural and pigmentary elements generates extensive color pattern variation in Phelsuma lizards. BMC Biol. 11, 105 ( 10.1186/1741-7007-11-105) [DOI] [PMC free article] [PubMed] [Google Scholar]
- 17.Prum RO, Torres RH. 2004. Structural colouration of mammalian skin: convergent evolution of coherently scattering dermal collagen arrays. J. Exp. Biol. 207, 2157–2172. ( 10.1242/jeb.00989) [DOI] [PubMed] [Google Scholar]
- 18.Prum RO, Torres R. 2003. Structural colouration of avian skin: convergent evolution of coherently scattering dermal collagen arrays. J. Exp. Biol. 206, 2409–2429. ( 10.1242/jeb.00431) [DOI] [PubMed] [Google Scholar]
- 19.Moll EO, Matson KE, Krehbiel EB. 1981. Sexual and seasonal dichromatism in the Asian river turtle Callagur borneoensis. Herpetologica 37, 181–194. [Google Scholar]
- 20.Fujii R. 1993. Cytophysiology of fish chromatophores. In International review of cytology (eds KW Jeon, M Fredlander, J Jarvik), pp. 191–255. San Diego, CA: Academic Press. [Google Scholar]
- 21.Dufresne ER, Noh H, Saranathan V, Mochrie SGJ, Cao H, Prum RO. 2009. Self-assembly of amorphous biophotonic nanostructures by phase separation. Soft Matter 5, 1792–1795. ( 10.1039/b902775k) [DOI] [Google Scholar]
- 22.Crawford NG, Parham JF, Sellas AB, Faircloth BC, Glenn TC, Papenfuss TJ, Henderson JB, Hansen MH, Simison WB. 2015. A phylogenomic analysis of turtles. Mol. Phylogenet. Evol. 83, 250–257. ( 10.1016/j.ympev.2014.10.021) [DOI] [PubMed] [Google Scholar]
- 23.Vetter H, van Dijk PP. 2006. Terralog: Turtles of the World Vol. 4–East and South Asia. Chimaira, Frankfurt am Main. 160 p.
- 24.Vetter H. 2004. Terralog: Turtles of the World, Vol. 2, North America. Chimaira, Frankfurt am Main. 120 p.
- 25.Vetter H. 2011. Terralog: Turtles of the world Vol. 1: Africa, Europe and Western Asia (second edition). Chimaira, Frankfurt am Main. 152 pp.
- 26.Vetter H. 2005. Terralog: Turtles of the World, Vol. 3, Central and South America. Chimaira, Frankfurt am Main. 127 p. [Google Scholar]
- 27.Alibardi L. 2013. Observations on the ultrastructure and distribution of chromatophores in the skin of chelonians. Acta Zool. 94, 222–232. ( 10.1111/j.1463-6395.2011.00546.x) [DOI] [Google Scholar]
- 28.Steffen JE, Hultberg J, Drozda S. 2019. The effect of dietary carotenoid increase on painted turtle spot and stripe color. Comp. Biochem. Physiol. B Biochem. Mol. Biol. 229, 10–17. ( 10.1016/j.cbpb.2018.12.002) [DOI] [PubMed] [Google Scholar]
- 29.Gopalakrishnakone P. 1986. The structure of the pigment cells in the turtle Trionyx sinensis. Arch. Histol. Jpn. 49, 421–435. ( 10.1679/aohc.49.421) [DOI] [PubMed] [Google Scholar]
- 30.Steffen JE, Learn KM, Drumheller JS, Boback SM, McGraw KJ. 2015. Carotenoid composition of colorful body stripes and patches in the painted turtle (Chrysemys picta) and red-eared slider (Trachemys scripta). Chelonian Conserv. Biol. 14, 56–63. ( 10.2744/ccab-14-01-56-63.1) [DOI] [Google Scholar]
- 31.Twyman H, Valenzuela N, Literman R, Andersson S, Mundy NI. 2016. Seeing red to being red: conserved genetic mechanism for red cone oil droplets and co-option for red coloration in birds and turtles. Proc. R. Soc. B 283, 20161208 ( 10.1098/rspb.2016.1208) [DOI] [PMC free article] [PubMed] [Google Scholar]
- 32.Odate S, Tatebe Y, Obika M, Hama T.. 1959. Pteridine derivatives in Reptilian skin. Proc. Jpn. Acad. 35, 567–570. ( 10.2183/pjab1945.35.567) [DOI] [Google Scholar]
- 33.Legler JM. 1990. The genus Pseudemys in Mesoamerica: taxonomy, distribution, and origins. In Life history and ecology of the slider turtle (ed. Gibbons JW.), pp. 82–105. Washington, DC: Smithsonian Institution Press. [Google Scholar]
- 34.Seidel ME, Ernst CH. 2017. A systematic review of the turtle family Emydidae. Vertebr. Zool. 67, 1–122. [Google Scholar]
- 35.Dominy AE. 2015. Modeling underwater visual ability and varied color expression in the diamondback terrapin (Malaclemys terrapin) in relation to potential mate preference by females. Drexel University. 102 p.
- 36.Bulté G, Germain RR, O'connor CM, Blouin-Demers G. 2013. Sexual dichromatism in the northern map turtle, Graptemys geographica. Chelonian Conserv. Biol. 12, 187–192. ( 10.2744/ccb-0995a.1) [DOI] [Google Scholar]
- 37.Rowe JW, Bunce CF, Clark DL. 2014. Spectral reflectance and substrate color-induced melanization in immature and adult Midland painted turtles (Chrysemys picta marginata). Amphibia-Reptilia 35, 149–159. ( 10.1163/15685381-00002934) [DOI] [Google Scholar]
- 38.Rowe JW, Gradel JR, Bunce CF, Clark DL. 2012. Sexual dimorphism in size and shell shape, and dichromatism of spotted turtles (Clemmys guttata) in Southwestern Michigan. Amphibia-Reptilia 33, 443–450. ( 10.1163/15685381-00002847) [DOI] [Google Scholar]
- 39.Endler JA, Thery M. 1996. Interacting effects of lek placement, display behavior, ambient light, and color patterns in three neotropical forest-dwelling birds. Am. Nat. 148, 421–452. ( 10.1086/285934) [DOI] [Google Scholar]
- 40.White TE, Zeil J, Kemp DJ. 2015. Signal design and courtship presentation coincide for highly biased delivery of an iridescent butterfly mating signal. Evolution 69, 14–25. ( 10.1111/evo.12551) [DOI] [PMC free article] [PubMed] [Google Scholar]
- 41.Simpson RK, McGraw KJ. 2018. It's not just what you have, but how you use it: solar-positional and behavioural effects on hummingbird colour appearance during courtship. Ecol. Lett. 21, 1413–1422. ( 10.1111/ele.13125) [DOI] [PubMed] [Google Scholar]
- 42.Liu Y, Davy CM, Shi H-T, Murphy RW. 2013. Sex in the half-shell: a review of the functions and evolution of courtship behavior in freshwater turtles. Chelonian Conserv. Biol. 12, 84–100. ( 10.2744/ccb-1037.1) [DOI] [Google Scholar]
- 43.Kramer M, Fritz U. 1989. Courtship of the turtle, Pseudemys nelsoni. J. Herpetol. 23, 84–86. ( 10.2307/1564324) [DOI] [Google Scholar]
- 44.Cagle FR. 1950. The life history of the slider turtle, Pseudemys scripta troostii (Holbrook). Ecol. Monogr. 20, 31–54. ( 10.2307/1943522) [DOI] [Google Scholar]
- 45.Jackson CG, Davis JD. 1972. Courtship display behavior of Chrysemys concinna suwanniensis. Copeia 1972, 385–387. ( 10.2307/1442510) [DOI] [Google Scholar]
- 46.Jackson CG Jr, Davis JD. 1972. A quantitative study of the courtship display of the red-eared turtle, Chrysemys scripta elegans (Wied). Herpetologica 28, 58–64. [Google Scholar]
- 47.Fritz U, Wilhelma Z-BG. 1999. Courtship behaviour and systematics in the subtribe Nectemydina 2. A comparison above the species level and remarks on the evolution of behaviour elements. Bullefin Chicago Herpetol. Soc. 11, 225–236. [Google Scholar]
- 48.Andersson S, Prager M. 2006. Quantifying colors. In Bird coloration, volume 1: mechanisms and measurements (eds Hill GE, McGraw KJ), pp. 41–89. Boston, MA: Harvard University Press. [Google Scholar]
- 49.Lovich JE, McCoy CJ, Garstka WR. 1990. The development and significance of melanism in the slider turtle. In Life history and ecology of the slider turtle (ed. Gibbons JW.), pp. 233–254. Washington, DC: Smithsonian Institution Press. [Google Scholar]
- 50.R Core Team. 2017. R: a language and environment for statistical computing. Vienna, Austria: R Foundation for Statistical Computing. [Google Scholar]
- 51.Maia R, Eliason CM, Bitton P, Doucet SM, Shawkey MD. 2013. pavo: an R package for the analysis, visualization and organization of spectral data. Methods Ecol. Evol. 4, 906–913. ( 10.1111/2041-210x.12069) [DOI] [Google Scholar]
- 52.Montgomerie R. 2006. Analyzing colors. In Bird coloration, volume 1: mechanisms and measurements (eds Hill GE, McGraw KJ), pp. 90–147. Boston, MA: Harvard University Press. [Google Scholar]
- 53.Andersson S, Andersson M. 1998. Ultraviolet sexual dimorphism and assortative mating in blue tits. Proc. R. Soc. Lond. B 265, 445–450. ( 10.1098/rspb.1998.0315) [DOI] [Google Scholar]
- 54.Oksanen J, et al. 2015. vegan: Community Ecology Package. R package version 2.0-10. https://github.com/vegandevs/vegan .
- 55.Legendre P, Gallagher ED. 2001. Ecologically meaningful transformations for ordination of species data. Oecologia 129, 271–280. ( 10.1007/s004420100716) [DOI] [PubMed] [Google Scholar]
- 56.Brejcha J, Bataller J-V, Bosáková Z, Geryk J, Havlíková M, Kleisner K, Maršík P, Font E. 2019. Data from: Body coloration and mechanisms of colour production in Archelosauria: the case of deirocheline turtles Dryad Digital Repository. ( 10.5061/dryad.b68b048) [DOI] [PMC free article] [PubMed]
- 57.Rasband WS. 1997. ImageJ. Bethesda, MD: US National Institutes of Health. [Google Scholar]
- 58.Teyssier J, Saenko SV, Van Der Marel D, Milinkovitch MC.. 2015. Photonic crystals cause active colour change in chameleons. Nat. Commun. 6, 6368 ( 10.1038/ncomms7368) [DOI] [PMC free article] [PubMed] [Google Scholar]
- 59.Morrison RL. 1995. A transmission electron microscopic (TEM) method for determining structural colors reflected by lizard iridophores. Pigment Cell Melanoma Res. 8, 28–36. ( 10.1111/j.1600-0749.1995.tb00771.x) [DOI] [PubMed] [Google Scholar]
- 60.Haisten DC, Paranjpe D, Loveridge S, Sinervo B. 2015. The cellular basis of polymorphic coloration in common side-blotched lizards, Uta stansburiana. Herpetologica 71, 125–135. ( 10.1655/herpetologica-d-13-00091) [DOI] [Google Scholar]
- 61.Denton EJ, Land MF.. 1971. Mechanism of reflexion in silvery layers of fish and cephalopods. Proc. R. Soc. Lond. B 178, 43–61. ( 10.1098/rspb.1971.0051) [DOI] [PubMed] [Google Scholar]
- 62.Rohrlich ST, Porter KR. 1972. Fine structural observations relating to the production of color by the iridophores of a lizard, Anolis carolinensis. J. Cell Biol. 53, 38–52. ( 10.1083/jcb.53.1.38) [DOI] [PMC free article] [PubMed] [Google Scholar]
- 63.Prum RO, Torres RH. 2003. A Fourier tool for the analysis of coherent light scattering by bio-optical nanostructures. Integr. Comp. Biol. 43, 591–602. ( 10.1093/icb/43.4.591) [DOI] [PubMed] [Google Scholar]
- 64.The MathWorks Inc. 1996. MATLAB: Application program interface guide.
- 65.Adobe Systems Inc. 2005. Adobe Photoshop CS3.
- 66.Leonard DW, Meek KM. 1997. Refractive indices of the collagen fibrils and extrafibrillar material of the corneal stroma. Biophys. J. 72, 1382–1387. ( 10.1016/s0006-3495(97)78784-8) [DOI] [PMC free article] [PubMed] [Google Scholar]
- 67.Briggs WL, Henson VE. 1995. The DFT. An owner's manual. Philadelphia, PA: SIAM. [Google Scholar]
- 68.Benedek GB. 1971. Theory of transparency of the eye. Appl. Opt. 10, 459–473. ( 10.1364/ao.10.000459) [DOI] [PubMed] [Google Scholar]
- 69.Krajíček J, Kozlík P, Exnerová A, Štys P, Bursová M, Čabala R, Bosáková Z. 2014. Capillary electrophoresis of pterin derivatives responsible for the warning coloration of Heteroptera. J. Chromatogr. A 1336, 94–100. ( 10.1016/j.chroma.2014.02.019) [DOI] [PubMed] [Google Scholar]
- 70.Ferré J, Silva FJ, Real MD, Ménsua JL. 1986. Pigment patterns in mutants affecting the biosynthesis of pteridines and xanthommatin in Drosophila melanogaster. Biochem. Genet. 24, 545–569. ( 10.1007/bf00504334) [DOI] [PubMed] [Google Scholar]
- 71.Kozlík P, Krajíček J, Kalíková K, Tesařová E, Čabala R, Exnerová A, Štys P, Bosáková Z. 2013. Hydrophilic interaction liquid chromatography with tandem mass spectrometric detection applied for analysis of pteridines in two Graphosoma species (Insecta: Heteroptera). J. Chromatogr. B 930, 82–89. ( 10.1016/j.jchromb.2013.05.004) [DOI] [PubMed] [Google Scholar]
- 72.Andrade P, et al. 2019. Regulatory changes in pterin and carotenoid genes underlie balanced color polymorphisms in the wall lizard. Proc. Natl Acad. Sci. USA 116, 5633–5642. ( 10.1101/481895) [DOI] [PMC free article] [PubMed] [Google Scholar]
- 73.Matsumoto J. 1965. Studies on fine structure and cytochemical properties of erythrophores in swordtail, Xiphophorus helleri, with special reference to their pigment granules (pterinosomes). J. Cell Biol. 27, 493–504. ( 10.1083/jcb.27.3.493) [DOI] [PMC free article] [PubMed] [Google Scholar]
- 74.Obika M. 1993. Formation of pterinosomes and carotenoid granules in xanthophores of the teleost Oryzias latipes as revealed by the rapid-freezing and freeze-substitution method. Cell Tissue Res. 271, 81–86. ( 10.1007/bf00297544) [DOI] [Google Scholar]
- 75.Ernst CH, Barbour RW. 1989. Turtles of the world, 416 pp Washington, DC: Smithsonian Institution Press. [Google Scholar]
- 76.Lindgren J, et al. 2015. Molecular composition and ultrastructure of Jurassic paravian feathers. Sci. Rep. 5, 13520 ( 10.1038/srep13520) [DOI] [PMC free article] [PubMed] [Google Scholar]
- 77.Manning PL, et al. 2013. Synchrotron-based chemical imaging reveals plumage patterns in a 150 million year old early bird. J. Anal. At. Spectrom. 28, 1024–1030. ( 10.1039/c3ja50077b) [DOI] [Google Scholar]
- 78.Li Q, Gao KQ, Vinther J, Shawkey MD, Clarke JA, D'Alba L, Meng Q, Briggs DE, Prum RO. 2010. Plumage color patterns of an extinct dinosaur. Science 327, 1369 ( 10.1126/science.1186290) [DOI] [PubMed] [Google Scholar]
- 79.Li Q, et al. 2012. Reconstruction of Microraptor and the evolution of iridescent plumage. Science 335, 1215–1219. ( 10.1126/science.1213780) [DOI] [PubMed] [Google Scholar]
- 80.Lingham-Soliar T, Plodowski G. 2010. The integument of Psittacosaurus from Liaoning Province, China: taphonomy, epidermal patterns and color of a ceratopsian dinosaur. Naturwissenschaften 97, 479–486. ( 10.1007/s00114-010-0661-3) [DOI] [PubMed] [Google Scholar]
- 81.Vinther J, Nicholls R, Lautenschlager S, Pittman M, Kaye TG, Rayfield E, Mayr G, Cuthill IC. 2016. 3D camouflage in an ornithischian dinosaur. Curr. Biol. 26, 2456–2462. ( 10.1016/j.cub.2016.06.065) [DOI] [PMC free article] [PubMed] [Google Scholar]
- 82.Hu D, et al. 2018. A bony-crested Jurassic dinosaur with evidence of iridescent plumage highlights complexity in early paravian evolution. Nat. Commun. 9, 217 ( 10.1038/s41467-017-02515-y) [DOI] [PMC free article] [PubMed] [Google Scholar]
- 83.Wang Z, et al. 2013. The draft genomes of soft-shell turtle and green sea turtle yield insights into the development and evolution of the turtle-specific body plan. Nat. Genet. 45, 701 ( 10.1038/ng.2615) [DOI] [PMC free article] [PubMed] [Google Scholar]
- 84.Shaffer HB, et al. 2013. The western painted turtle genome, a model for the evolution of extreme physiological adaptations in a slowly evolving lineage. Genome Biol. 14, R28 ( 10.1186/gb-2013-14-3-r28) [DOI] [PMC free article] [PubMed] [Google Scholar]
- 85.Tollis M, DeNardo DF, Cornelius JA, Dolby GA, Edwards T, Henen BT, Karl AE, Murphy RW, Kusumi K. 2017. The Agassiz's desert tortoise genome provides a resource for the conservation of a threatened species. PLoS ONE 12, e0177708 ( 10.1371/journal.pone.0177708) [DOI] [PMC free article] [PubMed] [Google Scholar]
- 86.Alibardi L. 2011. Histology, ultrastructure, and pigmentation in the horny scales of growing crocodilians. Acta Zool. 92, 187–200. ( 10.1111/j.1463-6395.2010.00469.x) [DOI] [Google Scholar]
- 87.Spearman RIC, Riley PA. 1969. A comparison of the epidermis and pigment cells of the crocodile with those in two lizard species. Zool. J. Linn. Soc. 48, 453–466. ( 10.1111/j.1096-3642.1969.tb00723.x) [DOI] [Google Scholar]
- 88.Herring PJ. 1994. Reflective systems in aquatic animals. Comp. Biochem. Physiol. A Physiol. 109, 513–546. ( 10.1016/0300-9629(94)90192-9) [DOI] [Google Scholar]
- 89.Thayer AH. 1896. The law which underlies protective coloration. Auk 13, 124–129. ( 10.2307/4068693) [DOI] [Google Scholar]
- 90.Bustard HR. 1970. The adaptive significance of coloration in hatchling green sea turtles. Herpetologica 26, 224–227. [Google Scholar]
- 91.Ruxton GD, Speed MP, Kelly DJ. 2004. What, if anything, is the adaptive function of countershading? Anim. Behav. 68, 445–451. ( 10.1016/j.anbehav.2003.12.009) [DOI] [Google Scholar]
- 92.Rowe JW, Clark DL, Mortensen RA, Commissaris CV, Wittle LW, Tucker JK. 2016. Thermal and substrate color-induced melanization in laboratory reared red-eared sliders (Trachemys scripta elegans). J. Therm. Biol. 61, 125–132. ( 10.1016/j.jtherbio.2016.09.005) [DOI] [PubMed] [Google Scholar]
- 93.Rowe JW, Martin CE, Kamp KR, Clark DL. 2017. Spectral reflectance of Blanding's turtle (Emydoidea blandingii) and substrate color-induced melanization in laboratory-reared turtles. Herpetol. Conserv. Biol. 12, 576–584. [Google Scholar]
- 94.Rowe JW, Clark DL, Ryan C, Tucker JK. 2006. Effect of substrate color on pigmentation in midland painted turtles (Chrysemys picta marginata) and red-eared slider turtles (Trachemys scripta elegans). J. Herpetol. 40, 358.–. ( 10.1670/0022-1511(2006)40[358:eoscop]2.0.co;2) [DOI] [Google Scholar]
- 95.Polo-Cavia N, López P, Martín J. 2013. Head coloration reflects health state in the red-eared slider Trachemys scripta elegans. Behav. Ecol. Sociobiol. 67, 153–162. ( 10.1007/s00265-012-1435-z) [DOI] [Google Scholar]
- 96.Wang JC, Yang CC, Liang W, Shi HT. 2013. Spectra analysis reveals the sexual dichromatism of red-eared slider turtle (Trachemys scripta). Zool. Res. 34, 475–478. [PubMed] [Google Scholar]
- 97.Arnold K, Neumeyer C. 1987. Wavelength discrimination in the turtle Pseudemys scripta elegans. Vision Res. 27, 1501–1511. ( 10.1016/0042-6989(87)90159-3) [DOI] [PubMed] [Google Scholar]
- 98.Loew ER, Govardovskii VI. 2001. Photoreceptors and visual pigments in the red-eared turtle, Trachemys scripta elegans. Vis. Neurosci. 18, 753–757. ( 10.1017/s0952523801185081) [DOI] [PubMed] [Google Scholar]
- 99.Ibáñez A, Martín J, Marzal A, Bertolero A. 2017. The effect of growth rate and ageing on colour variation of European pond turtles. Sci. Nat. 104, 49 ( 10.1007/s00114-017-1469-1) [DOI] [PubMed] [Google Scholar]
- 100.Smith HM, Kritsky DC, Holland RL. 1969. Reticulate melanism in the painted turtle. J. Herpetol. 3, 173–176. ( 10.2307/1562961) [DOI] [Google Scholar]
- 101.Djurdjevič I, Kreft ME, Sušnik Bajec S. 2015. Comparison of pigment cell ultrastructure and organisation in the dermis of marble trout and brown trout, and first description of erythrophore ultrastructure in salmonids. J. Anat. 227, 583–595. ( 10.1111/joa.12373) [DOI] [PMC free article] [PubMed] [Google Scholar]
- 102.Montoyo YG, García M, Segovia Y. 2018. Light and electron microscopic studies on the retina of the booted eagle (Aquila pennata). Zoomorphology 137, 177–190. ( 10.1007/s00435-017-0373-8) [DOI] [Google Scholar]
- 103.Lipetz LE. 1984. Pigment types, densities and concentrations in cone oil droplets of Emydoidea blandingii. Vision Res. 24, 605–612. ( 10.1016/0042-6989(84)90115-9) [DOI] [PubMed] [Google Scholar]
- 104.Goldsmith TH, Collins JS, Licht S. 1984. The cone oil droplets of avian retinas. Vision Res. 24, 1661–1671. ( 10.1016/0042-6989(84)90324-9) [DOI] [PubMed] [Google Scholar]
- 105.Manukyan L, Montandon SA, Fofonjka A, Smirnov S, Milinkovitch MC. 2017. A living mesoscopic cellular automaton made of skin scales. Nature 544, 173–179. ( 10.1038/nature22031) [DOI] [PubMed] [Google Scholar]
- 106.van de Hulst HC. 1981. Light scattering by small particles, 470 p New York, NY: Courier Corporation. [Google Scholar]
- 107.Gur D, Palmer BA, Weiner S, Addadi L. 2017. Light manipulation by guanine crystals in organisms: biogenic scatterers, mirrors, multilayer reflectors and photonic crystals. Adv. Funct. Mater. 27, 1603514 ( 10.1002/adfm.201603514) [DOI] [Google Scholar]
- 108.Levy-Lior A, Shimoni E, Schwartz O, Gavish-Regev E, Oron D, Oxford G, Weiner S, Addadi L. 2010. Guanine-based biogenic photonic-crystal arrays in fish and spiders. Adv. Funct. Mater. 20, 320–329. ( 10.1002/adfm.200901437) [DOI] [Google Scholar]
- 109.Shawkey MD, Hill GE. 2005. Carotenoids need structural colours to shine. Biol. Lett. 1, 121–124. ( 10.1098/rsbl.2004.0289) [DOI] [PMC free article] [PubMed] [Google Scholar]
- 110.Steffen JE, McGraw KJ. 2007. Contributions of pterin and carotenoid pigments to dewlap coloration in two anole species. Comp. Biochem. Physiol. B Biochem. Mol. Biol. 146, 42–46. ( 10.1016/j.cbpb.2006.08.017)) [DOI] [PubMed] [Google Scholar]
- 111.Saks L, McGraw K, Hõrak P. 2003. How feather colour reflects its carotenoid content. Funct. Ecol. 17, 555–561. ( 10.1046/j.1365-2435.2003.00765.x) [DOI] [Google Scholar]
- 112.Weaver RJ, Santos ESA, Tucker AM, Wilson AE, Hill GE. 2018. Carotenoid metabolism strengthens the link between feather coloration and individual quality. Nat. Commun. 9, 73 ( 10.1038/s41467-017-02649-z) [DOI] [PMC free article] [PubMed] [Google Scholar]
- 113.Beltran JCM, Stange C.. 2016. Apocarotenoids: a new carotenoid-derived pathway. In Carotenoids in nature (ed. Stange C.), pp. 239–272. Cham, Switzerland: Springer. [DOI] [PubMed] [Google Scholar]
- 114.Giuliano G, Al-Babili S, Von Lintig J.. 2003. Carotenoid oxygenases: cleave it or leave it. Trends Plant Sci. 8, 145–149. ( 10.1016/s1360-1385(03)00053-0) [DOI] [PubMed] [Google Scholar]
- 115.Von Lintig J. 2010. Colors with functions: elucidating the biochemical and molecular basis of carotenoid metabolism. Annu. Rev. Nutr. 30, 35–56. ( 10.1146/annurev-nutr-080508-141027) [DOI] [PubMed] [Google Scholar]
- 116.Toomey MB, Collins AM, Frederiksen R, Cornwall MC, Timlin JA, Corbo JC. 2015. A complex carotenoid palette tunes avian colour vision. J. R. Soc. Interface 12, 20150563 ( 10.1098/rsif.2015.0563) [DOI] [PMC free article] [PubMed] [Google Scholar]
- 117.Li B, et al. 2014. Inactivity of human β, β-carotene-9′, 10′-dioxygenase (BCO2) underlies retinal accumulation of the human macular carotenoid pigment. Proc. Natl Acad. Sci. USA 111, 10 173–10 178. ( 10.1073/pnas.1402526111) [DOI] [PMC free article] [PubMed] [Google Scholar]
- 118.Cuervo JJ, Belliure J, Negro JJ. 2016. Coloration reflects skin pterin concentration in a red-tailed lizard. Comp. Biochem. Physiol. B Biochem. Mol. Biol. 193, 17–24. ( 10.1016/j.cbpb.2015.11.011) [DOI] [PubMed] [Google Scholar]
- 119.Weiss SL, Foerster K, Hudon J. 2012. Pteridine, not carotenoid, pigments underlie the female-specific orange ornament of striped plateau lizards (Sceloporus virgatus). Comp. Biochem. Physiol. B Biochem. Mol. Biol. 161, 117–123. ( 10.1016/j.cbpb.2011.10.004) [DOI] [PubMed] [Google Scholar]
- 120.Braasch I, Schartl M, Volff J-N. 2007. Evolution of pigment synthesis pathways by gene and genome duplication in fish. BMC Evol. Biol. 7, 74 ( 10.1186/1471-2148-7-74) [DOI] [PMC free article] [PubMed] [Google Scholar]
- 121.Steffen JE, McGraw KJ. 2009. How dewlap color reflects its carotenoid and pterin content in male and female brown anoles (Norops sagrei). Comp. Biochem. Physiol. B Biochem. Mol. Biol. 154, 334–340. ( 10.1016/j.cbpb.2009.07.009) [DOI] [PubMed] [Google Scholar]
- 122.Ibáñez A, Polo-Cavia N, López P, Martín J. 2014. Honest sexual signaling in turtles: experimental evidence of a trade-off between immune response and coloration in red-eared sliders Trachemys scripta elegans. Naturwissenschaften 101, 803–811. ( 10.1007/s00114-014-1219-6) [DOI] [PubMed] [Google Scholar]
- 123.Grether GF, Hudon J, Endler JA. 2001. Carotenoid scarcity, synthetic pteridine pigments and the evolution of sexual coloration in guppies (Poecilia reticulata). Proc. R. Soc. Lond. B 268, 1245–1253. [DOI] [PMC free article] [PubMed] [Google Scholar]
- 124.McGraw KJ. 2005. The antioxidant function of many animal pigments: are there consistent health benefits of sexually selected colourants? Anim. Behav. 69, 757–764 ( 10.1016/j.anbehav.2004.06.022.) [DOI] [Google Scholar]
- 125.McGraw KJ, Ardia DR. 2003. Carotenoids, immunocompetence, and the information content of sexual colors: an experimental test. Am. Nat. 162, 704–712. ( 10.1086/378904) [DOI] [PubMed] [Google Scholar]
- 126.Andersson M, Simmons LW. 2006. Sexual selection and mate choice. Trends Ecol. Evol. 21, 296–302. ( 10.1016/j.tree.2006.03.015) [DOI] [PubMed] [Google Scholar]
- 127.Stevens M, Merilaita S. 2008. Defining disruptive coloration and distinguishing its functions. Phil. Trans. R. Soc. B 364, 481–488. ( 10.1098/rstb.2008.0216) [DOI] [PMC free article] [PubMed] [Google Scholar]
- 128.Kondo S, Miura T. 2010. Reaction-diffusion model as a framework for understanding biological pattern formation. Science 329, 1616–1620. [DOI] [PubMed] [Google Scholar]
- 129.Patterson LB, Bain EJ, Parichy DM. 2014. Pigment cell interactions and differential xanthophore recruitment underlying zebrafish stripe reiteration and Danio pattern evolution. Nat. Commun. 5, 5299 ( 10.1038/ncomms6299) [DOI] [PMC free article] [PubMed] [Google Scholar]
- 130.Murray JD. 2003. Mathematical biology II—spatial models and biomedical applications, 814 pp New York, NY: Springer. [Google Scholar]
- 131.Turing AM. 1952. The chemical basis of morphogenesis. Phil. Trans. R. Soc. Lond. B 237, 37–72. ( 10.1098/rstb.1952.0012) [DOI] [PMC free article] [PubMed] [Google Scholar]
- 132.Rice R, Cebra-Thomas J, Haugas M, Partanen J, Rice DPC, Gilbert SF. 2017. Melanoblast development coincides with the late emerging cells from the dorsal neural tube in turtle Trachemys scripta. Sci. Rep. 7, 12063 ( 10.1038/s41598-017-12352-0) [DOI] [PMC free article] [PubMed] [Google Scholar]
- 133.Hou L, Takeuchi T. 1991. Differentiation of extracutaneous melanocytes in embryos of the turtle, Trionyx sinensis japonicus. Pigment Cell Melanoma Res. 4, 158–162. ( 10.1111/j.1600-0749.1991.tb00433.x) [DOI] [PubMed] [Google Scholar]
- 134.Macedonia JM, James S, Wittle LW, Clark DL. 2000. Skin pigments and coloration in the Jamaican radiation of Anolis lizards. J. Herpetol. 34, 99–109. ( 10.2307/1565245) [DOI] [Google Scholar]
- 135.Hirata M, Nakamura K, Kanemaru T, Shibata Y, Kondo S. 2003. Pigment cell organization in the hypodermis of zebrafish. Dev. Dyn. 227, 497–503. ( 10.1002/dvdy.10334) [DOI] [PubMed] [Google Scholar]
- 136.Yasutomi M, Yamada S. 1998. Formation of the dermal chromatophore unit (DCU) in the tree frog Hyla arborea. Pigment Cell Res. 11, 198–205. ( 10.1111/j.1600-0749.1998.tb00730.x) [DOI] [PubMed] [Google Scholar]
- 137.Nielsen HI, Dyck J. 1978. Adaptation of the tree frog, Hyla cinerea, to colored backgrounds, and the role of the three chromatophore types. J. Exp. Zool. 205, 79–94. ( 10.1002/jez.1402050111) [DOI] [Google Scholar]
- 138.Kuriyama T, Miyaji K, Sugimoto M, Hasegawa M. 2006. Ultrastructure of the dermal chromatophores in a lizard (Scincidae: Plestiodon latiscutatus) with conspicuous body and tail coloration. Zoolog. Sci. 23, 793–799. ( 10.2108/zsj.23.793) [DOI] [PubMed] [Google Scholar]
- 139.Ernst CH. 1972. Temperature-activity relationship in the painted turtle, Chrysemys picta. Copeia 1972, 217–222. ( 10.2307/1442479) [DOI] [Google Scholar]
- 140.Bury RB, Wolfheim JH. 1973. Aggression in free-living pond turtles (Clemmys marmorata). Bioscience 23, 659–662. ( 10.2307/1296781) [DOI] [Google Scholar]
- 141.Kobelt F, Linsenmair KE. 1992. Adaptations of the reed frog Hyperolius viridiflavus (Amphibia: Anura: Hyperoliidae) to its arid environment. J. Comp. Physiol. B 162, 314–326. ( 10.1007/bf00301475) [DOI] [PubMed] [Google Scholar]
- 142.Medina I, Newton E, Kearney MR, Mulder RA, Porter WP, Stuart-Fox D. 2018. Reflection of near-infrared light confers thermal protection in birds. Nat. Commun. 9, 3610 ( 10.1038/s41467-018-05898-8) [DOI] [PMC free article] [PubMed] [Google Scholar]
- 143.Stuart-Fox D, Newton E, Mulder RA, D'Alba L, Shawkey MD, Igic B. 2018. The microstructure of white feathers predicts their visible and near-infrared reflectance properties. PLoS ONE 13, e0199129 ( 10.1371/journal.pone.0199129) [DOI] [PMC free article] [PubMed] [Google Scholar]
- 144.Pinkert S, Zeuss D. 2018. Thermal biology: melanin-based energy harvesting across the tree of life. Curr. Biol. 28, R887–R889. ( 10.1016/j.cub.2018.07.026) [DOI] [PubMed] [Google Scholar]
- 145.Kelsh RN, Harris ML, Colanesi S, Erickson CA. 2009. Stripes and belly-spots—a review of pigment cell morphogenesis in vertebrates. Semin. Cell Dev. Biol. 20, 90–104. ( 10.1016/j.semcdb.2008.10.001) [DOI] [PMC free article] [PubMed] [Google Scholar]
- 146.Quevedo WC., Jr 1972. Epidermal melanin units melanocyte-keratinocyte interactions. Am. Zool. 12, 35–41. ( 10.1093/icb/12.1.35) [DOI] [Google Scholar]
- 147.Li Q, Clarke JA, Gao K-Q, Zhou C-F, Meng Q, Li D, D'Alba L, Shawkey MD. 2014. Melanosome evolution indicates a key physiological shift within feathered dinosaurs. Nature 507, 350–353. ( 10.1038/nature12973) [DOI] [PubMed] [Google Scholar]
- 148.Eliason CM, Clarke JA.. 2018. Metabolic physiology explains macroevolutionary trends in the melanic colour system across amniotes. Proc. R. Soc. B 285, 20182014 ( 10.1098/rspb.2018.2014) [DOI] [PMC free article] [PubMed] [Google Scholar]
- 149.Stettenheim PR. 2000. The integumentary morphology of modern birds—an overview. Am. Zool. 40, 461–477. ( 10.1093/icb/40.4.461) [DOI] [Google Scholar]
- 150.Biedermann W. 1928. Vergleichende Physiologie des Integuments der Wirbeltiere. In Ergebnisse der Biologie (eds von Frisch K, Goldschmidt R, Ruhland W, Winterstein H), pp. 360–680. Berlin, Germany: Springer. [Google Scholar]
- 151.Oliphant LW, Hudon J, Bagnara JT. 1992. Pigment cell refugia in homeotherms—the unique evolutionary position of the iris. Pigment Cell Melanoma Res. 5, 367–371. ( 10.1111/j.1600-0749.1992.tb00564.x) [DOI] [PubMed] [Google Scholar]
- 152.Menon GK, Menon J. 2000. Avian epidermal lipids: functional considerations and relationship to feathering. Am. Zool. 40, 540–552. ( 10.1093/icb/40.4.540) [DOI] [Google Scholar]
- 153.Sköld HN, Aspengren S, Cheney KL, Wallin M. 2016. Fish chromatophores—from molecular motors to animal behavior. Int. Rev. Cell Mol. Biol. 321, 171–219. ( 10.1016/bs.ircmb.2015.09.005) [DOI] [PubMed] [Google Scholar]
- 154.Cal L, Suarez-Bregua P, Moran P, Cerdá-Reverter JM, Rotllant J. 2018. Fish pigmentation. A key issue for the sustainable development of fish farming. In Emerging issues in fish larvae research (ed. Yúfera M.), pp. 229–252. Cham, Switzerland: Springer. [Google Scholar]
- 155.Bagnara JT. 1976. Color change. In Physiology of Amphibia (ed. Lofts B.), pp. 1–52. New York, NY: Academic; Press. [Google Scholar]
- 156.DuShane GP. 1943. The embryology of vertebrate pigment cells. Part I. Amphibia. Q. Rev. Biol. 18, 109–127. ( 10.1086/394671) [DOI] [Google Scholar]
- 157.Cooper WE, Greenberg N. 1992. Reptilian coloration and behavior. In Biology of Reptilia, Volume 18, Physiology E, Hormones, Brain and Behaviour (eds Gans C, Crews D), pp. 298–422. Chicago, IL: The University of Chicago Press. [Google Scholar]
- 158.Alibardi L. 2012. Cytology and localization of chromatophores in the skin of the Tuatara (Sphenodon punctaus). Acta Zool. 93, 330–337. ( 10.1111/j.1463-6395.2011.00506.x) [DOI] [Google Scholar]
- 159.Eriksson J, et al. 2008. Identification of the yellow skin gene reveals a hybrid origin of the domestic chicken. PLoS Genet. 4, e1000010 ( 10.1371/journal.pgen.1000010.eor) [DOI] [PMC free article] [PubMed] [Google Scholar]
- 160.McGraw KJ, Toomey MB, Nolan PM, Morehouse NI, Massaro M, Jouventin P. 2007. A description of unique fluorescent yellow pigments in penguin feathers. Pigment Cell Melanoma Res. 20, 301–304. ( 10.1111/j.1600-0749.2007.00386.x) [DOI] [PubMed] [Google Scholar]
- 161.McGraw KJ, et al. 2004. You can't judge a pigment by its color: carotenoid and melanin content of yellow and brown feathers in swallows, bluebirds, penguins, and domestic chickens. Condor 106, 390–395. ( 10.1650/7384) [DOI] [Google Scholar]
- 162.Oliphant LW. 1987. Pteridines and purines as major pigments of the avian iris. Pigment Cell Res. 1, 129–131. ( 10.1111/j.1600-0749.1987.tb00401.x) [DOI] [PubMed] [Google Scholar]
- 163.Obika M, Bagnara JT. 1964. Pteridines as pigments in amphibians. Science 143, 485–487. ( 10.1126/science.143.3605.485) [DOI] [PubMed] [Google Scholar]
- 164.Oliphant LW. 1988. Cytology and pigments of non-melanophore chromatophores in the avian iris. Prog. Clin. Biol. Res. 256, 65–82. [PubMed] [Google Scholar]
- 165.Oliphant LW. 1981. Crystalline pteridines in the stromal pigment cells of the iris of the great horned owl. Cell Tissue Res. 217, 387–395. ( 10.1007/bf00233588) [DOI] [PubMed] [Google Scholar]
- 166.Kumar S, Stecher G, Suleski M, Hedges SB. 2017. TimeTree: a resource for timelines, timetrees, and divergence times. Mol. Biol. Evol. 34, 1812–1819. ( 10.1093/molbev/msx116) [DOI] [PubMed] [Google Scholar]
- 167.Vinther J. 2015. A guide to the field of palaeo colour: melanin and other pigments can fossilise: reconstructing colour patterns from ancient organisms can give new insights to ecology and behaviour. Bioessays 37, 643–656. ( 10.1002/bies.201500018) [DOI] [PubMed] [Google Scholar]
- 168.Lindgren J, et al. 2018. Soft-tissue evidence for homeothermy and crypsis in a Jurassic ichthyosaur. Nature 564, 359–365. ( 10.1038/s41586-018-0775-x) [DOI] [PubMed] [Google Scholar]
- 169.Lindgren J, et al. 2014. Skin pigmentation provides evidence of convergent melanism in extinct marine reptiles. Nature 506, 484–488. ( 10.1038/nature12899) [DOI] [PubMed] [Google Scholar]
Associated Data
This section collects any data citations, data availability statements, or supplementary materials included in this article.
Data Citations
- Brejcha J, Bataller J-V, Bosáková Z, Geryk J, Havlíková M, Kleisner K, Maršík P, Font E. 2019. Data from: Body coloration and mechanisms of colour production in Archelosauria: the case of deirocheline turtles Dryad Digital Repository. ( 10.5061/dryad.b68b048) [DOI] [PMC free article] [PubMed]
Supplementary Materials
Data Availability Statement
Reflectance spectra data, reflectance spectra summary variables, R script of spectral analyses, reflecting platelets electromicrographs, reflecting platelets measurements and Fourier analyses output files: https://doi.org/10.5061/dryad.b68b048 [56].