

Short abstract
The previous studies showed that alternatively activated anti-inflammatory macrophage (M2) adoptive immunity can improve the proportion of local M2 cells and play the neuroprotective effect after spinal cord injury (SCI). Its molecular mechanism is not yet very clear. Therefore, this study aims to analyze the effect of the M2 adoptive transfer on the local expression of gene transcription. Sprague-Dawley (SD) rats were used for culture of macrophages and establishment of SCI models. After SCI, the polarized M2 macrophages were transferred to the injured rats by tail vein injection. Seven days after operation, the differentially expressed genes (DEGs) in the spinal cords were analyzed by RNA-sequencing (RNA-Seq). Then, the functional enrichment analysis and pathways were performed by using gene ontology (GO) and Kyoto Encyclopedia of Genes and Genomes (KEGG), respectively. RNA-Seq showed that M2 adoptive immunity can down-regulate many well-studied gene expressions associated with signaling pathways of inflammatory, such as antigen processing and presentation, phagosome, cell adhesion molecules, natural killer cell-mediated cytotoxicity, endocytosis, proteasome, and Toll-like receptor signaling pathway. These may explain the mechanism of our previous adoptive immunization of M2 cells to provide neuroprotection for SCI. In addition, a novel pathway, retinoic acid-inducible gene-1 (RIG-I)-like receptor signaling pathway was found to be involved in the pathological process of SCI and the response to M2 adoptive immunity as well. This will provide a new explanation for the pathological mechanism of SCI and a new theoretical and experimental basis for its clinical treatment. The raw Illumina data are available at http://www.ncbi.nlm.nih.gov/sra (accession number PRJNA517238).
Impact statement
This research aimed to analyze the effect of M2 macrophage adoptive transfer on the local expression of gene transcription after SCI by RNA-Seq. The results showed that M2 adoptive immunity can down-regulate many well-studied gene expressions associated with signaling pathways of inflammatory. These may explain the mechanism of our previous adoptive immunization of M2 cells to provide neuroprotection for SCI. In addition, a novel pathway, RIG-I-like receptor signaling pathway was also found to involve in the pathological process of SCI and the response to M2 adoptive immunity. This will provide a new explanation for the pathological mechanism of SCI and a new theoretical and experimental basis for its clinical treatment.
Keywords: Spinal cord injury, M2 macrophages, adoptive transfer, RNA-sequencing
Introduction
Spinal cord injury (SCI) refers to various injuries to the spinal cords. According to the severity of injury, it may cause a variety of symptoms, ranging from pain to complete loss of movement and sensory function. SCI affects millions of people worldwide and usually affects patients’ quality of life.1 However, there is still no effective treatment. Therefore, the significance of finding new treatment methods for patients with SCI is self-evident. It has been a great challenge for researchers in related fields to deeply explore its pathogenesis and find the effective treatment strategies.
Macrophages play a very important role in the innate immune response.2 In the light of different functions, they are divided into two different subtypes, namely pro-inflammatory (M1) and anti-inflammatory (M2) macrophages.3 After SCI, the ratio of M1 and M2 is related to aggravating secondary injury or promoting traumatic repair.4–6 M1 cells can produce nitric oxide and pro-inflammatory cytokines, which often induce cytotoxic processes.7 In contrast, M2 cells can produce anti-inflammatory cytokines, promote angiogenesis, clear debris, and participate in tissue remodeling and repair.8 It is reported that after acute SCI, decreasing the quantity of M1 or increasing M2 cells can promote tissue repair and exercise recovery.2,9–11 Our previous study confirmed that in the local microenvironment after SCI injury, the M1 macrophages and the neuroprotective M2 macrophages could be detected at the early stage, but the M1 macrophages were dominant one week after injury, and the proportion of M2 macrophages was very small.12 Adoption of adoptive immunity can improve the ratio of M2 macrophages in damaged spinal cords and play a neuroprotective role.13 However, the exact mechanism is not entirely clear. Therefore, this study intends to use the bone marrow-derived M2 macrophages adoptive immunity at seven days after SCI, to analyze their influence on the local gene transcription by using RNA-Seq. Then, through bioinformatics analysis and RT-qPCR, key molecular and signal pathways were screened and identified, providing new theoretical and experimental basis for SCI clinical treatment.
Methods
Animals
This study was conducted in accordance with the Guide for the Care and Use of Laboratory Animals and the Association for Assessment and Accreditation of Laboratory Animal Care international. The protocol was approved by the Institutional Committee on Animal Care, Use and Research (Approval no. 2017037) of the Bengbu Medical College. A total of 10 healthy and clean, six weeks old, Sprague–Dawley (SD) female rats (150–180 g) were used for culture of primary macrophages. A total of 20 healthy, clean adult SD female rats (220–250 g, 8 weeks old) were used to SCI model. All rats were purchased from Vital River Laboratory Animal Technology Co. Ltd. (Beijing, China).
Bone marrow-derived macrophages culture and polarization
The culture and polarization of bone marrow-derived macrophages were based on the earlier reports.13,14 The rats were anesthetized with 50 mg/kg pentobarbital by intraperitoneal injection. After disinfecting with 75% alcohol, the skin was cut from the root of the rat's thigh, then the muscle, until completely exposed and remove femoral, then soaked in 75% alcohol and phosphate-buffered saline (PBS, pH 7.4) twice, each time for 6 min. Using the surgical scissors the two ends of the femur were carefully cut, and 20 mL syringe was used to absorb the culture medium, the bone marrow was flushed from one end of the femur to the other end and put in medium in a 10-mL dish, and the medium was changed every 2–3 days. After seven days of culture, we defined it as M0 macrophages. After incubating with IL-4, -10, and TGF-β1 (all 10 ng/mL, R&D systems) for 24 h, the cells were defined as M2 macrophages. The cells were identified by immunocytochemistry and flow cytometry (FCM).
Immunocytochemistry
After washing three times with PBS (pH 7.4), the polarized macrophages were fixed for 15 min in 4% paraformaldehyde (PFA). After three times of washing with PBS at 10 min intervals, the cells were blocked with blocking buffer (PBS added 10% goat serum and 0.1% tritonx-100). After 2 h, the cells were incubated with the primary antibodies as shown in Table 1 at 4°C for 12 h. Then, the cells were washed three times with PBS, incubated with the fluorescein-conjugated secondary antibodies (Table 1) for 30 min at room temperature. After washing with PBS for three times, the cells were mounted with glycerol containing Hoechst33342 (0.5 μM, Sigma). The staining was examined under a ZEISS Axio Observer microscope.
Table 1.
The antibodies used in this study.
| Antigen | Host | Manufacturer | Catalog number | Application(dilution) | Fluorescence |
|---|---|---|---|---|---|
| Arginase I (Arg1) | Rabbit | Thermo Fisher Scientific Inc., Rockford, IL | PA5-22009 | IHC (1:200) | |
| C-C chemokine receptor type 7 (CCR7) | Rabbit | Abcam Cambridge Chemical Co., Cambridge, MA | ab32527 | IHC (1:250) | |
| CD68 | Mouse | AbD Serotech, Oxford, UK | MCA341GA | IHC (1:200) | |
| Mouse IgG | Goat | Jackson Immuno Research Lab., West Grove, PA | 115-095-003 | IHC (1:200) | Rhodamine |
| Rabbit IgG | Goat | Jackson Immuno Research Lab., West Grove, PA | 111-025-144 | IHC (1:200) | FITC |
| CD68 | Mouse | AbD Serotech, Oxford, UK | MCA341F | FCM (1 μg/106 cells) | FITC |
| CD86 | Mouse | Thermo Fisher Scientific Inc., Rockford, IL | 12-0860-82 | FCM (0.2 μg/106 cells) | PE |
| CD163 | Mouse | AbD Serotech, Oxford, UK | MCA342A647 | FCM (1 μg/106 cells) | APC |
| IgG1 | Mouse | Bio-Rad, Hercules, CA | MCA1209F | FCM (1 μg/106 cells) | FITC |
| IgG1 kappa | Mouse | Thermo Fisher Scientific Inc., Rockford, IL | 12-4714-82 | FCM (0.2 μg/106 cells) | PE |
| IgG1 | Mouse | Thermo Fisher Scientific Inc., Rockford, IL | MA5-18093 | FCM (1 μg/106 cells) | APC |
FCM
The cells were digested with trypsin, collected, and washed three times with PBS. Then, the cells were put in staining buffer containing CD68-FITC, CD86-PE, and CD163-APC (Table 1) at 4°C for 30 min. The cells were washed three times using staining buffer; the cells were centrifuged at 4°C, then 2% PFA was added to fix the cells. The non-specific staining was detected by isotype control antibodies (Table 1). The results were examined with flow cytometer (FACS Verse, Becton Dickinson, San Diego, CA), and analyzed with FlowJo 7.6.1 (TreeStar, Ashland, OR).
Contusive SCI
Contused T9 SCI was made by using a New York University impactor according to our previous method.13 The rats only received a laminectomy were classified as sham-operated (sham) group. After injury, the rats were placed in a room with constant temperature and humidity and were given rats’ fluid infusion (normal saline 6–9 mL) and antibiotics (gentamicin 2100–2600 U/rats) every morning for a week to prevent electrolyte disturbance and infection. Three times a day, the rats were given urination care until they were able to urinate autonomously.
Macrophage labeling and adoptive transfer
After the operation, the polarized M2 macrophages were prepared to transfer to the injured rats. To track the transferred M2 cells in the injured spinal cords, we labeled some cells with carboxyfluorescein diacetate-succinimidyl ester (CFSE), a fluorescent staining dye (Invitrogen, Carlsbad, CA) according to the previous method.15 For adoptive transfer, the cell concentration was adjusted to 1 × 10⁷ cells/mL by PBS. Each rat was given 1 × 10⁷ M2 macrophages by tail vein injection within 1 h after SCI. The blank control group was replaced with PBS. All the experimental groups for RNA-Seq are as follows: sham group with only infusion of PBS (sham [PBS]), M2 transferred sham group (sham [M2]), SCI group with only infusion of PBS (SCI [PBS]), and M2 macrophage transferred SCI group (SCI [M2]).
Detection of transferred cells in injured spinal cords
Three days after the operation, the CFSE-labeled cell transferred rats were anesthetized, perfused, and fixed according to our previous method.13 The 1-cm long spinal cords containing the injury center were removed, and the 6-μm thick longitudinal frozen sections were obtained. The CFSE-labeled cells were observed under a ZEISS Axio observer microscope.
RNA isolation, quantification, and qualification
After perfusion with 200 mL PBS, spinal cords (1 cm including the injury center) were removed on seventh day after operation. In order to extract total RNA from the spinal cords, TRIzol reagent (Invitrogen, New Jersey, NJ) was used. DNase I was used to remove genomic DNA. RNA purity, concentration, and integrity were evaluated according to the previous method.16
Library preparation and transcriptome sequencing
For RNA preparation, we used 3 μg RNA as input material for every sample according to the previous method.16 Finally, the 125 bp/150 bp paired-end reads were obtained and sequenced by using an Illumina Hiseq platform. The raw Illumina data are available at http://www.ncbi.nlm.nih.gov/sra (accession number PRJNA517238).
Data analysis
Gene expression statistics and cluster analysis
The number of reads per gene was calculated using RSEM software (http://deweylab.biostat.wisc.edu/rsem/). In RNA-Seq, methods for gene expression levels are typically estimated by using fragments per kilogram base (FPKM) of transcript sequences per million base pairs. So, we converted the read count to FPKM. After obtaining the FPKM value of each sample, cluster analysis was performed to obtain a gene set with similar expression patterns. The data similarity and difference were studied by using principal component analysis (PCA). The samples were clustered based on Pearson correlation system.
Analysis of DEGs
DESeq software (http://www.bioconductor.org/) was used to analyze the DEGs in three groups. In order to control the false discovery rate and adjust the P value, Benjamin and Hodgeberg's method was used. The adjusted P value <0.05 was defined as the criterion for the difference in significance.
GO and KEGG enrichment analysis of DEGs
In DEGs GO and Kyoto Encyclopedia of Genes and Genomes (KEGG) analyses were performed by using the GOseq R package and KOBAS software, respectively. The significantly enriched pathways in DEGs compared to the genome-wide background were identified by hypergeometric test.
RT-qPCR
In order to verify the reliability of RNA-Seq data, eight DEGs were randomly selected and verified by RT-qPCR. A reverse transcription system from Promega (Madison, WI) was used to convert cDNA. The qPCR was performed on the ABI 7900 PCR detection system using SYBR™ Green PCR Master Mix (Applied Biosystems, Foster City, CA). PCR primers are shown in Table 2. According to the results of fluorescence quantitative PCR, the relative quantitative results of each group of genes were calculated according to the formula of ΔΔCt.17
Table 2.
Real-time PCR primers used in the study.
| Gene | GenBank accession no. | Forward primer 5ʹ–3ʹ | Reverse primer 5ʹ–3ʹ |
|---|---|---|---|
| Msr1 | NM_001191939.1 | CACAGACCGCTTCCAGAACT | GCTTTGCTGTAGATTCGCGG |
| Rrp1b | XM_017601874.1 | GCAGACCGTGAATCGAGAGT | GTGGGATCTCACTCCGTTGG |
| Vwa5a | NM_198755.1 | TCAAAAACATCGCCCGGGTA | CTCTCCGCTTGAGGCATAGG |
| Rrp7a | NM_001130568.1 | GAAGATTCCGTGCTGGACCC | AAGCTGAGCAGCTCCTTTCG |
| Rrp1 | NM_001012073.1 | GATGGTCCTGAGTGAGTCGC | GGCTGTCAGGGCTCAGTATC |
| Rrp8 | NM_001008346.1 | GGCCCGATTTCGCTACCTTA | GTCTCTGAAAGCCACGGTGA |
| Rrp9 | NM_001108778.1 | CCAGCTCTCCATTACGTGCT | AATGAGCTTGCTCCGGTCTC |
| Nop2 | NM_001191785.1 | GTTCCCGCTGTCTGAGTTGA | GTCCAGCTAGGTACTCGGGA |
Results
M2 macrophage identification
FCM and immunohistochemical staining showed that almost all cells expressed CD68, the marker of macrophages (Figure 1(a,b)). Only less than 20% of cells expressed CD86, and more than 80% of cells expressed CD163 (Figure 1(a)). Almost no cells expressed CCR7, while almost all cells expressed Arg1 (Figure 1(b)).
Figure 1.

The identification of M2 macrophages. (a) Representative FCM pictures of the expressions of CD163, CD86, and CD68; (b) representative IHC images of the expressions of CCR7 (red), Arg1 (red), and CD68 (green) in cultured M2 cells. Scale bars: 25 μm. (A color version of this figure is available in the online journal.)
Detection of transferred M2 cells in the injured spinal cords
To track whether the transferred M2 cells infiltrated into injured spinal cords, we labeled some cells with CFSE. The infiltration of CFSE-labeled M2 macrophages was detected under a fluorescence microscope. As shown in Figure 2, CFSE-labeled M2 macrophages could be found in injury center and surrounding tissues. And almost all these cells were CD68 positive.
Figure 2.

Detection of transferred M2 cells. The infiltration of CFSE-labeled M2 cells into injured spinal cords was detected by fluorescence microscopy three days after transfer. Scale bars: 500 μm (left) and 20 μm (right). (A color version of this figure is available in the online journal.)
Identification of expressed transcripts
For the quality assessment of sequencing data, 12 cDNA libraries were established, including A (sham [PBS]: A1, A2 and A3), B (sham [M2]: B1, B2 and B3), C (SCI [PBS]: C1, C2 and C3), and D (SCI [M2]: D1, D2 and D3). As shown in Table 3, RNA-Seq produced 45,943,812 to 59,219,924 raw reads for each library. The clean reads were from 43,842,872 to 58,216,752 (97.14–97.49%) after filtering out the low-quality reads. This demonstrated that the data could be used for the next analysis. In order to elaborate the source of variation in our original data, we conducted PCA. As shown in Figure 3, PC1, PC2, and PC3 were 51.72%, 9.29%, and 7.10%, respectively. In order to ensure the reliability of the follow-up analysis results, through PCA analysis, we determined to remove a set of data in each group which is far from the overall deviation.
Table 3.
Summary of sequence assembly.
| Sample name | Raw reads | Clean reads | Clean bases | Error rate (%) | Q20 (%) | Q30 (%) | GC content (%) |
|---|---|---|---|---|---|---|---|
| A1 | 53,383,658 | 52,419,698 | 7.86G | 0.01 | 97.4 | 93.27 | 50.14 |
| A2 | 50,923,964 | 50,030,710 | 7.5G | 0.01 | 97.38 | 93.23 | 50.58 |
| A3 | 56,134,690 | 55,287,494 | 8.29G | 0.01 | 97.49 | 93.48 | 50.13 |
| B1 | 50,343,142 | 47,585,268 | 7.14G | 0.02 | 97.3 | 92.97 | 50.49 |
| B2 | 53,408,260 | 52,325,820 | 7.85G | 0.01 | 97.4 | 93.29 | 50.36 |
| B3 | 56,982,908 | 56,069,948 | 8.41G | 0.01 | 97.48 | 93.46 | 49.65 |
| C1 | 54,054,354 | 53,200,158 | 7.98G | 0.01 | 97.48 | 93.48 | 49.51 |
| C2 | 59,219,924 | 58,216,752 | 8.73G | 0.01 | 97.46 | 93.45 | 49.77 |
| C3 | 51,550,942 | 50,598,802 | 7.59G | 0.01 | 97.43 | 93.34 | 50.03 |
| D1 | 54,171,418 | 51,240,838 | 7.69G | 0.02 | 97.14 | 92.68 | 50.7 |
| D2 | 45,943,812 | 43,842,872 | 6.58G | 0.01 | 97.47 | 93.38 | 50.56 |
| D3 | 55,208,884 | 52,509,814 | 7.88G | 0.01 | 97.46 | 93.39 | 50.54 |
A1, A2, A3: sham (PBS); B1, B2, B3: sham (M2); C1, C2, C3: SCI (PBS); D1, D2, D3: SCI (M2).
Q20: The percentage of bases with a Phred value >20; Q30: the percentage of bases with a Phred value >30.
Figure 3.

PCA analysis. The source of variance in our expressed transcripts was performed by PCA analysis which includes three principal components (PC1, 2 and 3; n = 3). (A color version of this figure is available in the online journal.)
The effect of M2 macrophage adoptive immunity on gene expression
The gene expression level and differential expression profiles were analyzed by RPKM and DEGSeq, respectively. Comparing with the sham (PBS) group, there were only 64 DEGs in sham (M2) group, including 30 up-regulated and 34 down-regulated (Figure 4(a)), there were 5812 DEGs in SCI (PBS) group, 3196 of which were up-regulated and 2616 down-regulated (Figure 4(b)). Comparing with SCI (PBS) group, there were 311 DEGs in SCI (M2) group, 88 of which were up-regulated and 223 down-regulated (Figure 4(c)).
Figure 4.

Volcano map of DEGs. The red and green dots represent significantly up-regulated and down-regulated genes, respectively. (a) Sham (M2) vs. sham (PBS), (b) SCI (PBS) vs. sham (PBS), (c) SCI (M2) vs. SCI (PBS). (A color version of this figure is available in the online journal.)
Identification of DEGs by RT-qPCR
To verify the RNA-Seq results, eight DEGs were randomly selected from SCI (M2) compared with SCI (PBS) group, namely Msr1, Rrp1b, Vwa5a, Rrp7a, Rrp1, Rrp8, Rrp9, and Nop2. As shown in Figure 5, the mRNA expression patterns in RNA-Seq and RT-qPCR were similar.
Figure 5.

RT-qPCR verifications of DEGs. Longitudinal coordinates are the relative representation levels of various genes (horizontal ordinate) in two samples. All data were calculated with mean ± standard deviation (n = 3). (A color version of this figure is available in the online journal.)
Cluster analysis of DEGs
The DEGs in different groups were analyzed by FPKM hierarchical cluster analysis. As shown in Figure 6, 6459 DEGs were classified into expression cluster groups. In the whole SCI process, these clusters contained genes up-regulated or down-regulated. Comparing to the sham (PBS) group (A) in lower clusters, the majority of the genes in SCI (PBS) group (C) were up-regulated while down-regulated in upper clusters. Some genes were up-regulated in SCI (M2) group (D) comparing with SCI (PBS) group (C) in upper clusters, while down-regulated genes were found in lower clusters.
Figure 6.

Hierarchical cluster analysis of DEGs. The 6459 DEGs were classified into different cluster groups basing on gene expression similarity. The red to blue gradation represented the up to down of gene expressions. A: Sham (PBS); B: sham (M2); C: SCI (PBS); D: SCI (M2). (A color version of this figure is available in the online journal.)
K-means clustering of DEGs
We performed K-mean clustering to further study the biological characteristics of 6459 DEGs. In the analysis, DEGs were divided into four subgroups according to the expression patterns of DEGs in spinal cords (Figure 7). There were 92 in subcluster_1, the gene expression levels showed the highest expression in sham (PBS) group (A) and sham (M2) group (B), the lowest expression in SCI (PBS) group (C). Subcluster_2 had 2136 genes, the gene expression levels showed a trend with highest expression in groups A and B, the lowest expression in group C. Although, in subclusters 1 and 2, most of the genes in SCI (M2) group (D) expressed lower than those in groups A and B, there were still some genes higher than those in group C. Subclusters 3 and 4 had 1538 and 605 genes, respectively. There were similar trends in gene expression in subcluster_4, with highest expression in C and lowest expression in groups A and B. Although, most of the genes in group D expressed higher than those in groups A and B, there were still some genes expressed lower than those in group C.
Figure 7.
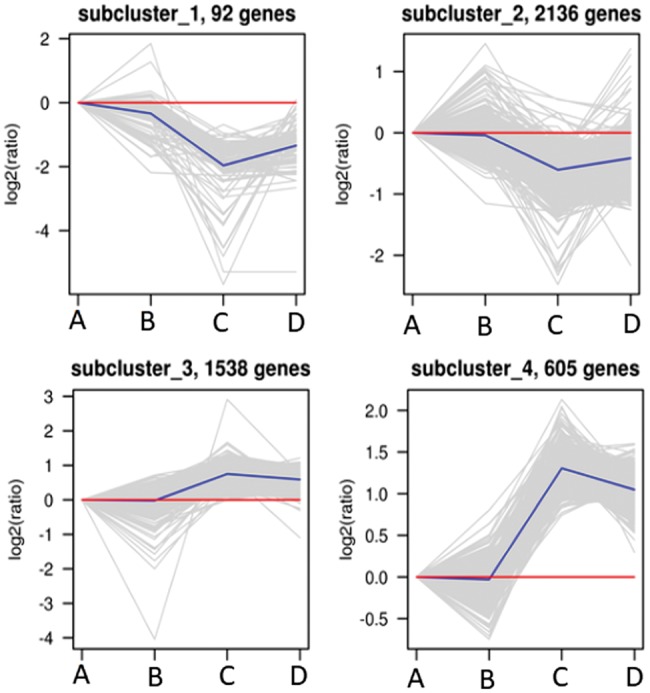
K-means clustering of DEGs. The biological characteristics of 6459 DEGs were studied by K-mean clustering. In the analysis, DEGs were divided into four subgroups according to their expression patterns. Their expression trends were analyzed. A: sham (PBS); B: sham (M2); C: SCI (PBS); D: SCI (M2). (A color version of this figure is available in the online journal.)
GO enrichment analysis of DEGs
Comparing with sham (PBS) group, no significant terms were found in sham (M2) group (data not show). Comparing with sham (PBS), there were 2171 in up-regulated (Figure 8(a)) and 610 GO terms in down-regulated genes (Figure 8(b)) in SCI (PBS) group. Comparing with SCI (PBS), there were nine in up-regulated (Figure 9(a)) and 182 GO terms in down-regulated genes (Figure 9(b)) in SCI (M2) group. Comparing with sham (M2), there were 1844 in up-regulated (Figure 10(a)) and 689 GO terms in down-regulated genes in SCI (M2) group (Figure 10(b)). In SCI (PBS) versus sham (PBS), the down-regulated DEGs were most enriched in neuron part synapse, neuron projection, axon, nervous system development, synaptic transmission, myelin sheath, presynapse, postsynapse, neurogenesis, dendrite, cell–cell signaling, neuron differentiation, generation of neurons, synaptic membrane, neuronal cell body, ion transport, etc.; the up-regulated DEGs were most enriched in immune system process, regulation of immune system process, immune response, defense response, response to stress, leukocyte activation, cytokine production, response to cytokine, immune effector process, positive regulation of response to stimulus, lymphocyte activation, innate immune response, cellular response to cytokine stimulus, inflammatory response, etc. In SCI (M2) versus SCI (PBS), the down-regulated DEGs were most enriched in immune response, immune system process, defense response, response to cytokines, immune effector process, antigen processing and presentation, etc. The up-regulated DEGs were enriched in ribosome biogenesis, rRNA processing, non-coding RNA (ncRNA) metabolic process, rRNA metabolic process, ribonucleoprotein complex biogenesis, ncRNA processing, preribosome, nucleolus and RNA processing.
Figure 8.

GO analysis of DEGs in SCI (PBS) vs. sham (PBS). The 30 most enriched GO terms were shown. The significantly enriched categories were indicated by asterisks (*P ≤ 0.05). (A color version of this figure is available in the online journal.)
Figure 9.

GO analysis of DEGs in SCI (M2) vs. SCI (PBS). The 30 most enriched GO terms were shown. The significantly enriched categories were indicated by asterisks (*P ≤ 0.05). (A color version of this figure is available in the online journal.)
Figure 10.

GO analysis of DEGs in SCI (M2) vs. sham (M2). The 30 most enriched GO terms were shown. The significantly enriched categories were indicated by asterisks (*P ≤ 0.05). (A color version of this figure is available in the online journal.)
KEGG enrichment analysis of DEGs
We used scatter plot to express KEGG enrichment analysis of DEGs. There were no enriched signaling pathways between sham (PBS) and sham (M2) groups (data not show). In SCI (PBS) versus sham (PBS), the up-regulated DEGs were most enriched in ribosome, phagosome, natural killer cell-mediated cytotoxicity, extracellular matrix–receptor interaction, nuclear factor-kappa B, Toll-like receptor, tumor necrosis factor, nucleotide-binding oligomerization domain-like receptor, chemokine, p53 signaling pathway, etc. (Figure 11(a)); the down-regulated DEGs were most enriched in gamma-aminobutyric acidergic synapse, glutamatergic synapse, dopaminergic synapse, retrograde endocannabinoid signaling, gap junction, cholinergic synapse, cyclic adenosine 3ʹ,5ʹ-monophosphate signaling pathway, axon guidance, etc. (Figure 11(b)). In SCI (M2) versus SCI (PBS), no enriched signaling pathways were found in the up-regulated DEGs (Figure 12(a)); the down-regulated DEGs were most enriched in cell adhesion molecules (CAMs), antigen processing and presentation, phagosome, natural killer cell-mediated cytotoxicity, endocytosis, proteasome, retinoic acid-inducible gene-1 (RIG-I)-like receptor, and Toll-like receptor signaling pathways (Figure 12(b)).
Figure 11.

KEGG analysis of DEGs in SCI (PBS) vs. sham (PBS). The scatter plots were used to express the 20 most enriched KEGG pathways. “Rich factor” is the ratio of DEGs and genes in numbers which has been annotated in a certain pathway. The greater the value the higher the enrichment degree. (A color version of this figure is available in the online journal.)
Figure 12.

KEGG analysis of DEGs in SCI (M2) vs. SCI (PBS). The scatter plots were used to express the 20 most enriched KEGG pathways. The greater the value of “Rich factor” the higher the enrichment degree of the pathway. (A color version of this figure is available in the online journal.)
Discussion
Our previous studies showed that M2 macrophage adoptive immunity can improve the proportion of local M2 macrophages and play the neuroprotective effect.12 Therefore, in this study, we would like to use M2 cell adoptive immunity as an intervention and RNA-Seq as a detection method to explore the relevant molecules or signaling pathways for neuroprotection after SCI.
As a result, our cultured macrophages expressed CD68, Arg1, and CD163 (the markers of M2),18 hardly expressed CD86 and CCR7 (the markers of M1).19 These indicate that the cultured M2 cells are successful and can be used for adoptive immunization. To track whether the transferred M2 cells infiltrated into the injured spinal cord, we labeled some cells with CFSE, a fluorescent staining dye for labeling of living cells,15 and the result showed that CFSE+ cells could be found at the injury center and surrounding tissue. This indicates that adoptive immunization of M2 cells is successful. Next, the effects of adoptive immunization with M2 cells on the transcription level of local genes in injured spinal cords were characterized by RNA-Seq. Before analyzing the data, we examined the cDNA library quality and found the clean tags were more than 97%. The PCA analysis also showed that the variation was low. In order to ensure the reliability of the follow-up analysis, we determined to remove a set of data in each group which is far from the overall deviation.
The results of RNA-Seq showed that comparing with the sham (PBS) group, there were only 64 DEGs in sham (M2) group, including 30 up-regulated and 34 down-regulated, and there were 5812 different genes in SCI (PBS) group, including 3196 up-regulated and 2616 down-regulated. These are consistent with others and our previous reports.20–22 It also shows that the results of this experiment are reliable. Comparing with SCI group, there were 311 DEGs in SCI (M2) group. This is the focus of our research. In these genes, 223 were down-regulated and 88 were up-regulated. We selected eight DEGs (Rrp1, Rrp1b, Nop2, Msr1, Rrp8, Rrp9, Rrp7a and Vwa5a) to verify the RNA-Seq results. The RT-qPCR results demonstrated that our RNA-Seq analysis is reliable.
In order to further analyze these DEGs, we used GO enrichment which can directly reflect the distribution of DEGs in cell components, molecular functions, and biological processes.23 The analysis showed that the down-regulated DEGs in SCI (M2) versus SCI (PBS) were most enriched in immune response, immune system process, defense response, antigen processing and presentation, immune effector process, etc. Interestingly, these GO terms were also found in up-regulated DEGs in SCI (PBS) versus sham (PBS), which is also consistent with a number of well-known reports which have demonstrated a large number of immune and inflammatory responses to SCI.24–27 These suggest that M2 cell adoptive immunity inhibits the local immune response and the response to inflammatory factors in the injured spinal cords.
In SCI (M2) versus SCI (PBS), the 88 up-regulated DEGs were totally enriched in nine GO terms, which included rRNA processing, ribosome biogenesis, ribonucleoprotein complex biogenesis, ncRNA metabolic process, rRNA metabolic process, ncRNA processing, preribosome, nucleolus, and RNA processing. Ribosomes are ribonucleoprotein particles in cells, mainly composed of rRNA and proteins. The function of ribosomes is to synthesize amino acids into protein polypeptide chains according to the instructions of mRNA.28 Here, we can find ribonucleoprotein complex biogenesis, ribosome biogenesis, preribosome, rRNA processing, nucleolus RNA processing, and rRNA metabolic process are all related to ribosome. This is consistent with our previous report.16
Ribosome biosynthesis is very important for neural development, and nucleolus is a principal site of this biological process.29 Besides regulating ribosome biosynthesis, nucleolus also has the function of inhibiting cell apoptosis by inhibiting p53, a pro-apoptotic transcription factor.29,30 Therefore, M2 cell transfer may also inhibit p53-dependent neuronal death and promote neural development in injured spinal cords by regulating nucleolus and ribosome biogenesis.
RNA processing is the process of processing various precursor RNA molecules into mature and active RNA. It has been reported that RNA processing is an important biological process and may participate in synaptic plasticity in the spinal cord.31 Therefore, we speculate that M2 adoptive immunity may affect the local synaptic plasticity of injured spinal cord by regulating the maturation and activation of various precursor RNA.
ncRNA is an emerging transcript with a genomic coding domain but most of which are not translated into proteins. The ncRNAs, including miRNAs, piRNAs and lncRNAs, play important roles in the physiological functions of various cells, such as chromatin dynamics, gene expression, cell growth, and differentiation.32,33 More and more evidence shows that ncRNAs, especially miRNAs and lncRNAs, are involved in the pathophysiology of central nervous system injury.32–34 Therefore, restoration or inhibition of ncRNA activity represents a treatment strategy for SCI. Though still in animal experiment stage, an increasing number of studies have confirmed this hypothesis.34–40 In this study, the transferred M2 cells could promote ncRNA metabolic process and ncRNA processing. This may be a reasonable explanation for the adoptive immunization of M2 cells to promote SCI repair.
Next, we used KEGG to analyze signaling pathways associated with adoptive immunization of M2 cells. KEGG is a method for analysis of genomic information database by measuring Rich factor Q and the gene numbers enriched into this pathway.41 Our analysis found that in the down-regulated DEGs in SCI (M2) versus SCI (PBS), the most enriched pathways included CAMs, natural killer cell-mediated cytotoxicity, antigen processing and presentation, endocytosis, proteasome, phagosome, RIG-I-like receptor, and Toll-like receptor signaling pathways. No enriched signaling pathways were found in the up-regulated DEGs. Similar to GO analysis, most of these down-regulated signaling pathways are associated with immune and inflammatory responses. Interestingly, these signaling pathways were also found in up-regulated DEGs in SCI (PBS) versus sham (PBS). These analyses once again suggest that M2 adoptive immunity provides neuroprotective effects on injured spinal cord by inhibiting immune and inflammatory responses. These just support the previous reports,8,13 the M2 cells aggregated at the site of injury can secret anti-inflammatory cytokines (such as IL-4, IL-10, IL-13 and TGF-β) which may mediate changes in the expression of the above-mentioned genes and signal pathways.
By combining those signal pathways inhibited by M2 cells, we found that some pathways have been reported to be involved in SCI. For example, CAMs,42,43 antigen processing and presentation,28,44 phagosome,45 natural killer cell-mediated cytotoxicity,46,47 endocytosis,48,49 proteasome,50,51 and Toll-like receptor signaling pathway.52,53 These are related to the pathological mechanism of SCI. M2 adoptive immunity just inhibits these signaling pathways, suggesting that targeting M2 cells is a feasible strategy for treating SCI.
In addition to these well-studied pathways, we also found RIG-I-like receptor signaling pathway involved in the pathological process of SCI and the response to M2 adoptive immunity. RIG-I is the abbreviation of “retinoic acid inducible gene-I”, and RIG-I like receptors (RLR) are a family of cytoplasmic pathogen recognition receptors that detect pathogen-associated molecular patterns. Activation of RIG-I-like receptor signaling pathway results in the production of type I interferons and proinflammatory cytokines.54 Although these products can initiate innate immunity against invading pathogens, they can also cause the tissue damage of the host itself. In our study, RIG-I-like receptor signaling pathway was enriched in up-regulated DEGs of SCI and down-regulated DEGs after M2 cell adoptive immunity. This suggests that SCI may induce tissue injury by activating RIG-I-like receptor signaling pathway to produce inflammatory factors, and increasing M2 cell proportion in the injured area may inhibit this signaling pathway and providing neuroprotection.
Conclusions
Adoptive immunization of M2 macrophages can lead to gene expression changes of injured spinal cords. These changed genes and their associated signaling pathways may explain the mechanism of our previous adoptive immunization of M2 cells to provide neuroprotection for SCI. M2 cell adoptive immunity not only inhibit the local immune response and the response to inflammatory factors, but also inhibit neuronal death, promote neural development, affect the local synaptic plasticity of injured spinal cord by regulating the maturation and activation of various precursor RNA, and promoting ncRNA metabolic process and ncRNA processing. In addition to well-studied signaling pathways associated with inflammatory, a novel pathway, RIG-I-like receptor signaling pathway is predicted to be related to the pathological process of SCI and the response to M2 adoptive immunity. This will provide a new theoretical and experimental basis for the pathological mechanism and clinical treatment of SCI.
Acknowledgments
The datasets used and/or analyzed during the current study are available from the corresponding author on reasonable request.
Authors’ contributions
HZL and JGH participated in the design of the study. SNW, XYG, and SQD performed experimental procedures. JC, YW, FXD, and JHZ conducted data analysis. All authors read and approved the final manuscript.
DECLARATION OF CONFLICTING INTERESTS
The author(s) declared no potential conflicts of interest with respect to the research, authorship, and/or publication of this article.
FUNDING
This study was supported by grants from the National Natural Science Foundation of China (Nos. 81571194, 81772321).
References
- 1.Friedli L, Rosenzweig ES, Barraud Q, Schubert M, Dominici N, Awai L, Nielson JL, Musienko P, Nout-Lomas Y, Zhong H, Zdunowski S, Roy RR, Strand SC, van den Brand R, Havton LA, Beattie MS, Bresnahan JC, Bezard E, Bloch J, Edgerton VR, Ferguson AR, Curt A, Tuszynski MH, Courtine G. Pronounced species divergence in corticospinal tract reorganization and functional recovery after lateralized spinal cord injury favors primates. Sci Transl Med 2015; 7:302ra134. [DOI] [PMC free article] [PubMed] [Google Scholar]
- 2.David S, Kroner A. Repertoire of microglial and macrophage responses after spinal cord injury. Nat Rev Neurosci 2011; 12:388–99 [DOI] [PubMed] [Google Scholar]
- 3.Shechter R, Miller O, Yovel G, Rosenzweig N, London A, Ruckh J, Kim KW, Klein E, Kalchenko V, Bendel P, Lira SA, Jung S, Schwartz M. Recruitment of beneficial M2 macrophages to injured spinal cord is orchestrated by remote brain choroid plexus. Immunity 2013; 38:555–69 [DOI] [PMC free article] [PubMed] [Google Scholar]
- 4.Cheng H, Cao Y, Olson L. Spinal cord repair in adult paraplegic rats: partial restoration of hind limb function. Science 1996; 273:510–3 [DOI] [PubMed] [Google Scholar]
- 5.Kuo HS, Tsai MJ, Huang MC, Huang WC, Lee MJ, Kuo WC, You LH, Szeto KC, Tsai IL, Chang WC, Chiu CW, Ma H, Chak KF, Cheng H. The combination of peripheral nerve grafts and acidic fibroblast growth factor enhances arginase I and polyamine spermine expression in transected rat spinal cords. Biochem Biophys Res Commun 2007; 357:1–7 [DOI] [PubMed] [Google Scholar]
- 6.Kuo HS, Tsai MJ, Huang MC, Chiu CW, Tsai CY, Lee MJ, Huang WC, Lin YL, Kuo WC, Cheng H. Acid fibroblast growth factor and peripheral nerve grafts regulate Th2 cytokine expression, macrophage activation, polyamine synthesis, and neurotrophin expression in transected rat spinal cords. J Neurosci 2011; 31:4137–47 [DOI] [PMC free article] [PubMed] [Google Scholar]
- 7.Busch SA, Horn KP, Silver DJ, Silver J. Overcoming macrophage-mediated axonal dieback following CNS injury. J Neurosci 2009; 29:9967–76 [DOI] [PMC free article] [PubMed] [Google Scholar]
- 8.Kigerl KA, Gensel JC, Ankeny DP, Alexander JK, Donnelly DJ, Popovich PG. Identification of two distinct macrophage subsets with divergent effects causing either neurotoxicity or regeneration in the injured mouse spinal cord. J Neurosci 2009; 29:13435–44 [DOI] [PMC free article] [PubMed] [Google Scholar]
- 9.Gordon S. Alternative activation of macrophages. Nat Rev Immunol 2003; 3:23–35 [DOI] [PubMed] [Google Scholar]
- 10.McWhorter FY, Wang T, Nguyen P, Chung T, Liu WF. Modulation of macrophage phenotype by cell shape. Proc Natl Acad Sci U S A 2013; 110:17253–8 [DOI] [PMC free article] [PubMed] [Google Scholar]
- 11.Cassetta L, Cassol E, Poli G. Macrophage polarization in health and disease. Sci World J 2011; 11:2391–402 [DOI] [PMC free article] [PubMed] [Google Scholar]
- 12.Chen YJ, Zhu H, Zhang N, Shen L, Wang R, Zhou JS, Hu JG, Lu HZ. Temporal kinetics of macrophage polarization in the injured rat spinal cord. J Neurosci Res 2015; 93:1526–33 [DOI] [PubMed] [Google Scholar]
- 13.Ma SF, Chen YJ, Zhang JX, Shen L, Wang R, Zhou JS, Hu JG, Lü HZ. Adoptive transfer of M2 macrophages promotes locomotor recovery in adult rats after spinal cord injury. Brain Behav Immun 2015; 45:157–70 [DOI] [PubMed] [Google Scholar]
- 14.Davies JQ, Gordon S. Isolation and culture of murine macrophages. Methods Mol Biol 2005; 290:91–103 [DOI] [PubMed] [Google Scholar]
- 15.Nakagawa Y, Watari E, Shimizu M, Takahashi H. One-step simple assay to determine antigen-specific cytotoxic activities by single-color flow cytometry. Biomed Res 2011; 32:159–66 [DOI] [PubMed] [Google Scholar]
- 16.Shi LL, Zhang N, Xie XM, Chen YJ, Wang R, Shen L, Zhou JS, Hu JG, Lu HZ. Transcriptome profile of rat genes in injured spinal cord at different stages by RNA-sequencing. BMC Genomics 2017; 18:173. [DOI] [PMC free article] [PubMed] [Google Scholar]
- 17.Livak KJ, Schmittgen TD. Analysis of relative gene expression data using real-time quantitative PCR and the 2(-delta delta C(T)) method. Methods 2001; 25:402–8 [DOI] [PubMed] [Google Scholar]
- 18.Fujimura T, Kambayashi Y, Furudate S, Kakizaki A, Aiba S. Immunomodulatory effect of bisphosphonate risedronate sodium on CD163+ arginase 1+ M2 macrophages: the development of a possible supportive therapy for angiosarcoma. Clin Dev Immunol 2013; 2013:325412. [DOI] [PMC free article] [PubMed] [Google Scholar]
- 19.Ishizuka EK, Ferreira MJ, Grund LZ, Coutinho EM, Komegae EN, Cassado AA, Bortoluci KR, Lopes-Ferreira M, Lima C. Role of interplay between IL-4 and IFN-gamma in the in regulating M1 macrophage polarization induced by Nattectin. Int Immunopharmacol 2012; 14:513–22 [DOI] [PubMed] [Google Scholar]
- 20.Gris P, Murphy S, Jacob JE, Atkinson I, Brown A. Differential gene expression profiles in embryonic, adult-injured and adult-uninjured rat spinal cords. Mol Cell Neurosci 2003; 24:555–67 [DOI] [PubMed] [Google Scholar]
- 21.Kotipatruni RR, Dasari VR, Veeravalli KK, Dinh DH, Fassett D, Rao JS. p53- and Bax-mediated apoptosis in injured rat spinal cord. Neurochem Res 2011; 36:2063–74 [DOI] [PubMed] [Google Scholar]
- 22.Ruhlen RL, Singh VK, Pazdernik VK, Towns LC, Snider EJ, Sargentini NJ, Degenhardt BF. Changes in rat spinal cord gene expression after inflammatory hyperalgesia of the joint and manual therapy. JAOA 2014; 114:768–76 [DOI] [PubMed] [Google Scholar]
- 23.Huang Q, Wu LY, Wang Y, Zhang XS. GOMA: functional enrichment analysis tool based on GO modules. Chin J Cancer 2013; 32:195–204 [DOI] [PMC free article] [PubMed] [Google Scholar]
- 24.Bloom O. Non-mammalian model systems for studying neuro-immune interactions after spinal cord injury. Exp Neurol 2014; 258:130–40 [DOI] [PMC free article] [PubMed] [Google Scholar]
- 25.David S, Greenhalgh AD, Kroner A. Macrophage and microglial plasticity in the injured spinal cord. Neuroscience 2015; 307:311–8 [DOI] [PubMed] [Google Scholar]
- 26.Schwab JM, Zhang Y, Kopp MA, Brommer B, Popovich PG. The paradox of chronic neuroinflammation, systemic immune suppression, autoimmunity after traumatic chronic spinal cord injury. Exp Neurol 2014; 258:121–9 [DOI] [PMC free article] [PubMed] [Google Scholar]
- 27.Held KS, Lane TE. Spinal cord injury, immunodepression, and antigenic challenge. Semin Immunol 2014; 26:415–20 [DOI] [PMC free article] [PubMed] [Google Scholar]
- 28.Kilanczyk E, Andres KR, Hallgren J, Ohri SS, Laiho M, Whittemore SR, Hetman M. Pharmacological inhibition of spinal cord injury-stimulated ribosomal biogenesis does not affect locomotor outcome. Neurosci Lett 2017; 642:153–7 [DOI] [PMC free article] [PubMed] [Google Scholar]
- 29.Slomnicki LP, Pietrzak M, Vashishta A, Jones J, Lynch N, Elliot S, Poulos E, Malicote D, Morris BE, Hallgren J, Hetman M. Requirement of neuronal ribosome synthesis for growth and maintenance of the dendritic tree. J Biol Chem 2016; 291:5721–39 [DOI] [PMC free article] [PubMed] [Google Scholar]
- 30.Hetman M, Slomnicki LP. Ribosomal biogenesis as an emerging target of neurodevelopmental pathologies. J Neurochem 2019; 148:325–47 [DOI] [PMC free article] [PubMed] [Google Scholar]
- 31.Coyle DE. Spinal cord transcriptional profile analysis reveals protein trafficking and RNA processing as prominent processes regulated by tactile allodynia. Neuroscience 2007; 144:144–56 [DOI] [PubMed] [Google Scholar]
- 32.Zhou S, Ding F, Gu X. Non-coding RNAs as emerging regulators of neural injury responses and regeneration. Neurosci Bull 2016; 32:253–64 [DOI] [PMC free article] [PubMed] [Google Scholar]
- 33.Chandran R, Mehta SL, Vemuganti R. Non-coding RNAs and neuroprotection after acute CNS injuries. Neurochem Int 2017; 111:12–22 [DOI] [PMC free article] [PubMed] [Google Scholar]
- 34.Bhalala OG, Srikanth M, Kessler JA. The emerging roles of microRNAs in CNS injuries. Nat Rev Neurol 2013; 9:328–39 [DOI] [PMC free article] [PubMed] [Google Scholar]
- 35.Fu X, Shen Y, Wang W, Li X. MiR-30a-5p ameliorates spinal cord injury-induced inflammatory responses and oxidative stress by targeting Neurod 1 through MAPK/ERK signalling. Clin Exp Pharmacol Physiol 2018; 45:68–74 [DOI] [PubMed] [Google Scholar]
- 36.Ruan W, Ning G, Feng S, Gao S, Hao Y. MicroRNA381/Hes1 is a potential therapeutic target for spinal cord injury. Int J Mol Med 2018; 42:1008–17 [DOI] [PubMed] [Google Scholar]
- 37.Zhu H, Xie R, Liu X, Shou J, Gu W, Gu S, Che X. MicroRNA-494 improves functional recovery and inhibits apoptosis by modulating PTEN/AKT/mTOR pathway in rats after spinal cord injury. Biomed Pharmacother 2017; 92:879–87 [DOI] [PubMed] [Google Scholar]
- 38.Jiang R, Zhang C, Gu R, Wu H. MicroRNA-489-3p inhibits neurite growth by regulating PI3K/AKT pathway in spinal cord injury. Pharmazie 2017; 72:272–8 [DOI] [PubMed] [Google Scholar]
- 39.Gu S, Xie R, Liu X, Shou J, Gu W, Che X. Long coding RNA XIST contributes to neuronal apoptosis through the downregulation of AKT phosphorylation and is negatively regulated by miR-494 in rat spinal cord injury. IJMS 2017; 18:pii: E732. [DOI] [PMC free article] [PubMed] [Google Scholar] [Retracted]
- 40.Duran RC, Yan H, Zheng Y, Huang X, Grill R, Kim DH, Cao Q, Wu JQ. The systematic analysis of coding and long non-coding RNAs in the sub-chronic and chronic stages of spinal cord injury. Sci Rep 2017; 7:41008. [DOI] [PMC free article] [PubMed] [Google Scholar]
- 41.Kanehisa M, Goto S, Furumichi M, Tanabe M, Hirakawa M. KEGG for representation and analysis of molecular networks involving diseases and drugs. Nucleic Acids Res 2010; 38:D355–60 [DOI] [PMC free article] [PubMed] [Google Scholar]
- 42.Cruse JM, Lewis RE, Bishop GR, Lampton JA, Mallory MD, Bryant ML, Keith JC. Adhesion molecules and wound healing in spinal cord injury. Pathobiology 1996; 64:193–7 [DOI] [PubMed] [Google Scholar]
- 43.Jakovcevski I, Wu J, Karl N, Leshchyns'ka I, Sytnyk V, Chen J, Irintchev A, Schachner M. Glial scar expression of CHL1, the close homolog of the adhesion molecule L1, limits recovery after spinal cord injury. J Neurosci 2007; 27:7222–33 [DOI] [PMC free article] [PubMed] [Google Scholar]
- 44.Baek A, Cho SR, Kim SH. Elucidation of gene expression patterns in the brain after spinal cord injury. Cell Transplant 2017; 26:1286–300 [DOI] [PMC free article] [PubMed] [Google Scholar]
- 45.Wen T, Hou J, Wang F, Zhang Y, Zhang T, Sun T. Comparative analysis of molecular mechanism of spinal cord injury with time based on bioinformatics data. Spinal Cord 2016; 54:431–8 [DOI] [PubMed] [Google Scholar]
- 46.Yang Z, Lv Q, Wang Z, Dong X, Yang R, Zhao W. Identification of crucial genes associated with rat traumatic spinal cord injury. Mol Med Rep 2017; 15:1997–2006 [DOI] [PMC free article] [PubMed] [Google Scholar]
- 47.Laginha I, Kopp MA, Druschel C, Schaser KD, Brommer B, Hellmann RC, Watzlawick R, Ossami-Saidi RR, Pruss H, Failli V, Meisel C, Liebscher T, Prilipp E, Niedeggen A, Ekkernkamp A, Grittner U, Piper SK, Dirnagl U, Killig M, Romagnani C, Schwab JM. Natural killer (NK) cell functionality after human spinal cord injury (SCI): protocol of a prospective, longitudinal study. BMC Neurol 2016; 16:170. [DOI] [PMC free article] [PubMed] [Google Scholar]
- 48.Li H, Zhang Q, Yang X, Wang L. PPAR-gamma agonist rosiglitazone reduces autophagy and promotes functional recovery in experimental traumaticspinal cord injury. Neurosci Lett 2017; 650:89–96 [DOI] [PubMed] [Google Scholar]
- 49.Zhou K, Sansur CA, Xu H, Jia X. The temporal pattern, flux, and function of autophagy in spinal cord injury. IJMS 2017; 18:pii: E466. [DOI] [PMC free article] [PubMed] [Google Scholar]
- 50.Gong B, Radulovic M, Figueiredo-Pereira ME, Cardozo C. The ubiquitin-proteasome system: potential therapeutic targets for Alzheimer's disease and spinal cord injury. Front Mol Neurosci 2016; 9:4. [DOI] [PMC free article] [PubMed] [Google Scholar]
- 51.Sharma HS, Muresanu DF, Lafuente JV, Sjoquist PO, Patnaik R, Sharma A. Nanoparticles exacerbate both ubiquitin and heat shock protein expressions in spinal cord injury: neuroprotective effects of the proteasome inhibitor carfilzomib and the antioxidant compound H-290/51. Mol Neurobiol 2015; 52:882–98 [DOI] [PubMed] [Google Scholar]
- 52.Liu J, Zhang S, Fan X, Yuan F, Dai J, Hu J. Dexmedetomidine preconditioning ameliorates inflammation and blood–spinal cord barrier damage after spinal cord ischemia-reperfusion injury by down-regulation high mobility group box 1-toll-like receptor 4-nuclear factor kappaB signaling pathway. Spine 2019; 44:E74–E81 [DOI] [PubMed] [Google Scholar]
- 53.Impellizzeri D, Ahmad A, Di Paola R, Campolo M, Navarra M, Esposito E, Cuzzocrea S. Role of toll like receptor 4 signaling pathway in the secondary damage induced by experimental spinal cord injury. Immunobiology 2015; 220:1039–49 [DOI] [PubMed] [Google Scholar]
- 54.Yoneyama M, Fujita T. Function of RIG-I-like receptors in antiviral innate immunity. J Biol Chem 2007; 282:15315–8 [DOI] [PubMed] [Google Scholar]