

SUMMARY
In mammals, gene silencing by the RNA-induced silencing complex (RISC) is a well-understood cytoplasmic posttranscriptional gene regulatory mechanism. Here, we show that embryonic stem cells (ESCs) contain high levels of nuclear AGO proteins and that in ESCs nuclear AGO protein activity allows for the onset of differentiation. In the nucleus, AGO proteins interact with core RISC components, including the TNRC6 proteins and the CCR4-NOT deadenylase complex. In contrast to cytoplasmic miRNA-mediated gene silencing that mainly operates on cis-acting elements in mRNA 3′ untranslated (UTR) sequences, in the nucleus AGO binding in the coding sequence and potentially introns also contributed to post-transcriptional gene silencing. Thus, nuclear localization of AGO proteins in specific cell types leads to a previously unappreciated expansion of the miRNA-regulated transcriptome.
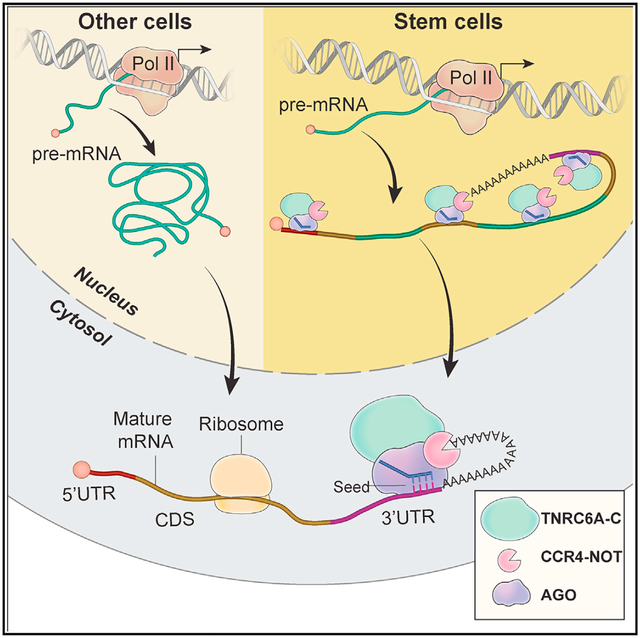
Graphical Abstract
In Brief
In stem cells, half of the AGO proteins are found in the nucleus and allow for the onset of ESC differentiation. Nuclear AGO assembles functional RISC complexes to silence target RNAs in a miRNA- and CCR4-NOT-dependent manner at target sites that include intronic and coding sequences.
INTRODUCTION
Argonautes are members of a highly conserved protein family that can be found in all kingdoms of life (Höck and Meister, 2008). Together with small RNAs, they form ribonucleoprotein complexes (RNPs) that function in multiple transcriptional and posttranscriptional gene regulatory pathways (Hutvagner and Simard, 2008). In mammals, Argonautes can be divided into the ubiquitous AGO clade and the germline-specific PIWI clade based on their small RNA interactors and their function (Bhattacharyya and Filipowicz, 2007; Höck and Meister, 2008; Hutvagner and Simard, 2008). In humans, the four AGO clade proteins (AGO1–4) are loaded with microRNAs, 21–23 nucleotide (nt) long RNA molecules (Bartel, 2004; 2009; Meister and Tuschl, 2004), which are expressed in a cell-type-specific manner and can accumulate to thousands of copies per cell (Bissels et al., 2009). Together with AGO proteins, they form miRNA-containing ribonucleoproteins (miRNPs) that silence targeted mRNAs (Bar tel, 2004, 2009; Filipowicz et al., 2008). At the target mRNA, the RNA-induced silencing complex (RISC) consisting of the miRNP and scaffolding proteins of the TNRC6 family is assembled, which in turn recruits the CCR4-NOT deadenylase complex, resulting in target mRNA deadenylation and subsequent degradation (Braun et al., 2011; Chekulaeva et al., 2011; Fabian et al., 2011).
miRNAs guide the miRNP via their “seed” region (nucleotides 2–8 of the miRNA) to complementary and often evolutionarily conserved sequences primarily located in the 3′ untranslated region (UTR) of mRNAs (Bartel, 2004; 2009, 2018). miRNA and target interactions have been intensely studied and resulted in the development of several target prediction algorithms (Agarwal et al., 2015; Betel et al., 2008, 2010; Enright et al., 2003; Kiriakidou et al., 2004; Krek et al., 2005; Lewis et al., 2003; Stark et al., 2003) that led to the estimate that up to 60% of human genes are under miRNA regulation (Friedman et al., 2009). These predictions are in line with more recent experimental studies identifying AGO targets on a genome-wide scale (Chi et al., 2009; Grosswendt et al., 2014; Hafner et al., 2010; Helwak et al., 2013). Consistently, miRNA silencing pathways play essential roles in a number of processes, including embryonic stem-cell differentiation and tissue development (Alberti and Cochella, 2017; Kloosterman and Plasterk, 2006).
miRNA silencing in mammals was mostly studied as a cytoplasmic process; nevertheless, in other organisms, such as Saccharomyces pombe or Arabidopsis thaliana, Argonaute proteins have key roles in nuclear processes, such as genome integrity, chromatin dynamics, and transcriptional control (Grewal, 2010), partially reflected in the function of mammalian PIWI proteins (Iwasaki et al., 2015). Recent reports raised the possibility that, in addition to their canonical cytoplasmic function, nuclear AGO proteins also contribute to gene regulation. Proposed regulatory functions for mammalian nuclear AGO proteins include promoter activation, transcriptional gene silencing, and alternative splicing (Ahlenstiel et al., 2012; Alló et al., 2014; Benhamed et al., 2012; Gagnon et al., 2014a; Huang et al., 2013; Janowski et al., 2006; Li et al., 2006; Liu et al., 2012; Ohrt et al., 2008; Schwartz et al., 2008; Sharma et al., 2015). However, due to incompletely characterized reagents, the molecular function and the extent of nuclear localization of AGO proteins in different mammalian cell types and tissues remain elusive.
Here, we show that in mammalian stem cells, including embryonic stem cells (ESCs) and adult muscle stem cells, ~50% of AGO proteins localized to the nucleus and this nuclear AGO protein pool was sufficient to allow for the onset of ESC differentiation. In the nucleus, AGO proteins assemble fully functional RISC and silence target mRNAs in a CCR4-NOT-dependent manner. In contrast to cytoplasmic miRNA targeting, nuclear AGO proteins expanded the target sequence space and in addition to 3′ UTR also bound intronic and coding sequences (CDS) in a miRNA-dependent manner to posttranscriptionally silence gene expression. Thus, nuclear localization of AGO proteins in specific cell types leads to a previously underappreciated expansion of the miRNA-regulated transcriptome with important implications for miRNA target predictions.
RESULTS
Stem Cells Contain High Levels of AGO Proteins in the Nucleus
The miRNA pathway is essential for the survival of adult muscle stem cells, also called satellite cells (SCs) (Cheung et al., 2012). This finding prompted us to investigate the expression and cellular distribution of the core component of the RISC, Argonaute 2 (AGO2), in undifferentiated myoblasts and differentiated myocytes derived from FACS-isolated SCs of mouse hindlimb muscle (Figure S1A). Surprisingly, we noted that the majority of AGO2 protein localized to the nucleus of both undifferentiated myoblasts and differentiated myocytes (Figure 1A). The high nuclear levels of AGO2 protein in mouse primary myoblasts and myocytes encouraged us to systematically quantify nuclear and cytoplasmic AGO2 levels in a panel of human and mouse cell lines after careful characterization of available AGO2 antibodies (Figures S1B–S1D). Biochemical fractionation (Gagnon et al., 2014b) experiments revealed a high level of heterogeneity of nuclear AGO2 levels in the assayed cell lines. Nuclear AGO2 levels ranged from 0% to 20% in HEK293 (human kidney), NTERA (human embryonal carcinoma), and SHSY5Y (human neuroblastoma) to 40%–70% in human induced pluripotent stem cells (iPSCs), human skeletal myoblasts (hMBs), and murine AGO1–4−/−ESCs engineered to express FLAG-HA-tagged-AGO2 upon induction with doxycycline (Zamudio et al., 2014) (in the following, we refer to the uninduced cells as AGO1–4−/− and to the doxycycline-induced cells as AGO1–4−/− -FHAGO2) (Figures 1B and 1C). Subnuclear fractionation in AGO1–4−/− -FHAGO2 ESCs revealed that ~80% of nuclear AGO2 protein was found in the nucleoplasm and only ~20% localized to chromatin (Figure 1D). Finally, immunofluorescence experiments with the same cell lines confirmed that AGO2 levels are particularly high in stem cells and progenitor cells (Figure S1E).
Figure 1. Stem Cells Contain High Levels of AGO Proteins in the Nucleus.

(A) AGO2 immunofluorescence staining of primary myoblasts (MB) and differentiated myocytes (MT) derived from FACS-sorted satellite cells (SC) from mouse hindlimb muscle. Phalloidin and Dapi stained for F-actin and DNA, respectively.
(B) AGO2 immunoblots from cytoplasmic and nuclear lysates in a panel of human and murine cell lines. hMB, human skeletal muscle cells; iPSC, cell line NTCR-5. 2i indicate stem cell culture conditions. The endoplasmic reticulum protein CALR served as cytoplasmic marker, LMNA and HIST3H3 served as nuclear markers.
(C) Quantification of the relative ratio of nuclear and cytoplasmic AGO2 proteins from three independent western blots for the indicated cell lines.
(D) AGO2 immunoblot from the cytoplasmic, nucleoplasmic, and chromatin fractions of AGO1–4−/− -FHAGO2 ESCs. CALR, LMNA, and HISTH3 served as controls for cytoplasm, nucleoplasm, and chromatin, respectively.
Considering that nuclear AGO2 levels were the highest in ESCs and primary myoblasts, we decided to use the readily available AGO1–4−/− -FHAGO2 ESCs, as well as C2C12 cells that recapitulate myogenesis, as model cell lines to dissect the function of nuclear AGO2 RNPs.
The Nuclear AGO Protein Pool Allows for the Onset of ESC Differentiation
A hallmark of the cell types with high nuclear AGO levels—SCs and ESCs—is their ability to differentiate, and therefore we wondered whether nuclear AGO levels vary during differentiation experiments. During a 2-day differentiation course of C2C12 myoblasts (MBs) into myocytes (MTs), Ago2 nuclear levels increased from 50% to 70% (Figure 2A). Similarly, upon AGO1–4−/− -FHAGO2 ESC differentiation by leukemia inhibitory factor (LIF) withdrawal for 3 days, nuclear AGO2 levels were comparable to those of undifferentiated cells at 40% (Figure 2B). Finally, we also differentiated ESCs expressing a Brachyury-GFP fusion gene (Fehling et al., 2003) under control of the endogenous promotor by LIF withdrawal and found that nuclear AGO2 levels remained stable at 40% in purified Brachyury-positive cells (Figure 2C). Taken together, our data indicate that during differentiation of ESCs, nuclear AGO2 levels remain stable and high.
Figure 2. The Nuclear Pool of AGO Proteins Allows for the Onset of Stem Cell Differentiation.

(A) AGO2 immunoblots from cytoplasmic and nuclear lysates of murine C2C12 differentiated from MB stage to 2-day MTs.
(B) (Left) AGO2 immunoblots from cytoplasmic and nuclear lysates of AGO1–4−/− -FHAGO2 cells differentiated (dif.) for 3 days by LIF withdrawal as well as non-differentiated (undif.) cells. (Right) qPCR confirming onset of differentiation by quantification of the Brachyury gene.
(C) (Left) AGO2 immunoblots from cytoplasmic and nuclear lysates of Brachyury-GFP tagged murine embryonic stem cells (mESC) differentiated for 3 days by LIF withdrawal as well as non-differentiated cells. GFP-positive cells were isolated by FACS sorting. (Right) qPCR confirming onset of differentiation by quantification of the Brachyury gene.
(D) Immunofluorescence staining of mClover-NLS-AGO2 transiently expressed in AGO1–4−/− ESCs. Dapi stained the DNA and Phalloidin for F-actin.
(E) Western blot confirming nuclear localization of transiently expressed in AGO1–4−/− ESCs. CALR served as cytoplasmic marker, and LMNA served as nuclear marker.
(F) Heatmap of expression changes of selected pluripotency, mesodermal and ectodermal marker genes after 6 days differentiation by LIF withdrawal in E14, AGO1–4−/− -FHAGO2, or NLSAGO2 compared to AGO1–4−/− ESCs.
We speculated that nuclear AGO2 might be functionally relevant and tested whether it might be involved in regulating stem cell differentiation. To this end, we generated an AGO2 expression construct with an added canonical nuclear localization signal (NLS-AGO2) and expressed the NLS-AGO2 by transient transfection in the AGO1–4−/− cells. First, we confirmed that NLS-AGO2 was expressed to wild-type levels in ESCs and that it was found exclusively in the nucleus (Figures 2D and 2E). NLS-AGO2 was also loaded with small RNAs (Figure S1F), suggesting that, as in the cytoplasm, a possible nuclear function of AGO proteins is likely miRNA mediated.
Next, we examined the requirement of nuclear AGO2 during differentiation of ESCs induced by LIF withdrawal. In a 6-day differentiation time course (Figure S1G), we used RNaseq to compare the transcriptome of AGO1–4−/− ESCs, which are not able to differentiate (Su et al., 2009) to AGO1–4−/− -FHAGO2 ESCs, AGO1–4−/− ESCs transfected with NLS-AGO2, as well as wild-type E14 ESCs. After 6 days of LIF withdrawal, as expected, expression of pluripotency marker genes (Thomson et al., 2011) was reduced, while the expression of a subset of mesodermal and ectodermal marker genes (Ding et al., 2015; Wang et al., 2017) increased in wild-type E14, NLS-AGO2, and AGO1–4−/− -FHAGO2 ESCs (Figure 2F; Table S1). While it has been reported before that miRNA-mediated gene silencing is necessary for stem cell differentiation (Gangaraju and Lin, 2009; Kuppusamy et al., 2013; Lakshmipathy et al., 2010; Mathieu and Ruohola-Baker, 2013), our data indicate that the nuclear AGO2 pool alone allows for the onset differentiation of ESCs (Figure 2F). Nevertheless, we cannot exclude the importance of cytoplasmic AGO2 for ESC differentiation, considering that the magnitude of gene expression changes upon LIF withdrawal in NLS-AGO2 cells do not match those in E14 or AGO1–4−/− -FHAGO2 ESCs containing both nuclear and cytoplasmic AGO2.
Nuclear AGO2 Is Loaded with Mature miRNAs and Interacts with Canonical RISC Components
Next, we aimed to dissect the architecture of the nuclear AGO RNP. We identified AGO2 interaction partners by mass spectrometry of immunoprecipitates from nuclear lysates of AGO1–4−/− -FHAGO2 ESCs (Figure 3A). We found that nuclear AGO2 interacted with all TNRC6 isoforms, as well as CNOT1, the core scaffolding component of CCR4-NOT deadenylase complex CCR4 (Figure 3B; Table S2). Western blotting for CNOT1, CNOT7, and TNRC6B in ESCs confirmed their nuclear localization and their interaction with AGO2 proteins (Figure 3C). Our data indicate that AGO proteins in the cytoplasm and the nucleus form the same well-characterized RISC (Filipowicz, 2005; Filipowicz et al., 2008; Pratt and MacRae, 2009; Sontheimer, 2005) and strongly suggested a role for nuclear AGO proteins in posttranscriptional gene silencing.
Figure 3. Nuclear AGO2 Interacts with Canonical RISC Components and Is Loaded with Mature miRNAs.

(A) Immunoblots of FLAG-immunoprecipitates (IP) from the nuclear fraction of AGO1–4−/− and AGO1–4−/− -FHAGO2 ESCs. FLAG IP from total cell lysates served as positive control.
(B) Summary of mass spectrometric analysis of FLAG-IP from the nuclear fraction of AGO1–4−/− and AGO1–4−/− -FHAGO2 cells.
(C) Immunoblots of FLAG-immunoprecipitates (IP) from the nuclear fraction of AGO1–4−/− -FHAGO2 ESCs for AGO2, TNRC6B, CNOT1, and CNOT7. Left panel shows input. IgG IP served as specificity control.
(D) Autoradiograph of a denaturing polyacrylamide gel fractionating radiolabeled RNAs recovered from FLAG-IP from the cytoplasmic and nuclear fractions of lysates of AGO1–4−/− -FHAGO2 ESCs and AGO1–4−/− ESCs. The lower panel shows immunoblots for FLAG controlling for IP, as well as CALR and LMNA controlling for cellular fractionations.
(E) Scatterplot comparing the total and the nuclear miRNA profile from induced AGO1–4−/− -FHAGO2 ESCs.
(F) Autoradiograph of a denaturing polyacrylamide gel fractionating radiolabeled RNAs recovered from FLAG-IP from the cytoplasmic and nuclear fractions of AGO1–4−/− -FHAGO2 and AGO1–4−/− ESC, as well as AGO1–4−/− ESCs overexpressing WT-AGO2 or Y529E-AGO2. The lower panel shows immunoblots for FLAG controlling for IP, as well as CALR and LMNA controlling for cellular fractionations.
The set of RNAs regulated by AGO proteins is determined by the sequence and abundance of their associated miRNAs (Bartel, 2004, 2009, 2018). Thus, we recovered AGO2-interacting small RNAs from the cytoplasm and nucleus of AGO1–4−/− - FHAGO2 ESCs by immunoprecipitation and found that overall association of AGO2 with small RNAs was comparable for nuclear and cytoplasmic complexes (Figure 3D). We next profiled the recovered small RNAs by sequencing and found no difference in small RNA profiles from nuclear and total fractions (Figure 3E; Table S3; r = 0.97). We observed similar results in C2C12 MB after isolation of AGO1–4 interacting small RNAs using a recently described Pan-AGO affinity peptide (Hauptmann et al., 2015) (Figures S2A–S2C; Table S3; r = 0.92). Next, we tested whether AGO needed to be loaded with small RNAs for nuclear entry. It was previously shown that an AGO2 construct with a phosphomimetic mutation that simulates the negatively charged environment in the 5′ end binding pocket (Y529E-AGO2) remains unloaded (Rüdel et al., 2011). In contrast to WT-AGO2, Y529E-AGO2 exclusively localized to the cytoplasm in AGO1–4−/− ESCs cells (Figure 3F). Our results show that nuclear and cytoplasmic RISC are similar in small RNA composition and suggest that the mature RISC might be licensed to enter the nucleus by miRNA-loading. While we did not observe miRNA-sequence-specific sorting of the miRNPs between nucleus and cytoplasm, AGO targets in the cytoplasm and nucleus may differ, considering the larger sequence space of precursor mRNAs.
Nuclear RISC Targets Thousands of Different Precursor mRNAs
In the cytoplasm, functional miRNA binding sites are largely restricted to mRNA 3′ UTRs (Bartel, 2004, 2009, 2018), which are not yet defined in nuclear transcripts, and thus, in the nucleus, the CDS, introns, and non-coding sequences may also be targeted by AGO proteins. In order to identify the target RNAs and precise binding sites of nuclear RISC at a transcriptome-wide scale, we used photoactivatable ribonucleoside-enhanced crosslinking and immunoprecipitation (Hafner et al., 2010) (PAR-CLIP) from nuclear and cytoplasmic fractions of AGO1–4−/− -FHAGO2 ESCs. Autoradiography of the crosslinked, ribonuclease-treated, and radiolabeled FLAG-immunoprecipitates showed in both cytosolic and nuclear fractions one major band migrating at ~100 kDa, consistent with the expected size of the AGO2 RNP (Figure 4A). Recovered RNA from the PAR-CLIP experiments was deep sequenced (Table S4), and genome-aligned reads were grouped into clusters by PARalyzer (Corcoran et al., 2011) to identify those enriched for crosslink-induced T-to-C conversions. Overall, we identified a total of 2,663 cytoplasmic and 7,454 nuclear AGO2 binding sites mapping to 1,463 and 3,019 distinct mRNAs, respectively (Figure 4B). As expected, in the cytoplasmic fraction, 85% of binding sites were found on exonic sequences with roughly 50% mapping to 3′ UTRs, consistent with the known functional preferences of AGO proteins (Figure 4B). In contrast, 50% of the AGO PAR-CLIP binding sites in the nucleus were found on intronic sequences, and another 40% distributed to exonic regions (Figure 4B). Nevertheless, 74% of the cytoplasmic AGO targets were also found occupied in the nucleus (Figure 4C), suggesting that AGO proteins target the same mRNAs in both compartments. For comparison, we also performed AGO2 PAR-CLIP in C2C12 myocytes and found that the results matched our findings from the AGO1–4−/− -FHAGO2 ESCs, indicating that nuclear AGO proteins show similar preferences across different cell types (Figures S3A and S3B). Taken together, our results suggest that in the nucleus AGO proteins expand their binding preferences and interact with the entire available pre-mRNA sequence with no appreciable preference for 3′ UTR over CDS or introns. The extent of conservation of intronic sites was only marginal (Figure S3C), possibly reflecting a co-transcriptional loading of AGO proteins on target mRNAs, considering that most splicing occurs before the mRNA is released from chromatin (Oesterreich et al., 2016).
Figure 4. Nuclear AGO2 Binds Thousands of Different mRNAs at miRNA Seed Sequence Complementary Sites.

(A) Autoradiograph of crosslinked and radio-labeled FLAG-AGO2 ribonucleoprotein separated by SDS-PAGE. The lower panel shows immuno-blots for FLAG-AGO2 controlling for IP, as well as CALR and LMNA controlling for cellular fractionations.
(B) Distribution of PAR-CLIP sequence reads across target mRNA 3′ UTR, coding sequence, 5′ UTR, and introns.
(C) Overlap of target transcripts from nuclear and cytoplasmic PAR-CLIP of AGO1–4−/− -FHAGO2.
(D) Enrichment of seed complementary sequence for the top nine most abundant miRNAs in AGO1–4−/− -FHAGO2 cells across target mRNA clusters in cytoplasmic (left) and nuclear (right) PAR-CLIP binding sites. Position 0 indicates the predominant T-to-C transition in target mRNA clusters.
Target Engagement of Nuclear RISC Is Directed by miRNA Seed Sequence Complementarity
In previous AGO PAR-CLIP experiments, we found an enrichment of miRNA seed complementary sequences 1–2 nt downstream of the predominantly crosslinked nucleotide on target RNAs (Farazi et al., 2011; Hafner et al., 2010). Thus, we searched for the 6-mer seed complementary sequences of the nine most abundant miRNAs in ESCs in our PAR-CLIP binding sites from nucleus and cytoplasm and found them enriched directly downstream of the predominant crosslinking site in CDS and 3′ UTR (Figures 4D and S3D). This enrichment was much lower in intronic sequences, further suggesting that AGO binding to introns could be the result of co-transcriptional loading or non-specific binding. In summary, the mechanism of target engagement of nuclear RISC follows the rules established for cytoplasmic RISC, which is driven by miRNA seed sequences (Lai, 2002; Lee et al., 1993; Lewis et al., 2003).
Considering the interaction of nuclear AGO2 with RISC components, we hypothesized that also in the nucleus AGO2 binding resulted in target mRNA destabilization. We therefore investigated the regulatory effect of nuclear RISC in AGO1–4−/−-FHAGO2 ESCs by RNaseq of nuclear transcripts and found significantly lowered target mRNA levels. This reduction correlated with the intensity of RISC binding that can be approximated by the number of binding sites per target mRNA (Ascano et al., 2012; Hafner et al., 2010; Yamaji et al., 2017) (Figure 5A). The abundance of the top 109 AGO2 targets was reduced on average by ~3.5-fold (p = 2.3 × 10−39, Mann-Whitney U-test) upon AGO2 induction. In fact, the overall impact of AGO proteins on target mRNAs was ~1.8 times more pronounced in the nucleus, compared to AGO targets in the cytoplasm (Figures S4A and S4B). To rule out an AGO protein effect on transcription, we sequenced RNA isolated from chromatin of AGO1–4−/− and AGO1–4−/− -FHAGO2. AGO2 expression only had a minor effect on nascent mRNA targets, consistent with its main localization in the nucleoplasm rather than chromatin (Figures 1D and S4C). Our data suggest that, at least in ESCs, the main function for nuclear AGO proteins relates to posttranscriptional gene regulation but that we cannot completely rule out co-transcriptional effects of AGO2 loading on nascent transcripts (Alló et al., 2014; Benhamed et al., 2012; Huang et al., 2013).
Figure 5. Nuclear AGO Proteins Destabilize their RNA Targets in a miRNA-Dependent Manner at Sites across the Entire Precursor mRNA.

(A) Cumulative distribution of abundance changes in nuclear RNA upon AGO2 induction in AGO1–4−/− -FHAGO2 ESCs determined by RNaseq. Nuclear AGO2 PAR-CLIP targets were ranked by number of binding sites: top 109, 110–610, and bottom 611–1168 ranked targets and compared to non-targets. p values were determined by Mann-Whitney U test.
(B) Same as in (A), except nuclear AGO2 targets were binned by the presence of a 6-mer (2–7 of the miRNA), 7-mer (2–8 nt of the miRNA), and 8-mer (1–8 nt of the miRNA) seed complementary sequence to the top 20 miRNAs in ESCs, or no identified seed sequence complement (no-mer) and compared to non-targets.
(C) Cumulative distribution of abundance changes in total RNA upon AGO2 induction in AGO1–4−/− -FHAGO2 ESCs determined by RNaseq. Cytoplasmic AGO2 targets were binned by the presence of a 6-mer (2–7 of the miRNA), 7-mer (2–8 nt of the miRNA), and 8-mer (1–8 nt of the miRNA) seed complementary sequence to the top 20 miRNAs in ESCs, or no identified seed sequence complement (no-mer) and compared to non-targets.
(D) Same as in (A), except nuclear AGO2 targets were binned by the presence of binding sites exclusively in the 3′ UTR, CDS, or intron.
(E) Cumulative distribution of abundance changes in nuclear RNA upon miR-16 introduction into AGO1–4−/− -FHAGO2 ESCs. Experimentally determined miR-16 target sites were downloaded from miRdb.org and binned according to binding in CDS or 3′ UTR.
(F) Control siRNAs and siRNAs targeting NEAT1 were transfected into iPSCs and HEK293 and NEAT1 levels determined using RT-qPCR. Error bars, SD.
We next asked whether AGO-mediated post-transcriptional silencing in the nucleus depended on the miRNA-seed sequence. We binned nuclear AGO targets by the presence of either a 6-mer, 7-mer, 8-mer, or no detectable seed complementary sequence (no-mer) to the 20 most abundant miRNAs in murine ESCs. Analogous to the well-understood molecular mechanism of miRNA-mediated silencing in the cytoplasm (Grimson et al., 2007; Lewis et al., 2003, 2005), the magnitude of the destabilization effects in the nucleus tended to drop, albeit non-significantly, from 8-mer to 7-mer to 6-mer, while there was significant reduction in mRNA levels of targets with no detectable seed complement compared to non-targets (Figure 5B,C).
Cytoplasmic miRNA-mediated gene silencing operates on cis-acting elements in the 3′ UTR of target mRNAs (Lai, 2002; Lee et al., 1993; Lewis et al., 2003), mirrored in the preference of AGO binding to 3′ UTRs in the cytoplasm (Figure 4B). AGO binding sites in the CDS of mRNAs were observed before in cell lines that do not contain nuclear AGO proteins; however, they were only found to marginally contribute to miRNA-mediated gene silencing, likely due to the ribosome stripping off AGO proteins before functional RISC assembly (Easow et al., 2007; Fang and Rajewsky, 2011; Hafner et al., 2010; Hendrickson et al., 2008; Lewis et al., 2005). In the nucleus, AGO proteins showed little preference across the precursor mRNA, and we found that without the ribosome present, these additional AGO binding sites now also contributed to target mRNA destabilization to a similar extent as those in the 3′ UTR (Figure 5D). As expected, gene expression changes in the nucleus also propagated to the cytoplasm (Figure S4D).
In order to observe direct effects of nuclear miRNA-mediated gene silencing, we transfected miR-16, normally not expressed in ESCs, into AGO1–4−/− -FHAGO2 cells (Figures S4E and S4F) and quantified gene expression changes in the nucleus and cytoplasm using RNaseq. We binned miR-16 targets previously identified in multiple CLIP studies (Wang, 2016) according to binding in the 3′ UTR or CDS and compared their gene expression changes to non-targets. Consistent with our previous observations, both CDS sites and 3′ UTR sites were functional, indicating that nuclear AGO proteins indeed expand their effective target space (Figures 5E and S4G).
siRNA-Mediated Knockdown of Exclusively Nuclear Transcripts Is Possible in Cell Lines with Nuclear AGO2
The cytoplasmic localization of the RNA interference (RNAi) machinery in most studied cell types complicates knockdown of nuclear transcripts using small interfering RNAs (siRNAs) (Lennox and Behlke, 2016). We hypothesized that siRNA-mediated knockdown of exclusively nuclear long non-coding RNAs (lncRNAs) would be possible in stem cells that contain high levels of nuclear AGO2. We transfected control siRNAs and siRNAs targeting NEAT1 in human iPSCs and HEK293 cells and compared knockdown efficiency using RT-qPCR and found significantly reduced NEAT1 levels only in iPSCs (Figure 5F). This result suggests that nuclear AGO2 is capable of siRNA-mediated target RNA cleavage and opens up the possibility of manipulating nuclear lncRNAs using RNAi in certain cell types, including stem cells.
Nuclear AGO Proteins Depend on the CCR4-NOT Complex for Target mRNA Destabilization
In the cytoplasm, the RISC recruits the CCR4-NOT deadenylase complex, resulting in target mRNA destabilization. Considering that we also found those canonical RISC components interacting with AGO in the nucleus (Figures 3B and 3C), we next asked whether depletion of the CCR4-NOT complex would impact nuclear target mRNA destabilization by AGO. We performed shRNA knockdown (KD) of either CNOT1 or CNOT7 in AGO1–4−/− and AGO1–4−/− -FHAGO2 cells, validated the KD efficiency by western blot (Figures 6A and 6B) and quantified nuclear and cytoplasmic transcripts using RNaseq. We found that CCR4-NOT depletion abrogated the AGO effect on target mRNA abundance not only as expected in the cytoplasm but also in the nucleus (Figures 6C and 6D). Note that expression of the control shRNA alone already dampened AGO2-mediated gene regulation both in the cytoplasm and nucleus, as would be expected considering the well-documented competition of shRNAs for the RNAi machinery (Grimm, 2011). Taken together, our data suggest that while in the nucleus AGO proteins target an expanded sequence space to include mRNA CDS and introns, nevertheless, as in the cytoplasm, nuclear miRNA-mediated gene silencing depended on the CCR4-NOT complex.
Figure 6. Nuclear AGO Proteins Depend on the CCR4-NOT Pathway for RNA Destabilization.

(A) (Left) Western blot confirming the knockdown of CNOT1 in the nucleus and cytoplasm using shRNAs. (Right) Quantification of CNOT1 knockdown from three independent experiments. Error bars, SD.
(B) Same as in (A), except for CNOT7. Error bars, SD.
(C) mRNA expression changes in AGO1–4−/− -FHAGO2 and AGO1–4−/− ESCs determined by RNaseq from the nuclear fraction after CNOT1 and CNOT7 depletion. AGO2 targets were binned by number of binding sites. p values are determined by Mann-Whitney U test.
(D) Same as in (C), except for cytoplasmic RNaseq.
(E) Schematic representation of our working model. In stem cells, AGO proteins posttranscriptionally regulates its targets in the nucleus at sites in the mRNA 3′ UTR, as well as CDS and intron.
DISCUSSION
Here, we presented a comprehensive evaluation of the nucleocytoplasmic distribution of AGO proteins in human and murine cell lines. We only found high nuclear AGO levels in stem cells, and—taking advantage of an AGO1–4−/− cell line—we were able to demonstrate that nuclear AGO proteins destabilize target mRNAs in a miRNA-seed sequence dependent manner via the CCR4-NOT complex.
AGO Proteins Are Found in the Nucleus of Stem Cells
The existence of AGO proteins and other RISC components in the nucleus was previously observed (Gagnon et al., 2014a; Ohrt et al., 2008; Schraivogel et al., 2015); nevertheless, due to incompletely characterized reagents, the prevalence of this phenomenon could not be readily assessed. We found a strong cell-type-specific dependence of subcellular AGO localization, with typical human model cell lines used for the mechanistic dissection of miRNA-mediated gene silencing, such as HEK293 and SHSY5Y showing little or no nuclear AGO and stem cells containing more than half of the AGO protein pool in the nucleus. We could show that in ESCs the nuclear AGO pool alone allowed for the onset of differentiation to occur, suggesting that nuclear AGO proteins are functional. More careful analysis of subcellular AGO protein localization from additional cell lines and mammalian tissues will allow gauging of the extent and functional importance of nuclear miRNA-mediated gene silencing.
Nuclear and Cytoplasmic RISC Have a Similar Composition
The current deep mechanistic understanding of mammalian miRNA-mediated gene silencing was obtained in studies using model cell lines with predominantly cytoplasmic mRNA localization (Bartel, 2004, 2009, 2018). Nevertheless, there has been extensive speculation on possible nuclear roles of AGO proteins that was suggested to include a wide range of functions, such as promoter activation, transcriptional gene silencing, and alternative splicing (Schraivogel and Meister, 2014). It remains difficult to reconcile the evolutionarily conserved interactions of AGO proteins with TNRC6 and the effector complex CCR4-NOT (Braun et al., 2011; Chekulaeva et al., 2011; Fabian et al., 2011) with the potential stable acquisition of multiple unrelated additional functions. Here, we found that the composition of nuclear and cytoplasmic RISC is indeed similar, obviating the need to imply an alternative molecular mechanism of AGO function.
Impact of Nuclear AGO Localization on miRNA Target Prediction Algorithms
Nuclear localization of AGO proteins allows miRNA-mediated gene silencing to bypass the usual targeting constraint and expand its effective target sequence space to include CDS and introns in addition to the 3′ UTR. This expansion has profound implications on the computational prediction of miRNA regulatory networks, which generally rely on the analysis of cis-acting elements in the mRNA 3′ UTR (Agarwal et al., 2015; Betel et al., 2008, 2010; Enright et al., 2003; Kiriakidou et al., 2004; Krek et al., 2005; Lewis et al., 2003; Stark et al., 2003). The high sensitivity and specificity of miRNA target predictions made experimental interactome analysis using CLIP approaches (Chi et al., 2009; Grosswendt et al., 2014; Hafner et al., 2010; Helwak et al., 2013) largely redundant. Nevertheless, at least in ESCs, the high levels of nuclear AGO proteins targeting premRNA indicates that predicted miRNA regulatory networks remain incomplete. Our observations can explain the number of functional miRNA binding sites in the CDS of the pluripotency factors Nanog and Sox2 (Tay et al., 2008), which were also captured in our analysis. Our work underscores the need to revisit AGO protein localization across mammalian cell types and tissues in order to better define miRNA-controlled posttranscriptional networks.
STAR★METHODS
CONTACT FOR REAGENT AND RESOURCE SHARING
As Lead Contact, Markus Hafner is responsible for all reagent and resource requests. Please contact Markus Hafner at markus.hafner@nih.gov with requests and inquiries.
METHOD DETAILS
Plasmid constructs and expression
AGO2-WT and Y529E-AGO2 plasmids were transformed into DH5α competent bacteria (NEB). The NLS-AGO2 cloning procedure was designed using SnapGene software. The fragments containing NLS transport signal and florescent protein were cloned in frame N-terminally of AGO2 coding sequence. The plasmids containing AGO2 sequence were grown up in the dam-/dcm competent E. coli (NEB) to remove methylation on the ClaI restriction site sequence. The plasmid was purified and linearized with ClaI restriction enzyme (NEB) and gel purified using Zymoclean gel DNA recovery kit. The GFP variant mClover was PCR amplified with primers containing SV40-NLS from pNCS-mClover3 (Addgene). The linearized plasmid and PCR fragments were combined using NEBuilder HIFI DNA assembly kit (NEB), transformed into competent E.coli (NEB) and grown on selection plates overnight. The following oligodeoxyribonucleotides were used for cloning:
NLS-GFP-FW 5′ –GTACCGAGCTCGGATATGCCAAAGAAGAAGCGGAAGGTCGGTATCCACGGAGTCCCAGCAGCCGTGAGCA AGGGCGAGG - 3′.
NLS-GFP-RW 5′-GGCGGCGGCGATATCGCACTTGTACAGCTCGTCCAT–3′
AGO affinity peptide purification
The FLAG-GST-T6B WT and mutant peptides was expressed and purified as described (Hauptmann et al., 2015). Briefly, constructs were expressed in BL21-Gold(DE3)pLysS competent cells (Agilent). Bacteria, induced with 1 mM Isopropyl β-D-1-thiogalactopyranoside (IPTG), were grown in 1 L overnight at 18°C to OD 0.6. The bacteria were pelleted at 4000g for 15 min and resuspended in 25 mL GST-A buffer (1 mM 4-(2-aminoethyl) benzenesulfonyl fluoride hydrochloride (AEBSF), 1 mM DTT in PBS) supplemented with 1 mg/mL lysozyme (Sigma). Samples were sonicated three times for 3 min at 100% amplitude (Sonics, VCX130) and cleared by centrifugation at 20,000g for 20 min. The lysate was loaded onto a column containing 2 mL of bead volume glutathion Sepharose beads (Sigma) and washed two times with GST-A buffer. The GST-tagged protein was eluted in 10 mL of GST-B buffer (20 mM Tris, pH 8.0, and 10 mM glutathione in PBS). The peptide was concentrated using Amicon Ultra-15 Centrifugal Filter Unit (Millipore) and desalted using Zeba Spin Desalting Columns (ThermoFisher).
Cell lines and differentiation procedure
HEK293, NTERA, SHSY5Y, and AGO2−/− MEF cells were maintained in Dulbecco’s modified Eagle’s medium (DMEM) (GIBCO) supplemented with 10% fetal bovine serum (FBS) (GIBCO) and 100 U/ml Penicillin-Streptomycin (GIBCO) in a humidified incubator at 5% CO2 and 37°C.
The iPSC cell line NTCR-5 was cultured in Essential 8 medium supplemented with 1x Essential 8 supplement (GIBCO) according to manufactures instructions. Cells were grown on Vitronectin (GIBCO) coated plates and passaged with Versene Solution (GIBCO). The growth medium was changed daily and cells passaged every 3 days.
Human Skeletal Muscle Cells and Myoblasts (referred herein as hMB) were cultured with SkGM-2 BulletKit (Lonza) according to manufactures instructions. Cells were differentiated into myocytes by switching to differentiation media containing 2% horse serum (GIBCO) and 1% Insuline-Transferrin-Selenium (ThermoFisher) for 2 days.
C2C12 cells were maintained in DMEM (ThermoFisher) supplemented with 20% FBS and 100 U/ml Penicillin-Streptomycin. Cells were differentiated into myocytes by switching to differentiation media containing 2% horse serum (GIBCO) and 1% Insuline-Transferrin-Selenium (ThermoFisher) for 2 days.
ES cells were cultured on plates coated with 0.1% gelatin (Millipore) in DMEM (ThermoFisher) supplemented with 15% heat-inactivated FBS (HyClone), 0.1 mM 2-mercaptoethanol, 2 mM L-glutamine, 0.1 mM non-essential amino acids, 1mM Sodium Pyruvate and 1000 U/ml recombinant leukemia inhibitory factor (LIF; Millipore). To convert serum-cultured ES cells to ground state, serum cultured ES cells were cultured and passaged in ESGRO-2i medium (Millipore) following the manufacturer’s instructions.
1×10⁵ wild-type E14 ESCs, Brachyury-GFP, AGO1–4−/− or AGO1–4−/− -FHAGO2 ESC differentiation was induced by LIF withdrawal (Fehling et al., 2003; Kubo et al., 2004). The media was changed daily and the cells collected after 3 or 6 days of differentiation. Brachyury-GFP cells were isolated by fluorescent-activated cell sorting (FACS) (Conti et al., 2005). NLS-AGO2 was transfected in AGO1–4−/− for 16 hr using Lipofectamin Stem-in reagent (ThermoFisher) before LIF withdrawal for 6 days.
Satellite cells isolation by FACS from mouse Tibialis anterior muscle
Satellite cells (SCs) were sorted following the method described by Liu et al. (Liu et al., 2015). Briefly, hindlimb muscles from 3 months old adult wild-type mice were minced and digested with collagenase for 1 h and SCs were released from muscle fibers by further digesting the muscle slurry with collagenase/dispase for additional 30 min. After filtering out the debris, cells were incubated with the following primary antibodies: biotin conjugated VCAM1, Pacific Blue-labeled Sca1, APC-labeled CD31/CD45, and SYTOX Green. Satellite cells were sorted by gating on positive VCAM1- and negative on Pacific Blue-labeled Sca1, APC-labeled CD31/CD45, and SYTOX Green staining.
Cellular fractionation
Cells were fractionated as described previously (Gagnon et al., 2014b). Briefly, a confluent 100 mm dish of cells were collected in 15 mL conical tubes. The pellet corresponding to roughly or 10×106 cells was resuspended 500 μl HLB buffer, and scaled up accordingly, (10 mM Tris, pH 7.5, 10 mM NaCl, 3 mM MgCl2, 0.3% NP-40 (vol/vol), and 10% glycerol (vol/vol), supplemented with protease inhibitor and phosphatase inhibitor (Roche) by gentle pipetting and left on ice for 5 min. Nuclei were separated by centrifugation at 800g for 4 min and the supernatant collected as the cytoplasmic fraction. The nuclear pellet was washed three times in 1 mL HLB buffer and each time collected by centrifugation at 200g for 2 min. The washed nuclear pellet was resuspended in an equal volume of NLB buffer (20 mM Tris, pH 7.5, 150 mM KCl, 3 mM MgCl2, 0.3% NP-40 (vol/vol), and 10% glycerol (vol/vol), supplemented with protease and phosphatase inhibitor (Roche). The lysate was sonicated 2 times for 30 s at 60% amplitude (Sonics, VCX130) to break up the chromatin. The cytoplasmic and nuclear fractions were further cleared from insoluble debris by centrifugation at 12,000g for 15 min and the supernatants collected.
Immunofluorescence
Cells were trypsinized and plated on glass coverslips inside 12-well dishes (Fisher Scientific) overnight. Next cells were washed once in 1 mL 1xPBS and fixed with 500 μl 4% paraformaldehyde (Alfa Aesar) for 15 min at room temperature with gentle agitation. Cells were washed with 1 mL 1xPBS and permeabilized in 1 mL 0.5% Triton X-100 for 10 min. Cells were blocked with 1 mL 5% BSA (Sigma) for 30 min and stained with AGO2 (Millipore) overnight at 1:100 dilution in 5% BSA. The cells were washed several times in 1xPBS and stained with 1:200 phalloidin (ThermoFisher), to visualize F-actin, and 1:2000 goat-anti rat Alexa 488 in 5% BSA (ThermoFisher) for 30 min at room temperature. To visualize the DNA within the nuclear compartment, cells were stained with 300 nM 4’,6-diamidino-2-phenylindole (DAPI; ThermoFisher) for 3 min at room temperature. Slides were mounted using 10 μl Vecta-shield (Vector Laboratories). Confocal images were taken on a Zeiss LSM780 and the images analyzed using ImageJ software and Adobe Photoshop.
Immunoprecipitations and pulldowns
All immunoprecipitation in AGO1–4−/− -FHAGO2 ESCs were carried out with 60 μl anti-FLAG M2 magnetic bead slurry (Sigma Aldrich) per 10×106 cells, and scaled up accordingly, after cellular fractionation described above. Lysates were incubated with anti-FLAG M2 magnetic beads for 2 hr at 4°C. The immunoprecipitated material was washed three times with 1 mL NP-40 lysis buffer (20 mM Tris, pH 7.5, 150 mM NaCl, 2 mM EDTA, 1% (v/v) NP40) and collected each time on a magnetic rack. After the final wash, beads were resuspended in 60 μl 2x sample buffer and boiled at 95°C for 5 min. The supernatant was collected, and the beads discarded.
All pulldowns in C2C12 were carried out with 500 μg Pan-AGO affinity peptide or mutant affinity peptide and 60 μl anti-FLAG M2 magnetic bead slurry per 10×106 cells, and scaled up accordingly (Hauptmann et al., 2015). Lysates were incubated with Pan-AGO affinity peptide for 1.5 hr and subsequently with anti-FLAG M2 magnetic beads for a further 1.5 hr at 4°C. The immunoprecipitated material was washed three times with 1 mL NP-40 lysis buffer and collected each time on a magnetic rack. After the final wash, beads were resuspended in 60 μl 2x sample buffer and boiled at 95°C for 5 min. The supernatant was collected, and the beads discarded.
AGO1–4 pull down and small RNaseq
Roughly 10×106 cells were fractionated per condition. In C2C12, AGO1–4 were pulled down by using the Pan-AGO affinity peptide, described above. In AGO1–4−/− -FHAGO2 ESCs, AGO2 was immunoprecipitated with anti-FLAG M2 magnetic beads, described above. The pull-down was washed three times in 1 mL NP40 lysis buffer. During the last wash, 100 μl or 10% of beads were removed and incubated at 95°C for 5 minutes in 50 μl 2x sample buffer to control for efficiency of immunoprecipitation. These samples were fractionated on a 4%–12% SDS-PAGE and transferred to nitrocellulose membrane and pull-down efficiency was determined by immunoblotting against AGO2 (Abcam, 32381) or against anti-FLAG (Sigma). To the remaining beads 500 μl TRIzol reagent (ThermoFisher) was added and the RNA extracted according to the manufacturer’s instructions. The RNA pellet was diluted in 20 μl of water. The sample was split and half of the sample was dephosphorylated with 0.5 U/μl of CIP alkaline phosphatase at 37μC for 15 min and subsequently radiolabeled with 0.5 μCi γ-32P-ATP and 1 U/μl of T4 PNK kinase for 20 min at 37°C. The AGO interacting RNAs were visualized on a 15% Urea-PAGE. The remaining RNA was carried through a small RNA library preparation as previously described (Hafner et al., 2012) using the adapters and primers listed in the table titled “Adapters and Primers Used for PAR-CLIP and Small RNA Library Construction” and the cDNA was sequenced on an Illumina HiSeq 3000.
PAR-CLIP
PAR-CLIP was performed as previously described with minor modifications (Benhalevy et al., 2017; Danan et al., 2016; Hafner et al., 2010). Two day differentiated C2C12 myocytes, cultured in 5×15 cm dishes were treated with 1 mM 4-thiouridine and 10×15 cm AGO1–4−/− -FHAGO2 cells were treated with 0.75 mM 4-thiouridine (Sigma Aldrich) and 2.5 μg/ml Doxycycline overnight and UV crosslinked at 312 nm for 5 min. The cells were scraped and collected, washed in 1xPBS and fractionated into cytoplasmic and nuclear fractions. The lysate was treated with 1 U/ul of RNaseT1 for 15 min at 22°C. AGO2 was immunoprecipitated as described above with anti-FLAG M2 magnetic beads in AGO1–4−/− -FHAGO2 cells or Pan-AGO affinity peptide in C2C12. The beads were washed three times in NP40 lysis buffer and subsequently treated with 10 U/ul of RNaseT1 for 15 min at 22°C. The beads were washed again three times in NP40 lysis buffer and dephosphorylated with 0.5 U/ml CIP alkaline phosphatase. The immunoprecipitated material was treated with 0.5 γCi g-32P-ATP and 1 U/μl of T4 PNK kinase for 30 min at 37°C. Beads were washed five times with PNK wash buffer (50 mM Tris–HCl, pH 7.5, 50 mM NaCl, 10 mM MgCl2) and resuspended in 100 μl of 2x sample buffer and separated on a 4%–12% SDS-PAGE and transferred to a nitrocellose membrane. The AGO2 interacting RNAs were visualized by autoradiography and the band corresponding to AGO2 was isolated. The RNA was extracted by Proteinase K digestion, purified by phenol-chloroform extraction and precipitated with three volumes of ethanol. The purified RNA from each cellular fraction was ligated with a unique 3′ adaptor with Rnl2(1–249)K227Q ligase (NEB) over night at 4°C. The RNA was loaded onto a 15% Urea-PAGE and the ligated RNA cut out and extracted from the gel with 400 μl 0.3M NaCl at 60°C for 45 min with vigorous shaking. The gel pieces were filtered out and RNA in the flow through precipitated with three volumes of ethanol. The RNA pellet was dissolved in water and ligated with 5′ adaptor using Rnl1 ligase (NEB) for 1 hr at 37°C. The RNA was loaded onto a 12% Urea-PAGE and the ligated RNA cut out and extracted from the gel with 400 μl 0.3M NaCl at 60°C for 45 min with vigorous shaking. The gel pieces were filtered out and RNA in the flow through precipitated with three volumes of ethanol. The RNA were revers transcribed using Superscript III reverse transcriptase (ThermoFisher) with 3′ RT primer for 2 hr at 50°C, according to manufacturer’s instructions. Next, the generated cDNA was PCR amplified using Taq DNA polymerase (ThermoFisher). The primers used for PAR-CLIP is listed in the table below, “Adapters and Primers Used for PAR-CLIP and Small RNA Library Construction.” The PCR band corresponding to the correct size of amplification (143–153 bp) was purified using a 3% PippinPrep according to manufacturer’s instructions and quantified. PAR-CLIP cDNA libraries were sequenced on an Illumina HiSeq 3000 instrument. Clusters of overlapping reads uniquely mapping to the mouse genome mm10, respectively, were generated using the PARalyzer software (Corcoran et al., 2011) allowing for one mismatch and otherwise default settings. Clusters were annotated against the following Gencode gtf file: mouse: gencode.vM2.chr_patch_hapl_scaff.annotation.gtf (https://www.gencodegenes.org/).
Table.
Adapters and Primers Used for PAR-CLIP and Small RNA Library Construction
| 3′ Adapters: All 3′ Adapters Are Preadenylated at the 5′ End, IDT | |
| Adaptor 1 | NNTGACTGTGGAATTCTCGGGTGCCAAGG |
| Adaptor 2 | NNACACTCTGGAATTCTCGGGTGCCAAGG |
| Adaptor 3 | NNACAGAGTGGAATTCTCGGGTGCCAAGG |
| Adaptor 4 | NNGCGATATGGAATTCTCGGGTGCCAAGG |
| Adaptor 47 | NNTCTGTGTGGAATTCTCGGGTGCCAAGG |
| Adaptor 48 | NNCAGCATTGGAATTCTCGGGTGCCAAGG |
| Adaptor 49 | NNATAGTATGGAATTCTCGGGTGCCAAGG |
| Adaptor 50 | NNTCATAGTGGAATTCTCGGGTGCCAAGG |
| 5′ Adapter: RNA | |
| Adaptor 1 | GUUCAGAGUUCUACAGUCCGACGAUC |
| 3′ PCR Primers: Illumina Barcode Is Underlined | |
| Primer 1 | CAAGCAGAAGACGGCATACGAGATCGTGATGTGACT GGAGTTCCTTGGCACCCGAGAATTCCA |
| Primer 2 | CAAGCAGAAGACGGCATACGAGATACATCGGTGACTG GAGTTCCTTGGCACCCGAGAATTCCA |
| Primer 3 | CAAGCAGAAGACGGCATACGAGATGCCTAAGTGACTGG AGTTCCTTGGCACCCGAGAATTCCA |
| Primer 4 | CAAGCAGAAGACGGCATACGAGATTGGTCAGTGACTGG AGTTCCTTGGCACCCGAGAATTCCA |
| 5′ PCR Primer | |
| Primer 1 | AATGATACGGCGACCACCGACAGGTTCA GAGTTCTACAGTCCGA |
RNaseq
Whole cell, cytoplasmic, nuclear, nucleoplasmic and chromatin fraction was fractionated (Gagnon et al., 2014b) from roughly 10×106 cells induced or uninduced with 2.5 μg/ml Doxycycline in AGO1–4−/− ESCs. Cells were washed once in 1x PBS and collected by scraping. The cell pellet was lysed in 1 mL HLB buffer for 5 min on ice and spun at 800g for 4 min. The supernatant was collected as the cytoplasmic fraction. 250 μl of the cytoplasmic fraction was resuspended in three volumes of TRIzol reagent and 100 μl re-suspended in 2x sample buffer. The pellet was washed once with 500 μl HLB buffer and the supernatant discarded. The pellet was resuspended in 1 mL MWS buffer (10 mM Tris-HCl, pH 7.0, 4 mM EDTA, 0.3 M NaCl, 1 M urea, and 1% NP-40 (vol/vol), supplemented with protease and phosphatase inhibitor (Roche)) and lysed on ice for 15 min. The samples were spun at 500g for 5 min and the supernatant collected as the nucleoplasmic fraction. 250 μl of the nucleoplasmic fraction was resuspended in three volumes of TRIzol reagent and 100 μl resuspended in 2x sample buffer. The remaining chromatin fraction was washed two times in NLB buffer and once in ice cold 1xPBS. The chromatin pellet was resuspended directly in 1 mL of TRIzole. The sample was heated at 65°C for about 3–10 min until the chromatin pellets dissolved completely. The protein from the chromatin fraction was collect from the organic TRIzol phase. Briefly, 300 μl of ethanol was added per 1 mL of TRizol and the samples mixed. The samples were incubated 3 min at room temperature, followed by centrifugation at 2000g for 5 min at 4°C to pellet the DNA. The supernatant was collected and 1.5 mL of Isopropanol (Sigma) was added. The samples were precipitated for 10 min at room temperature and spun at 12,000g for 10 more minutes at 4°C. The supernatant was discarded, and the pellet washed with 2 mL Isopropanol, spun at 12,000 g for 10 min and washed with 2 mL ethanol. The remaining pellet was resuspended in 100 μl of 2x sample buffer and boiled at 65°C for 30 min with shaking and a further 5 min at 95°C (and one tenth of the chromatin fraction was loaded as compared to the cytoplasmic and nucleoplasmic fractions to achieve equal cell number). RNA was extracted according to manufacturer’s instructions. rRNA was removed using the Ribo-Zero rRNA Removal Kit (Illumina), followed by cDNA library preparation (NEB). The samples were sequenced on illumina HiSeq 3000 and the sequenced reads were aligned to the mouse genome using TopHat (Trapnell et al., 2012, 2013). Cufflinks and Cuffdiff were used to quantify transcripts and determine differential expression (Trapnell et al., 2012, 2013).
Mass spectrometry
Whole cell lysate or nuclear fraction was prepared from AGO1–4−/− -FHAGO2 ESCs induced with 2.5 μg/ml Doxycycline. Nuclear fraction was also prepared from AGO1–4−/− ESCs not treated with Doxycycline. FLAG-AGO2 was immunoprecipitated as described above, and the beads washed three times with NP40 lysis buffer. Proteins bound to the beads were recovered using an acid extractable detergent (Lin et al., 2013), cysteines reduced and blocked and digested with trypsin. The samples were labeled using reductive dimethylation (Boersema et al., 2009) and fractionated using cation exchange fractionation (Kulak et al., 2014). Samples were analyzed by LC/MS/MS mass spectrometry with data analysis using MaxQuant (Cox and Mann, 2008).
shRNA knockdown of CNOT1 and CNOT7
10 cm HEK293T cells were transfected using lipofectamin 2000 (ThermoFisher) together with 7.5 μg of lentiviral packaging plasmid PsPAx2, 5 μg of viral envelop plasmid pMD2.G and 10 mg of CNOT1, CNOT7 or non-target pLKO.1 plasmid (see table below under “No target” for sequences). After 24 hr of transfection the growth medium was changed. 48 hr, 72 hr and 96 hr after transfection the virus was harvested and pooled. The samples were filtered through a 0.45 mm filter and aliquoted and stored at −80°C. ESC were infected with lentiviral containing medium for 24 hr. After 24 hr of infection, the ESC media was exchanged to 0.1 μg/ml of puromycin containing medium. Cells were grown in the presence of puromycin for two days to select for infected cells. Protein levels of CNOT1 and CNOT7 were screened periodically until > 50% protein depletion (~13 days). Once steady state levels were confirmed, cells were cultured in the presence of doxycycline (to maintain AGO2) or absence of doxycycline (to remove AGO2) for another 4 days. The cells were collected and fractionated into cytoplasmic and nuclear fraction. The RNA was extracted and sequenced as described above.
siRNA knockdown of NEAT1
iPSC and HEK293 cells were transfected with 30 pmol of NEAT1 siRNA (Dharmacon) for 48 hr using Lipofectamine RNAiMAX (ThermoFisher), according to the manufacturer’s instructions. The RNA was extracted with TRIzol and reverse transcribed with Superscript III reverse transcriptase (ThermoFisher), using random hexamers, according to the manufacturer’s instructions. The knockdown efficiency was evaluated by qPCR (see table “ShRNA against CNOT1 and CNOT7”).
miR-16 overexpression
40 nM of miR-16 RNA duplex was transfected into AGO1–4−/− -FHAGO2 ESCs using Lipofectamine RNAiMAX (ThermoFisher) for 48 hr. The cells were fractionated into cytoplasmic and nuclear fraction. RNA was isolated and sequenced from half of each sample. From the remaining half of the lysates, AGO2 was immunoprecipitated and the bound miRNAs were sequenced, as described above.
Conservation Analysis
The conservation analysis (all introns, Figure S3C) was based on the phyloP scores publicly available on the UCSC’s genome browser website, generated from the whole genome alignment of seven species (Human, Chimp, Rhesus, Dog, Mouse, Rat, and Opossum). As these scores are human genome based (hg38), it was necessary to convert the mouse coordinates (mm10) of our data to the human ones, which we achieved with the help of USCS’ liftOver program. Not every genomic mouse sequence can be equivalently mapped to the human genome. In our particular analysis, 1459 of 3005 mouse binding site sequences can be ‘lifted’ to the human genome. Data are binned to facilitate generating random control sequences with matched expression distribution (RPKM) and di-nucleotide content distribution. RPKM values are from our RNaseq data (nuclear fraction). Di-nucleotide composition for each sequence is calculated using Bedtools. The expression distribution matching is performed between the target genes with intron binding site and non-target genes. The di-nucleotide content distribution matching is performed between the intron binding sites and the introns of non-target genes with a matched expression distribution. The expression-distribution matched (Wilcox test p value: 0.3047) non-target gene introns and the di-nucleotide-content-distribution matched (p value: 0.0903) non-target introns are the sources for generating the random control sequences (five sets each).
No target
The ‘no target’ mRNAs were those mRNAs that were expressed in the wild-type samples (with a mean rpkm > 0) but without an associated PAR-CLIP AGO2 binding site. They also passed our selection criteria for genes to be included in the CDF plot analysis:
−10 < Fold Change < 10, Name recognized by hg19, Gene size > 500 nt and Mean RPKM in the wild-type > 5.
Table.
ShRNA against CNOT1 and CNOT7
| Control | |
| Non-target | GCGCGATAGCGCTAATAATTT |
| CNOT1 | |
| #1 | CAGTTATTTCCAGCGAATATA |
| #2 | TGGTTAGGAATGATCACATTA |
| #3 | TGGTTAGGAATGATCACATTA |
| CNOT7 | |
| #1 | GCGGTGTAATGTAGACTTGTT |
| #2 | GAACGT CAACTTGGCAGTTTA |
| #3 | GCTCGGACTGACCTTTATGAA |
Table.
Gene-Specific Primers
| NEAT1 F | GGCAGGTCTAGTTTGGGCAT |
| NEAT1 R | CCTCATCCCTCCCAGTACCA |
| Brachyury F | GCTTCAAGGAGCTAACTAA |
| Brachyury R | CCAGCAAGAAAGAGTACAT |
Supplementary Material
KEY RESOURCES TABLE
| REAGENT or RESOURCE | SOURCE | IDENTIFIER |
|---|---|---|
| Antibodies | ||
| Rabbit polyclonal AGO2 | Abcam | RRID:AB_867543; Cat # ab32381 |
| Rabbit polyclonal AGO2 | Abcam | RRID:AB_2230916; Cat# ab57113 |
| Rabbit polyclonal AGO2 (C3C6) | Cell Signaling Technology | #2897 |
| Rabbit polyclonal AGO2 (11A9) | EMD Millipore | MABE253 |
| Rabbit polyclonal AGO1 (D84G10) | Cell Signaling Technology | RRID:AB_2616013; Cat #5053 |
| Rabbit polyclonal AGO3 (D15D2) | Cell Signaling Technology | #5054 |
| Rabbit polyclonal AGO4 (D10F10) | Cell Signaling Technology | #6913 |
| Rabbit polyclonal Calreticulin | Cell Signaling Technology | RRID:AB_2275208; Cat #2891 |
| Rabbit polyclonal Lamin A/C (N-18) | Santa Cruz | RRID:AB_648152; Cat# sc-6215 |
| Rabbit polyclonal Histone H3 | Abcam | RRID:AB_302613; Cat# ab1791 |
| Rabbit polyclonal Actin (C4) | Santa Cruz | RRID:AB_2714189; Cat# sc-47778 |
| Mouse monoclonal FLAG M2 | Sigma Aldrich | RRID:AB_259529; Cat# F3165 |
| Mouse monoclonal HA.11 | BioLegend | RRID:AB_265007; Cat# 901502 |
| TNRC6B | Gunter Meister | Schraivogel et al., 2015 |
| Mouse monoclonal CNOT1 (1A10A11) | Proteintech | 66507–1-Ig |
| Rabbit polyclonal CNOT7 | Proteintech | RRID:AB_2245087; Cat# 14102–1-AP |
| Rabbit IgG | Abcam | RRID:AB_2687657; Cat# ab171870 |
| Biotin conjugated VCAM1 | Biolegend | RRID:AB_313204; Cat# 105703 |
| Pacific Blue-labeled Sca1 | Biolegend | RRID:AB_493274; Cat# 108119 |
| APC-labeled CD31 | Biolegend | RRID:AB_312916; Cat# 102509 |
| APC-labeled CD45 | Biolegend | RRID:AB_312976; Cat# 103111 |
| SYTOX Green | Thermo Fisher Scientific | S34860 |
| Alexa Fluor 594 Phalloidin | Thermo Fisher Scientific | RRID:AB_2315633; Cat# A12381 |
| Goat-anti rat Alexa 488 | Thermo Fisher Scientific | RRID:AB_141373; Cat# A11006 |
| 4’,6-diamidino-2-phenylindole | Thermo Fisher Scientific | RRID:AB_2629482; Cat# D1306 |
| Anti-FLAG M2 magnetic beads | Sigma Aldrich | RRID:AB_2637089; Cat# M8823 |
| Dynabeads Protein G | Thermo Fisher Scientific | 10004D |
| Bacterial and Virus Strains | ||
| DH5α competent cells | Thermo Fisher Scientific | 18265017 |
| Dam-/Dcm competent E. coli | NEB | C2925I |
| BL21-Gold(DE3)pLysS competent cells | Agilent | 230134 |
| Chemicals, Peptides, and Recombinant Proteins | ||
| Lipofectamine Stem | Thermo Fisher Scientific | STEM00001 |
| Lipofectamine 2000 | Thermo Fisher Scientific | 11668027 |
| Lipofectamine 3000 | Thermo Fisher Scientific | L3000001 |
| Insuline-Transferrin-Selenium | Thermo Fisher Scientific | 41400045 |
| ESGRO Leukaemia inhibitory factor [LIF] | EMD Millipore | ESG1107 |
| Rnl2(1–249)K227Q ligase | NEB | M0351S |
| Rnl1 ligase | NEB | M0204S |
| SuperScript III reverse transcriptase | Thermo Fisher Scientific | 18080044 |
| Platinum Taq DNA polymerase | Thermo Fisher Scientific | 10966018 |
| EmbryoMax 0.1% Gelatin Solution | EMD Millipore | ES-006-B |
| Protease Inhibitor | Roche | 11836170001 |
| TRIzol | Thermo Fisher Scientific | 15596026 |
| γ-32P-ATP | Perkin-Elmer | NEG002A500UC |
| T4 PNK kinase | NEB | M0201S |
| 4-Thiouridine | Sigma Aldrich | T4509 |
| RNaseT1 | Thermo Fisher Scientific | EN0541 |
| Alkaline Phosphatase, Calf intestinal (CIP) | NEB | M0290S |
| Proteinase K | Roche | 03450376103 |
| Urea-PAGE | National Diagnostics | EC-833 |
| 4-(2-aminoethyl) benzenesulfonyl fluoride hydrochloride (AEBSF) | Sigma Aldrich | A8456 |
| lysozyme | Thermo Fisher Scientific | 90082 |
| ClaI restriction enzyme | NEB | R0197S |
| Glutathione | Thermo Fisher Scientific | 78259 |
| Vitronectin | Thermo Fisher Scientific | A14700 |
| Versene solution | Thermo Fisher Scientific | 15040066 |
| paraformadehyde | Alfa Aesar | |
| Vectashield | Vector Laboratories | H-1000 |
| Critical Commercial Assays | ||
| NEBNext rRNA depletion kit | NEB | E6310S |
| NEBNext Ultra RNA library prep kit | NEB | E7530S |
| SkGM-2 BulletKit | Lonza | CC-3245 |
| ESGRO-2i medium | EMD Millipore | SF016–100 |
| ESGRO complete Accutase | EMD Millipore | SF006 |
| 3% PippinPrep | Sage Science | CSD3010 |
| Power SYBR Green PCR Master Mix | Thermo Fisher Scientific | 4368708 |
| NEBuilder HIFI DNA assembly kit | NEB | E5520S |
| Amicon Ultra-15 centrifugal filter unit | EMD Millipore | UFC900308 |
| Zeba spin desalting columns | Thermo Fisher Scientific | 89891 |
| Deposited Data | ||
| Raw and analyzed data | This paper | GEO: GSE108801 |
| Experimental Models: Cell Lines | ||
| HEK293 | ATCC | CRL-1573 |
| NTERA | ATCC | CRL-1973 |
| SHSY5Y | ATCC | CRL-2266 |
| AGO2−/− MEF | Alexander Tarakhovsky | Genes Dev. 2007 Aug 15;21(16): 1999–2004. |
| iPSC cell line NTCR-5 | NIH core facility | N/A |
| Human Skeletal Muscle Cells and Myoblasts | Lonza | CC-2561 |
| C2C12 | ATCC | CRL-1772 |
| Brachyury-GFP ESC | Gordon Keller | Development 2003 130: 4217–4227 |
| AGO1–4−-−FHAGO2 ESC | Philip Sharp, MIT | Zamudio et al., 2014 |
| Oligonucleotides | ||
| NEAT1 siRNA | Dharmacon | N-188237–01-0002 |
| Non-Targeting siRNA | Dharmacon | N-001210–01-05 |
| Primers PAR-CLIP, see table “Adapters and Primers Used for PAR-CLIP and Small RNA Library Construction” | This paper | N/A |
| Primers NEAT1, see table “ShRNA against CNOT1 and CNOT7” | This paper | N/A |
| NLS-GFP-FW 5′ -GTACCGAGCTCGGAT ATGccaaagaagaagcggaaggtcggtatccacggagt cccagcagccGTGAGCAAGGGCGAGG - 3’. | This paper | N/A |
| NLS-GFP-RW 5′’-ggcggcggcgatatcg CACTTGTACAGCTCGTCCAT -3′ | This paper | N/A |
| miR-16–3p UAGCAGCACGUAAAUAUUGGCG | Dharmacon | N/A |
| miR-16–5p CCAGUAUUAACUGUGCUGCUGA | Dharmacon | N/A |
| Recombinant DNA | ||
| VP5-Ago2-WT | Gunter Meister | Rüdel et al., 2011 |
| VP5-Ago2-Y529E | Gunter Meister | Rüdel et al., 2011 |
| mCLOVER-NLS-AGO2 | This paper | N/A |
| pNCS-mClover3 | Addgene | 74236 |
| FLAG-GST-T6B WT | Gunter Meister | Hauptmann et al., 2015 |
| FLAG-GST-T6B Mutant | Gunter Meister | Hauptmann et al., 2015 |
| psPAX2 | Addgene | 12260 |
| pMD2.G | Addgene | 12259 |
| pLKO.1 Non-target | Sigma Aldrich | SHC016 |
| pLKO.5 CNOT1–1 | Sigma Aldrich | TRCN0000238055 |
| pLKO.5 CNOT1–2 | Sigma Aldrich | TRCN0000238056 |
| pLKO.5 CNOT1–3 | Sigma Aldrich | TRCN0000238058 |
| pLKO.1 CNOT7–1 | Sigma Aldrich | TRCN0000095975 |
| pLKO.1 CNOT7–2 | Sigma Aldrich | TRCN0000095976 |
| pLKO.1 CNOT7–3 | Sigma Aldrich | TRCN0000095977 |
| Software and Algorithms | ||
| Cufflinks/Cuffdiff | Trapnell et al., 2012 | http://cole-trapnell-lab.github.io/cufflinks/cuffdiff/ |
| Tophat2 | Kim et al., 2013 | https://ccb.jhu.edu/software/tophat/index.shtml |
| PARalyzer | Corcoran et al., 2011 | https://www.genome.duke.edu/labs/ohler/research/PARalyzer/ |
| miRdb | http://www.mirdb.org | |
Highlights.
Nuclear AGO proteins in ESCs allow for the onset of differentiation
Nuclear RISC silences target RNAs in a miRNA-dependent manner
Nuclear miRNA target repertoire includes intronic, CDS, and 3′ UTR sequences
Nuclear RISC requires CCR4-NOT for RNA destabilization
ACKNOWLEDGMENTS
Work in the Hafner and Sartorelli groups is supported by the Intramural Research Program of the National Institute for Arthritis and Musculoskeletal and Skin Disease. A.A.S. acknowledges postdoctoral funding from the Swedish Research Council. We thank the NIAMS Genomics and Flow Cytometry Core Facilities and Gustavo Gutierrez-Cruz, James Simone, and Dr. Stefania Dell’Orso (NIAMS/NIH) for sequencing and flow cytometry support. We thank the NIDDK Mass Spectrometry Core Facility and Dr. David Eric Anderson (NIDDK/NIH). The AGO1–4−/− -FHAGO2 ESC line was a kind gift from Dr. Philip Sharp (MIT), and we acknowledge the help of Dr. Timothy Kelly (Novartis) with advice regarding these cells. The FLAG-GST-T6B peptide, AGO2-Y529E, and AGO2-WT plasmids, as well as the TNRC6B antibody, were a kind gift from Dr. Gunter Meister (University of Regensburg). The Brachyury-GFP ESC line was a gift from Dr. Gordon Keller (University Health Network, Toronto). Lentiviral plasmids PsPAx2 and pMD2G were a kind gift from Dr. Chrysi Kanellopoulou (NIAID/NIH). We also thank Dr. Daniel Benhalevy (NIAMS/NIH) for help with data analysis and Dr. Davide Angeletti (NIAID/NIH) for technical support. PAR-CLIP sequencing data and RNAseq data are available on the NCBI Short-Read Archive (SRA) under the accession number GEO:GSE108801.
Footnotes
SUPPLEMENTAL INFORMATION
Supplemental Information includes four figures and four tables and can be found with this article at https://doi.org/10.1016/j.molcel.2018.07.020.
DECLARATION OF INTERESTS
The authors declare no competing interests.
REFERENCES
- Agarwal V, Bell GW, Nam J-W, and Bartel DP (2015). Predicting effective microRNA target sites in mammalian mRNAs. eLife 4, e05005. [DOI] [PMC free article] [PubMed] [Google Scholar]
- Ahlenstiel CL, Lim HGW, Cooper DA, Ishida T, Kelleher AD, and Suzuki K (2012). Direct evidence of nuclear Argonaute distribution during transcriptional silencing links the actin cytoskeleton to nuclear RNAi machinery in human cells. Nucleic Acids Res. 40, 1579–1595. [DOI] [PMC free article] [PubMed] [Google Scholar]
- Alberti C, and Cochella L (2017). A framework for understanding the roles of miRNAs in animal development. Development 144, 2548–2559. [DOI] [PubMed] [Google Scholar]
- Alló M, Agirre E, Bessonov S, Bertucci P, Gómez Acuña L, Buggiano V, Bellora N, Singh B, Petrillo E, Blaustein M, et al. (2014). Argonaute-1 binds transcriptional enhancers and controls constitutive and alternative splicing in human cells. Proc. Natl. Acad. Sci. USA 111, 15622–15629. [DOI] [PMC free article] [PubMed] [Google Scholar]
- Ascano M Jr., Mukherjee N, Bandaru P, Miller JB, Nusbaum JD, Corcoran DL, Langlois C, Munschauer M, Dewell S, Hafner M, et al. (2012). FMRP targets distinct mRNA sequence elements to regulate protein expression. Nature 492, 382–386. [DOI] [PMC free article] [PubMed] [Google Scholar]
- Bartel DP (2004). MicroRNAs: genomics, biogenesis, mechanism, and function. Cell 116, 281–297. [DOI] [PubMed] [Google Scholar]
- Bartel DP (2009). MicroRNAs: target recognition and regulatory functions. Cell 136, 215–233. [DOI] [PMC free article] [PubMed] [Google Scholar]
- Bartel DP (2018). Metazoan MicroRNAs. Cell 173, 20–51. [DOI] [PMC free article] [PubMed] [Google Scholar]
- Benhalevy D, McFarland HL, Sarshad AA, and Hafner M (2017). PAR-CLIP and streamlined small RNA cDNA library preparation protocol for the identification of RNA binding protein target sites. Methods 118–119, 41–49. [DOI] [PMC free article] [PubMed] [Google Scholar]
- Benhamed M, Herbig U, Ye T, Dejean A, and Bischof O (2012). Senescence is an endogenous trigger for microRNA-directed transcriptional gene silencing in human cells. Nat. Cell Biol. 14, 266–275. [DOI] [PMC free article] [PubMed] [Google Scholar]
- Betel D, Wilson M, Gabow A, Marks DS, and Sander C (2008). The microRNA.org resource: targets and expression. Nucleic Acids Res. 36, D149–D153. [DOI] [PMC free article] [PubMed] [Google Scholar]
- Betel D, Koppal A, Agius P, Sander C, and Leslie C (2010). Comprehensive modeling of microRNA targets predicts functional nonconserved and non-canonical sites. Genome Biol. 11, R90. [DOI] [PMC free article] [PubMed] [Google Scholar]
- Bhattacharyya SN, and Filipowicz W (2007). Argonautes and company: sailing against the wind. Cell 128, 1027–1028. [DOI] [PubMed] [Google Scholar]
- Bissels U, Wild S, Tomiuk S, Holste A, Hafner M, Tuschl T, and Bosio A (2009). Absolute quantification of microRNAs by using a universal reference. RNA 15, 2375–2384. [DOI] [PMC free article] [PubMed] [Google Scholar]
- Boersema PJ, Raijmakers R, Lemeer S, Mohammed S, and Heck AJR (2009). Multiplex peptide stable isotope dimethyl labeling for quantitative proteomics. Nat. Protoc 4, 484–494. [DOI] [PubMed] [Google Scholar]
- Braun JE, Huntzinger E, Fauser M, and Izaurralde E (2011). GW182 proteins directly recruit cytoplasmic deadenylase complexes to miRNA targets. Mol. Cell 44, 120–133. [DOI] [PubMed] [Google Scholar]
- Chekulaeva M, Mathys H, Zipprich JT, Attig J, Colic M, Parker R, and Filipowicz W (2011). miRNA repression involves GW182-mediated recruitment of CCR4-NOT through conserved W-containing motifs. Nat. Struct. Mol. Biol 18, 1218–1226. [DOI] [PMC free article] [PubMed] [Google Scholar]
- Cheung TH, Quach NL, Charville GW, Liu L, Park L, Edalati A, Yoo B, Hoang P, and Rando TA (2012). Maintenance of muscle stem-cell quiescence by microRNA-489. Nature 482, 524–528. [DOI] [PMC free article] [PubMed] [Google Scholar]
- Chi SW, Zang JB, Mele A, and Darnell RB (2009). Argonaute HITS-CLIP decodes microRNA-mRNA interaction maps. Nature 460, 479–486. [DOI] [PMC free article] [PubMed] [Google Scholar]
- Conti L, Pollard SM, Gorba T, Reitano E, Toselli M, Biella G, Sun Y, Sanzone S, Ying Q-L, Cattaneo E, and Smith A (2005). Niche-independent symmetrical self-renewal of a mammalian tissue stem cell. PLoS Biol 3, e283. [DOI] [PMC free article] [PubMed] [Google Scholar]
- Corcoran DL, Georgiev S, Mukherjee N, Gottwein E, Skalsky RL, Keene JD, and Ohler U (2011). PARalyzer: definition of RNA binding sites from PAR-CLIP short-read sequence data. Genome Biol. 12, R79. [DOI] [PMC free article] [PubMed] [Google Scholar]
- Cox J, and Mann M (2008). MaxQuant enables high peptide identification rates, individualized p.p.b.-range mass accuracies and proteome-wide protein quantification. Nat. Biotechnol 26, 1367–1372. [DOI] [PubMed] [Google Scholar]
- Danan C, Manickavel S, and Hafner M (2016). PAR-CLIP: a method for transcriptome-wide identification of RNA binding protein interaction sites. Methods Mol. Biol 1358, 153–173. [DOI] [PMC free article] [PubMed] [Google Scholar]
- Ding J, Huang X, Shao N, Zhou H, Lee D-F, Faiola F, Fidalgo M, Guallar D, Saunders A, Shliaha PV, et al. (2015). Tex10 coordinates epigenetic control of super-enhancer activity in pluripotency and reprogramming. Cell Stem Cell 16, 653–668. [DOI] [PMC free article] [PubMed] [Google Scholar]
- Easow G, Teleman AA, and Cohen SM (2007). Isolation of microRNA targets by miRNP immunopurification. RNA 13, 1198–1204. [DOI] [PMC free article] [PubMed] [Google Scholar]
- Enright AJ, John B, Gaul U, Tuschl T, Sander C, and Marks DS (2003). MicroRNA targets in Drosophila. Genome Biol 5, R1. [DOI] [PMC free article] [PubMed] [Google Scholar]
- Fabian MR, Cieplak MK, Frank F, Morita M, Green J, Srikumar T, Nagar B, Yamamoto T, Raught B, Duchaine TF, and Sonenberg N (2011). miRNA-mediated deadenylation is orchestrated by GW182 through two conserved motifs that interact with CCR4-NOT. Nat. Struct. Mol. Biol 18, 1211–1217. [DOI] [PubMed] [Google Scholar]
- Fang Z, and Rajewsky N (2011). The impact of miRNA target sites in coding sequences and in 3’UTRs. PLoS ONE 6, e18067. [DOI] [PMC free article] [PubMed] [Google Scholar]
- Farazi TA, Horlings HM, Ten Hoeve JJ, Mihailovic A, Halfwerk H, Morozov P, Brown M, Hafner M, Reyal F, van Kouwenhove M, et al. (2011). MicroRNA sequence and expression analysis in breast tumors by deep sequencing. Cancer Res. 71, 4443–4453. [DOI] [PMC free article] [PubMed] [Google Scholar]
- Fehling HJ, Lacaud G, Kubo A, Kennedy M, Robertson S, Keller G, and Kouskoff V (2003). Tracking mesoderm induction and its specification to the hemangioblast during embryonic stem cell differentiation. Development 130, 4217–4227. [DOI] [PubMed] [Google Scholar]
- Filipowicz W (2005). RNAi: the nuts and bolts of the RISC machine. Cell 122, 17–20. [DOI] [PubMed] [Google Scholar]
- Filipowicz W, Bhattacharyya SN, and Sonenberg N (2008). Mechanisms of post-transcriptional regulation by microRNAs: are the answers in sight? Nat. Rev. Genet 9, 102–114. [DOI] [PubMed] [Google Scholar]
- Friedman RC, Farh KK-H, Burge CB, and Bartel DP (2009). Most mammalian mRNAs are conserved targets of microRNAs. Genome Res 19, 92–105. [DOI] [PMC free article] [PubMed] [Google Scholar]
- Gagnon KT, Li L, Chu Y, Janowski BA, and Corey DR (2014a). RNAi factors are present and active in human cell nuclei. Cell Rep 6, 211–221. [DOI] [PMC free article] [PubMed] [Google Scholar]
- Gagnon KT, Li L, Janowski BA, and Corey DR (2014b). Analysis of nuclear RNA interference in human cells by subcellular fractionation and Argonaute loading. Nat. Protoc 9, 2045–2060. [DOI] [PMC free article] [PubMed] [Google Scholar]
- Gangaraju VK, and Lin H (2009). MicroRNAs: key regulators of stem cells. Nat. Rev. Mol. Cell Biol 10, 116–125. [DOI] [PMC free article] [PubMed] [Google Scholar]
- Grewal SI (2010). RNAi-dependent formation of heterochromatin and its diverse functions. Curr. Opin. Genet. Dev 20, 134–141. [DOI] [PMC free article] [PubMed] [Google Scholar]
- Grimm D (2011). The dose can make the poison: lessons learned from adverse in vivo toxicities caused by RNAi overexpression. Silence 2, 8. [DOI] [PMC free article] [PubMed] [Google Scholar]
- Grimson A, Farh KK-H, Johnston WK, Garrett-Engele P, Lim LP, and Bartel DP (2007). MicroRNA targeting specificity in mammals: determinants beyond seed pairing. Mol. Cell 27, 91–105. [DOI] [PMC free article] [PubMed] [Google Scholar]
- Grosswendt S, Filipchyk A, Manzano M, Klironomos F, Schilling M, Herzog M, Gottwein E, and Rajewsky N (2014). Unambiguous identification of miRNA:target site interactions by different types of ligation reactions. Mol. Cell 54, 1042–1054. [DOI] [PMC free article] [PubMed] [Google Scholar]
- Hafner M, Landthaler M, Burger L, Khorshid M, Hausser J, Berninger P, Rothballer A, Ascano M Jr., Jungkamp A-C, Munschauer M, et al. (2010). Transcriptome-wide identification of RNA-binding protein and microRNA target sites by PAR-CLIP. Cell 141, 129–141. [DOI] [PMC free article] [PubMed] [Google Scholar]
- Hafner M, Renwick N, Farazi TA, Mihailović A, Pena JTG, and Tuschl T (2012). Barcoded cDNA library preparation for small RNA profiling by next-generation sequencing. Methods 58, 164–170. [DOI] [PMC free article] [PubMed] [Google Scholar]
- Hauptmann J, Schraivogel D, Bruckmann A, Manickavel S, Jakob L, Eichner N, Pfaff J, Urban M, Sprunck S, Hafner M, et al. (2015). Biochemical isolation of Argonaute protein complexes by Ago-APP. Proc. Natl. Acad. Sci. USA 112, 11841–11845. [DOI] [PMC free article] [PubMed] [Google Scholar]
- Helwak A, Kudla G, Dudnakova T, and Tollervey D (2013). Mapping the human miRNA interactome by CLASH reveals frequent noncanonical binding. Cell 153, 654–665. [DOI] [PMC free article] [PubMed] [Google Scholar]
- Hendrickson DG, Hogan DJ, Herschlag D, Ferrell JE, and Brown PO (2008). Systematic identification of mRNAs recruited to argonaute 2 by specific microRNAs and corresponding changes in transcript abundance. PLoS ONE 3, e2126. [DOI] [PMC free article] [PubMed] [Google Scholar]
- Höck J, and Meister G (2008). The Argonaute protein family. Genome Biol 9 Published online February 26, 2008 10.1186/gb-2008-9-2-210. [DOI] [PMC free article] [PubMed] [Google Scholar]
- Huang V, Zheng J, Qi Z, Wang J, Place RF, Yu J, Li H, and Li L-C (2013). Ago1 Interacts with RNA polymerase II and binds to the promoters of actively transcribed genes in human cancer cells. PLoS Genet 9, e1003821. [DOI] [PMC free article] [PubMed] [Google Scholar]
- Hutvagner G, and Simard MJ (2008). Argonaute proteins: key players in RNA silencing. Nat. Rev. Mol. Cell Biol. 9, 22–32. [DOI] [PubMed] [Google Scholar]
- Iwasaki YW, Siomi MC, and Siomi H (2015). PIWI-interacting RNA: its biogenesis and functions. Annu. Rev. Biochem 84, 405–433. [DOI] [PubMed] [Google Scholar]
- Janowski BA, Huffman KE, Schwartz JC, Ram R, Nordsell R, Shames DS, Minna JD, and Corey DR (2006). Involvement of AGO1 and AGO2 in mammalian transcriptional silencing. Nat. Struct. Mol. Biol 13, 787–792. [DOI] [PubMed] [Google Scholar]
- Kim D, Pertea G, Trapnell C, Pimentel H, Kelley R, and Salzberg SL (2013). TopHat2: accurate alignment of transcriptomes in the presence of insertions, deletions and gene fusions. Genome Biol. 14, R36. [DOI] [PMC free article] [PubMed] [Google Scholar]
- Kiriakidou M, Nelson PT, Kouranov A, Fitziev P, Bouyioukos C, Mourelatos Z, and Hatzigeorgiou A (2004). A combined computational-experimental approach predicts human microRNA targets. Genes Dev 18, 1165–1178. [DOI] [PMC free article] [PubMed] [Google Scholar]
- Kloosterman WP, and Plasterk RHA (2006). The diverse functions of microRNAs in animal development and disease. Dev. Cell 11, 441–450. [DOI] [PubMed] [Google Scholar]
- Krek A, Grün D, Poy MN, Wolf R, Rosenberg L, Epstein EJ, MacMenamin P, da Piedade I, Gunsalus KC, Stoffel M, and Rajewsky N (2005). Combinatorial microRNA target predictions. Nat. Genet 37, 495–500. [DOI] [PubMed] [Google Scholar]
- Kubo A, Shinozaki K, Shannon JM, Kouskoff V, Kennedy M, Woo S, Fehling HJ, and Keller G (2004). Development of definitive endoderm from embryonic stem cells in culture. Development 131, 1651–1662. [DOI] [PubMed] [Google Scholar]
- Kulak NA, Pichler G, Paron I, Nagaraj N, and Mann M (2014). Minimal, encapsulated proteomic-sample processing applied to copy-number estimation in eukaryotic cells. Nat. Methods 11, 319–324. [DOI] [PubMed] [Google Scholar]
- Kuppusamy KT, Sperber H, and Ruohola-Baker H (2013). MicroRNA regulation and role in stem cell maintenance, cardiac differentiation and hypertrophy. Curr. Mol. Med 13, 757–764. [DOI] [PMC free article] [PubMed] [Google Scholar]
- Lai EC (2002). Micro RNAs are complementary to 3′ UTR sequence motifs that mediate negative post-transcriptional regulation. Nat. Genet 30, 363–364. [DOI] [PubMed] [Google Scholar]
- Lakshmipathy U, Davila J, and Hart RP (2010). miRNA in pluripotent stem cells. Regen. Med 5, 545–555. [DOI] [PMC free article] [PubMed] [Google Scholar]
- Lee RC, Feinbaum RL, and Ambros V (1993). The C. elegans hetero-chronic gene lin-4 encodes small RNAs with antisense complementarity to lin-14. Cell 75, 843–854. [DOI] [PubMed] [Google Scholar]
- Lennox KA, and Behlke MA (2016). Cellular localization of long non-coding RNAs affects silencing by RNAi more than by antisense oligonucleotides. Nucleic Acids Res 44, 863–877. [DOI] [PMC free article] [PubMed] [Google Scholar]
- Lewis BP, Shih IH, Jones-Rhoades MW, Bartel DP, and Burge CB (2003). Prediction of mammalian microRNA targets. Cell 115, 787–798. [DOI] [PubMed] [Google Scholar]
- Lewis BP, Burge CB, and Bartel DP (2005). Conserved seed pairing, often flanked by adenosines, indicates that thousands of human genes are microRNA targets. Cell 120, 15–20. [DOI] [PubMed] [Google Scholar]
- Li L-C, Okino ST, Zhao H, Pookot D, Place RF, Urakami S, Enokida H, and Dahiya R (2006). Small dsRNAs induce transcriptional activation in human cells. Proc. Natl. Acad. Sci. USA 103, 17337–17342. [DOI] [PMC free article] [PubMed] [Google Scholar]
- Lin Y, Huo L, Liu Z, Li J, Liu Y, He Q, Wang X, and Liang S (2013). Sodium laurate, a novel protease- and mass spectrometry-compatible detergent for mass spectrometry-based membrane proteomics. PLoS ONE 8, e59779. [DOI] [PMC free article] [PubMed] [Google Scholar]
- Liu J, Hu J, and Corey DR (2012). Expanding the action of duplex RNAs into the nucleus: redirecting alternative splicing. Nucleic Acids Res 40, 1240–1250. [DOI] [PMC free article] [PubMed] [Google Scholar]
- Liu L, Cheung TH, Charville GW, and Rando TA (2015). Isolation of skeletal muscle stem cells by fluorescence-activated cell sorting. Nat. Protoc 10, 1612–1624. [DOI] [PMC free article] [PubMed] [Google Scholar]
- Mathieu J, and Ruohola-Baker H (2013). Regulation of stem cell populations by microRNAs In Systems Biology of RNA Binding Proteins, Yeo GW, ed. (Dordrecht: Springer Netherlands; ), pp. 329–351. [DOI] [PMC free article] [PubMed] [Google Scholar]
- Meister G, and Tuschl T (2004). Mechanisms of gene silencing by double-stranded RNA. Nature 431, 343–349. [DOI] [PubMed] [Google Scholar]
- Oesterreich FC, Herzel L, Straube K, Hujer K, Howard J, and Neugebauer KM (2016). Splicing of Nascent RNA Coincides with Intron Exit from RNA Polymerase II. Cell 165, 372–381. [DOI] [PMC free article] [PubMed] [Google Scholar]
- Ohrt T, Mütze J, Staroske W, Weinmann L, Höck J, Crell K, Meister G, and Schwille P (2008). Fluorescence correlation spectroscopy and fluorescence cross-correlation spectroscopy reveal the cytoplasmic origination of loaded nuclear RISC in vivo in human cells. Nucleic Acids Res. 36, 6439–6449. [DOI] [PMC free article] [PubMed] [Google Scholar]
- Pratt AJ, and MacRae IJ (2009). The RNA-induced silencing complex: a versatile gene-silencing machine. J. Biol. Chem 284, 17897–17901. [DOI] [PMC free article] [PubMed] [Google Scholar]
- Rüdel S, Wang Y, Lenobel R, Körner R, Hsiao H-H, Urlaub H, Patel D, and Meister G (2011). Phosphorylation of human Argonaute proteins affects small RNA binding. Nucleic Acids Res. 39, 2330–2343. [DOI] [PMC free article] [PubMed] [Google Scholar]
- Schraivogel D, and Meister G (2014). Import routes and nuclear functions of Argonaute and other small RNA-silencing proteins. Trends Biochem. Sci 39, 420–431. [DOI] [PubMed] [Google Scholar]
- Schraivogel D, Schindler SG, Danner J, Kremmer E, Pfaff J, Hannus S, Depping R, and Meister G (2015). Importin-β facilitates nuclear import of human GW proteins and balances cytoplasmic gene silencing protein levels. Nucleic Acids Res. 43, 7447–7461. [DOI] [PMC free article] [PubMed] [Google Scholar]
- Schwartz JC, Younger ST, Nguyen N-B, Hardy DB, Monia BP, Corey DR, and Janowski BA (2008). Antisense transcripts are targets for activating small RNAs. Nat. Struct. Mol. Biol 15, 842–848. [DOI] [PMC free article] [PubMed] [Google Scholar]
- Sharma NR, Wang X, Majerciak V, Ajiro M, Kruhlak M, Meyers C, and Zheng Z-M (2015). Cell-type and tissue context-dependent nuclear distribution of human Ago2. J. Biol. Chem 291, 2302–2309. [DOI] [PMC free article] [PubMed] [Google Scholar]
- Sontheimer EJ (2005). Assembly and function of RNA silencing complexes. Nat. Rev. Mol. Cell Biol. 6, 127–138. [DOI] [PubMed] [Google Scholar]
- Stark A, Brennecke J, Russell RB, and Cohen SM (2003). Identification of Drosophila microRNA targets. PLoS Biol. 1, E60. [DOI] [PMC free article] [PubMed] [Google Scholar]
- Su H, Trombly MI, Chen J, and Wang X (2009). Essential and overlapping functions for mammalian Argonautes in microRNA silencing. Genes Dev. 23, 304–317. [DOI] [PMC free article] [PubMed] [Google Scholar]
- Tay Y, Zhang J, Thomson AM, Lim B, and Rigoutsos I (2008). MicroRNAs to Nanog, Oct4 and Sox2 coding regions modulate embryonic stem cell differentiation. Nature 455, 1124–1128. [DOI] [PubMed] [Google Scholar]
- Thomson M, Liu SJ, Zou L-N, Smith Z, Meissner A, and Ramanathan S (2011). Pluripotency factors in embryonic stem cells regulate differentiation into germ layers. Cell 145, 875–889. [DOI] [PMC free article] [PubMed] [Google Scholar]
- Trapnell C, Roberts A, Goff L, Pertea G, Kim D, Kelley DR, Pimentel H, Salzberg SL, Rinn JL, and Pachter L (2012). Differential gene and transcript expression analysis of RNA-seq experiments with TopHat and Cufflinks. Nat. Protoc 7, 562–578. [DOI] [PMC free article] [PubMed] [Google Scholar]
- Trapnell C, Hendrickson DG, Sauvageau M, Goff L, Rinn JL, and Pachter L (2013). Differential analysis of gene regulation at transcript resolution with RNA-seq. Nat. Biotechnol 31, 46–53. [DOI] [PMC free article] [PubMed] [Google Scholar]
- Wang X (2016). Improving microRNA target prediction by modeling with unambiguously identified microRNA-target pairs from CLIP-ligation studies. Bioinformatics 32, 1316–1322. [DOI] [PMC free article] [PubMed] [Google Scholar]
- Wang AH, Juan AH, Ko KD, Tsai P-F, Zare H, Dell’Orso S, and Sartorelli V (2017). The elongation factor Spt6 maintains ESC pluripotency by controlling super-enhancers and counteracting polycomb proteins. Mol. Cell 68, 398–413.e6. [DOI] [PMC free article] [PubMed] [Google Scholar]
- Yamaji M, Jishage M, Meyer C, Suryawanshi H, Der E, Yamaji M, Garzia A, Morozov P, Manickavel S, McFarland HL, et al. (2017). DND1 maintains germline stem cells via recruitment of the CCR4-NOT complex to target mRNAs. Nature 543, 568–572. [DOI] [PMC free article] [PubMed] [Google Scholar]
- Zamudio JR, Kelly TJ, and Sharp PA (2014). Argonaute-bound small RNAs from promoter-proximal RNA polymerase II. Cell 156, 920–934. [DOI] [PMC free article] [PubMed] [Google Scholar]
Associated Data
This section collects any data citations, data availability statements, or supplementary materials included in this article.