

Abstract
Amplification of the gene encoding Myeloid cell leukemia-1 (Mcl-1) is one of the most common genetic aberrations in human cancer and is associated with high tumor grade and poor survival. Recently, we reported on the discovery of high affinity Mcl-1 inhibitors that elicit mechanism-based cell activity. These inhibitors are lipophilic and contain an acidic functionality which is a common chemical profile for compounds that bind to Albumin in plasma. Indeed, these Mcl-1 inhibitors exhibited reduced in vitro cell activity in the presence of serum. Here we describe the structure of a lead Mcl-1 inhibitor when bound to Human Serum Albumin (HSA). Unlike many acidic lipophilic compounds that bind to drug site 1 or 2, we found that this Mcl-1 inhibitor binds predominantly to drug site 3. Site 3 of HSA may be able to accommodate larger, more rigid compounds that do not fit into the smaller drug site 1 or 2. Structural studies of molecules that bind to this third site may provide insight into how some higher molecular weight compounds bind to albumin and could be used to aid in the design of compounds with reduced albumin binding.
Keywords: Human Serum Albumin, Free Fraction, apoptosis, cancer, Mcl-1, drug discovery
Graphical Abstract
1. Introduction
Defects in apoptotic signaling are central to tumor initiation and maintenance of cancer cells, particularly when associated with unregulated tumor cell proliferation1–4. Amplification of the gene encoding the anti-apoptotic protein Myeloid cell leukemia-1 (Mcl-1) is one of the most common genetic aberrations in human cancer5. Mcl-1 over expression in human cancers is associated with high tumor grade and poor survival6. This suggests that inhibition of Mcl-1 could cause tumor cell death in Mcl-1-dependent cancers and cause an increase in sensitivity to many standard chemotherapeutics by releasing apoptotic restrictions.
Mcl-1 mediates its effects primarily through a protein-protein interaction and is difficult to target with small molecules7. Recently, we reported on ligands that bind tightly to Mcl-1 that are lipophilic and contain an acidic functionality8–11. Although these molecules bind tightly to Mcl-1, they also bind to albumin as suggested by their lower in vitro cell activity in the presence of 10% FBS and no measurable in vitro free fraction. To improve our series’ in vitro cell activity, we wanted to design Mcl-1 inhibitors with reduced binding to albumin. This was accomplished in the past when targeting the Bcl-2 family members Bcl-xl/Bcl-2 using a structure-based approach12. By comparing ligand binding to HSA and Bcl-xl, Bcl-2 family inhibitors were designed with a significant decrease in albumin binding. A similar approach was used for inhibitors of Methionine aminopeptidase-2 (MetAP2) which led to compounds with good cellular activity in both proliferation and methionine processing assays13. Many other studies have monitored ligand binding to plasma proteins to discover small molecules with reduced albumin binding14. For example, in the discovery of a series of DPP-IV inhibitors, a correlation between in vitro potency, plasma concentration and free fraction was observed15 that was used to guide inhibitor design.
Human Serum Albumin (HSA) binds multiple natural ligands in different sites. The endogenous ligands are typically acidic lipophilic compounds like fatty acids or bilirubin. Fatty acids have nine binding sites on albumin, and each are potential binding sites for drugs16, 17. Drugs have three major reported binding sites on albumin. Smaller drugs (molecular weight less than 500 Daltons) mostly bind to drug sites 1 or 2 with a few also binding to a third site near domain IB of albumin17. Larger, rigid, and extended, higher molecular weight ligands typically bind to a third site in domain IB. All three sites share common physical characteristics; a hydrophobic pocket near multiple basic residues, which helps explain the protein’s broad tolerance for a diverse group of lipophilic ligands which contain an acidic moiety.
Several compounds have been found that bind to site 3 of albumin16. However, the number of molecules that have been structurally characterized is much lower than to site 1 or 2 making further structural characterization of ligand binding to this site of broad interest. Additional structural data for this site would provide additional data to optimize QSAR models and for docking approaches to predict albumin binding of compounds18–20.
Here we report on the X-ray structure of an Mcl-1 inhibitor when bound to human serum albumin in an effort to understand how to reduce HSA interference for this class of compounds. We were surprised to find that this Mcl-1 inhibitor binds predominantly to HSA site 3. When we compared our structure to other ligands that bind to the same pocket, we observed common binding hot spots and interactions that stabilize complex formation. The structure of this ligand when bound to HSA is consistent with the SAR we obtained on the plasma binding of other members of this chemical series. These data may thus be used to help design new analogs with reduced HSA binding without affecting binding to Mcl-1.
2. Experimental
2.1. Chemistry
Preparation of compound 1 (Figure 1) was described previously11.
Figure 1.

Structures of compound 1, Bilirubin (Pdb ID: 2VUE), and Campothecin (Pdb ID: 4L9K) that bind to drug site 3 in domain 1B of albumin.
2.2. Purification of Human Serum Albumin
Albumin from human serum lyophilized powder and albumin human recombinant were purchased from Sigma-Aldrich. The protein was further purified by gel-filtration using S75 column chromatography.
HSA ligand free crystals were grown by sitting-drop vapor diffusion using a protein concentration of 100 mg/ml in 50 mM potassium phosphate (pH 7). The HSA compound 1 complexes were generated by soaking the ligand free crystals in mother liquor containing 2 mM compound 1 with 5% DMSO overnight.
2.3. X-ray Crystallography
Data were collected on the Life Sciences Collaborative Access Team (LS-CAT) 21-ID-D beamline at the Advanced Photon Source (APS), Argonne National Laboratory. The data were indexed, integrated and scaled with HKL2000. Using a previously determined HSA ligand free structure (PDB: 4K2C) as a starting model, phasing was done by molecular replacement21 with Phaser22 as implemented in CCP4. Refinement of the structural models were performed with Phenix, and included rounds of manual model building in COOT23. The complex was refined to resolution of 2.7 Å. The final model has Rwork/Rfree 0.21/0.27 and good stereochemistry (Table 2 Supplementary).
2.4. Graphics Software.
All figures were produced using the PyMOL Molecular Graphics System, version 1.7 (Schrödinger, LLC: New York, 2010).
2.5. Expression and Purification of Mcl-1
Mcl-1 (172–318), corresponding to the N-terminal portion of Mcl-1, with an MBP tag was used for the TR-FRET biochemical assays. The design, characterization and sequence of this construct have been described earlier8. Soluble protein was purified by Ni affinity chromatography.
2.6. Caspase Activation Assay
NCI-H929 cells were washed twice in RPMI 1640 without Fetal Bovine Serum (FBS), then dispensed in 96 well plates at 10,000 cells per mL in RPMI 1640 containing 0.05% Pluronic F-68 non-ionic surfactant (Thermo Fisher Scientific, Waltham MA) and 0, 1 or 10% FBS in white 96 well plates. Compound dose response curves were generated and added to the cells in their respective media. Plates are incubated with compound for 3 hours then Caspase-Glo (Promega, USA) reagent is added and incubated at room temperature in the dark, for 30 minutes. Luminescence is measured on a BioTek Cytation 3 (Winooski VT, USA) and the IC50 was determined using Graphpad Prism software ( San Diego, CA).
2.7. TR-FRET Binding experiments
Time resolved fluorescence resonance energy transfer (TR-FRET) based competitive binding assays were carried out in a 20 μL assay mixture in OptiPlate-384, White Opaque 384 well MicroPlates (Perkin Elmer, Waltham, MA). The assay mixture was composed of 1 nM recombinant, full length Mcl-1 fused to Maltose Binding Protein (MBP), 100 nM fluorescein isothiocyanate (FITC)) labeled Bak BH3 peptide (FITC-AHx-GQVGRQLAIIGDDINR-NH2); (GenScript USA Inc , Piscataway, NJ), and 1 nM Terbium (Tb) conjugated antibody directed against MBP (CisBio Bioassays, Bedford, MA) in an assay buffer composed of 4.52 mM monobasic potassium phosphate, 15.48 mM dibasic potassium phosphate, 1 mM sodium EDTA, 0.05% Pluronic F-68 detergent, 50 mM sodium chloride, and 1 mM DTT (pH 7.5). Compounds were added to the reaction mixture in DMSO. The final DMSO concentration was 0.25%. TR-FRET measurements were determined using a Biotek 3 multimode plate reader (Winooski VT, USA) at an excitation wavelength of 340 ± 30 nm, and dual excitation wavelegths of 520 ± 10 nm and 620 ± 10 nm. Delta F was determined by dividing the fluorescence at 520 nm by the fluorescence at 620 nm.
On each plate, wells containing the fluorescent peptide, Mcl-1-MBP protein, Terbium conjugated antibody, and vehicle (DMSO) served as a negative control. Wells containing peptide and antibody,in the absence of Mcl-1 protein served as a positive control for total displacement of peptide. For each compound, a dose response curve was generated by potting delta F values against compound concentration and the IC50 was determined using a four parameter logistic curve fit with Graphpad Prism software. The dissociation constant (Ki value) was derived from24:
where [I]50 is the concentration of the free inhibitor at 50% inhibition, [L]50 is the concentration of the free labeled ligand at 50% inhibition, [P]0 is the concentration of the free protein at 0% inhibition, Kd represents the dissociation constant of the FITC peptide probe. Experiments which determined the effect of albumin or bovine serum were performed in the same manner in assay buffer containing FBS, BSA, or HSA at the indicated concentration.
3. Results and Discussion
3.1. Shift in Activity due to Albumin/Serum Binding
Compound binding to serum proteins can cause shifts in biochemical and in vitro cell assays making interpretation of structure activity relationships (SAR) complicated15, 18, 20, 25, 26. To test the effect of adding Fetal Bovine Serum (FBS) or albumin on the apparent compound activity of compound 1, we performed a plasma shift assay. The plasma shift assay is a common method to ascertain interference from FBS by adding serum to an in vitro assay and then observing a change in the apparent affinity to the target due to compound sequestration by plasma proteins12, 13, 15, 25. The plasma shift assay can be quantified to help monitor changes to compound binding to plasma proteins such as albumin25, 27. Quantification can be useful (Supplementary Materials) but in most cases the fold shift in the presence and absence of albumin is all that is used to compare compounds in the same chemical series12, 15.
For compound 1 in the TR-FRET competition assay, we observed a shift in IC50 and apparent Ki for binding to the target, Mcl-1, of over 3 fold between no FBS and 1% FBS (Figure 2A). When we repeated this experiment using delipidated HSA or BSA at the approximate concentration of albumin found in FBS (i.e. from FBS suppliers analysis 1% FBS corresponds to 180 ug/ml BSA), and we found a nearly identical shift in apparent Ki (Table 1). This result is consistent with albumin being the major component in FBS that sequesters compound 1 and causes the right shift in the IC50 in the binding assay. We next tested what effect different amounts of FBS had on compound 1 in an in vitro cell based activity assay.
Figure 2.

In vitro biochemical assays of compound 1 showing titration curves with different amounts of FBS (0,1,10%). (A) TR-FRET binding and (B) Caspase activation in NCI-H929 cancer cells.
Table 1.
Compound characterization in biochemical and cell-based assays in the presence and absence of FBS or albumin.
| 1 | ||
|---|---|---|
| Ki (nM) TR-FRET Assay | Mcl-1 + 0%FBS | 0.5 |
| Mcl-1 + 1%FBS | 1.4 | |
| Mcl-1 + 200 μg/ml Bovine Serum Albumin | 1.5 | |
| Mcl-1 + 200 μg/ml Human Serum Albumin | 1.4 | |
| Predicted Albumin Ka (μM) | Equation 3 | 1.8 |
| Caspase 3/7 IC50 (μM) | H929 0% FBS | 0.1 |
| H929 1% FBS | 1.4 | |
| H929 10% FBS | 6.0 |
Based on the manufacturers analysis, the concentration of albumin in the lot used for these studies is 180 μg/ml at 1% FBS.
To test the effect of FBS on in vitro cell based activity, we used a caspase activation assay. Rapid caspase activation is a characteristic of on target Bcl-2 family inhibitors28–31 and for compound 1, we see robust caspase activation in less than 3 hours after dosing. We found that cells are more tolerant to different amounts of FBS in the caspase assay with a readout at 3 hours, than in a 24 or 72 hour proliferation assay. However, we still carefully normalized all of the data using DMSO as a control to reduce differences in capase activity due to changes in cell viability and changing serum conditions. As shown in Figure 2B when we dosed cells with different amount of FBS, we observed more than a fifty fold shift in EC50 in the caspase activation assay between 0% and 10% FBS. The pronounced shift in EC50 in this cell based assay is similar to the effect we observed in the biochemical binding assay (Figure 2A) and is consistent with the hypothesis that compound binding to serum proteins is what causes an increase in the EC50 needed to see a response in the cell based caspase activation assay. This experimental data demonstrates that serum protein binding is an important factor to consider in interpreting our compound SAR in cell based assays containing serum.
3.2. Structures of Compounds Binding to Site 3 of Human Serum Albumin
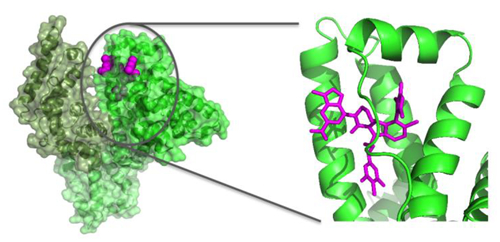
To help understand the structural basis for binding to albumin, we determined the structure of 1 bound to HSA. The three dimensional structure of compound 1 bound to Human Serum Albumin was obtained by X-ray crystallography. From the structure of compound 1 complexed to HSA (Figure 3A), we observed that this compound binds to site 3 in domain IB (Figure 3B). Some additional, but small volumes of unaccounted-for electron density (at the 3 sigma level) are present in site 2. The residual density was however poorly defined and a model for the ligand could not be built in this density. There are two HSA molecules in the asymmetric unit, and the electron density of the inhibitor in site 3 is present in both copies with a ligand occupancy in each copy of about 0.8.
Figure 3.

X-ray structures of compounds bound to Human Serum Albumin. (A) View of the full protein with color coding of domains and the observed binding site for compound 1 (magenta.). (B) Expanded view of compound 1 in drug binding site 3 in domain IB. (C) Comparison of 1 to bilirubin in binding site 3 (PDB ID: 2VUE). (D) Comparison of 1 to camptothecin in binding site 3 (Pdb ID: 4L9K).
The site 3 binding pocket in domain 1B of albumin is formed by four alpha helices and is covered by an extended loop (Figure 3A,B). The pocket consists of a mix of hydrophobic and polar residues, which enables it to recognize fatty acids as well as bilirubin and other larger acid containing lipophilic molecules. Compound 1 contains three parts (Figure 1) with different physical characteristics. The propyl linker and dimethyl chloro phenyl (region A in Figure 1) is the most hydrophobic and flexible part of the ligand and it packs against complementary hydrophobic residues of albumin near to residue I142. The top of the ligand containing the tri methyl pyrazole (region B) is a balance of polar hydrophilic and hydrophobic moieties. This region of the ligand is covered by loop L1 (115–118) of albumin. The hydrophobic loop residues, L115 and P118 sit above the ligand in the pocket, and the guanidine of R117 makes both polar and hydrophobic contacts with compound 1. Most of the pyrazole at the 7 position of the indole packs tightly against albumin with the exception of the 1 position at the top of the pyrazole which is partially exposed to solvent. The 6-Cl indole core sits in a more polar region of the pocket and is near to K137, Y161, and Y138. Finally, the indole acid headpiece (region C) is the most exposed part of the molecule when bound to albumin. The acid of the indole headpiece sits near R186 and R117 with most of the indole headpiece sitting at the edge of the cleft between domains IB and IIIB. The Arg residues near the ligand in the structure suggests that removal of the acid or changing its position could change the albumin binding affinity of the ligand.
In Figure 3(C,D), we compare the binding of our ligand to two other compounds that bind to site 3, Bilirubin (Figure 3C, PDB ID: 2VUE32) and Camptothecin (Figure 3D, Pdb ID: 4L9K17). Although very different in their physical characteristics, all of the ligands share common binding interactions. In the bilirubin (cyan) structure, the 3-methyl-4-vinyl-dihydro-pyrrol-2-one, binds into the same hydrophobic pocket near I142 as the dimethyl chloro phenyl of our Mcl-1 inhibitor. Bilirubin’s other 3-methyl-4-vinyl-dihydro-pyrrol-2-one overlaps with the 7-pyrazole of our ligand. The two acids of bilirubin interact with R186 and R117. Similar contacts are made by camptothecin. In camptothecin, the quinolone of the pentacyclic ring sits near residue I142 making a hydrophobic contact analogous to the dimethyl chloro phenyl of compound 1 and the 3-methyl-4-vinyl-dihydro-pyrrol-2-one of bilirubin. The hydroxyl and acid of camptothecin makes polar contacts to both R186 and R117 in a similar fashion as bilirubin and compound 1.
The binding motif of these three ligands share 2 common interactions with albumin. The first is hydrophobic burial of the ligand in the pocket around I142, which may serve as the hydrophobic hotspot that anchors ligands to Site 3. The second interaction, involves a polar contact to R186 and/or R117 which is also likely to be a common contact exploited by ligands that bind to site 3.
3.3. Species Differences in Binding Site 3 of Albumin
Rodent PK studies are generally used to help predict the PK in humans33. Differences in albumin from different species can however change drug binding in plasma and hence the PK in rodents versus humans17. We used a sequence alignment (Supplementary Material Table 3) between rodent and human albumin to compare the differences in the albumin binding sites. It can be seen from this alignment that the ligand contact residues in drug binding site I and 2 are mostly conserved. However, site 3 has two residues that are different in rodents and humans, R186K and I142V, both of which contact compound 1. These are conservative differences and when we tested our compound using albumin from rat serum and human albumin both at 200 μg/ml, we saw no significant difference in the plasma shift assay (data not shown).
3.4. Comparison to Ligand Binding to Mcl-1
Many of the features of compound 1 that contribute to binding to albumin are also important for binding to Mcl-18, 11. When compound 1 binds to Mcl-1 (Figure 4A PDB ID: 5IF4), the 6-Cl indole core of 1 binds to the top of the pocket in the BH3 binding groove of Mcl-1. The di-methyl chloro phenyl binds deeply into a lower pocket, which is formed by a ligand induced bend in Helix 4 (H4) which helps accommodate this group into the deep hydrophobic pocket. The top of H4 protrudes slightly into the BH3 binding cleft and causes the loop connecting H4−H5 to be pulled toward the ligand. The 7 indole di-methyl pyrazole substitution is oriented out of the indole plane with one of the methyls pointing to the P3 pocket. Much of the 7 position pyrazole substitution is exposed and could tolerate polar or larger groups. The lactam of 1 locks the peptide bond conformation and is used to attach the final indole acid headpiece of the molecule. The acid of the head piece points towards the backbone of a loop containing G257-V258 with the indole headpiece sitting over R263.
Figure 4.

Comparison of Ligand Binding to Mcl-1 and HSA. (A) Expanded view of compound 1 binding to the BH3 binding groove of Mcl-1 (Pdb ID:5IF4). (B) Superposition of compound 1 binding to Mcl-1 (blue compound, grey ribbon), and HSA drug binding site 3 in domain 1B (magenta compound beige ribbon). (C, D) Superposition of the ligand binding to Mcl-1 and HSA site 3, (C) showing the surface of Mcl-1 (D) showing the surface of HSA.
If the ligand structure of 4A is used to superimpose the Mcl-1 complex onto the albumin complex by using a pairwise fit of all ligand and no protein atoms, the superposition shown in Figure 4B is obtained. In both complexes, the di-methyl chloro phenyl of the ligand pushes deep into a hydrophobic pocket. In Mcl-1, this pocket is formed by helix 4 and 5 while in HSA the pocket is formed by helix 9 and 10 of site 3 domain IB. The propyl- di-methyl chloro phenyl of the ligand is flexible and adapts different binding poses in the hydrophobic pocket of Mcl-1 and HSA Site 3. The indole acid is also rotated in the HSA structure when compared to its pose in Mcl-1 (Figure 4B). This suggests that reducing the rotation of the headpiece could also decrease ligand binding to HSA.
In Figure 4C, a surface representation of Mcl-1 with the binding poses of the ligand when bound to Mcl-1 and albumin site 3 is displayed. This can be compared to the surface representation of albumin with the binding poses of the ligand when bound to Mcl-1 and site 3 in 4D. Compound 1 is more buried in albumin (4D) than in Mcl-1 (4C), suggesting that adding substituents to the ligand would reduce binding to albumin and if done correctly still enhance or maintain binding to Mcl-1. From the top down view of the protein’s surfaces, shown in Figure 4C,D, three areas of the ligand are evident that could potentially be used to create a steric hindrance to albumin binding. These are substitutions in the headpiece, lactam bridge or on the pyrazole of the ligand. We show in the Supplementary Material, earlier data on ligands with larger substitutions on the pyrazole. The improvement in plasma shift observed in these earlier compounds is consistent with our structural analysis of compound 1 binding to albumin.
4. Conclusion
We observed that the cell efficacy of compound 1 was reduced in in vitro binding and cell based assays in the presence of FBS or albumin. In order to help understand the structural basis of this interference, we determined the structure of compound 1 when bound to albumin and found that it binds to site 3 in domain IB. Site 3 is likely better suited to accommodate our compound because it is larger than the pockets in drug sites 1 and 2. The structure of compound 1 with HSA and with Mcl-1 was compared to identify the common and different binding features of the ligand to each individual protein. Even though HSA can adapt to many different ligands, a structural analysis can generally identify regions of the ligand that can be modified to reduce albumin binding and still maintain or improve binding to target12, 13. For our compound, we observed three potential regions that could be modified to reduce albumin binding while maintaining binding to Mcl-1.
Ligands binding to drug site 3 of HSA may be more common for larger more extended molecules. The structural data presented here adds to the knowledge base of preferences for this site and could be useful for the development of QSAR models and docking approaches to predict albumin binding of compounds to this site18, 19.
Supplementary Material
ACKNOWLEDGMENT
The authors thank co-workers at the High-Throughput Screening Core facility of Vanderbilt University, TN, for compound management. This research was supported by the NCI Experimental Therapeutics (NExT) Program BOA29XS129TO22 under the Leidos Biomed Prime Contract No. HHSN261200800001E, and a career development award to S.W.F. from a NCI SPORE grant in breast cancer (Grant P50CA098131) to C. L. Arteaga. Use of the Advanced Photon Source was supported by the U.S. Department of Energy, Office of Science, Office of Basic Energy Sciences, under Contract No. DE-AC02–06CH11357. A portion of the experiments described here used the Vanderbilt PacVan biomolecular robotic crystallization facility, which was supported by National Institutes of Health Grant S10 RR026915.
ABBREVIATIONS
- Mcl-1
myeloid cell leukemia 1
- HSA
Human Serum Albumin
- BSA
Bovine Serum Albumin
- FBS
Fetal Bovine Serum
- FITC
fluorescein isothiocyanate
- TR-FRET
Time Resolved Fluorescence Energy Transfer
References
- 1.Adams JM, Cory S. The Bcl-2 apoptotic switch in cancer development and therapy. Oncogene. 2007;26(9): 1324–1337. [DOI] [PMC free article] [PubMed] [Google Scholar]
- 2.Czabotar PE, Lessene G, Strasser A, Adams JM. Control of apoptosis by the BCL-2 protein family: implications for physiology and therapy. Nature reviews Molecular cell biology. 2014;15(1): 49–63. [DOI] [PubMed] [Google Scholar]
- 3.Danial NN, Korsmeyer SJ. Cell death: critical control points. Cell. 2004;116(2): 205–219. [DOI] [PubMed] [Google Scholar]
- 4.Hanahan D, Weinberg RA. Hallmarks of cancer: the next generation. Cell. 2011;144(5): 646–674. [DOI] [PubMed] [Google Scholar]
- 5.Beroukhim R, Mermel CH, Porter D, et al. The landscape of somatic copy-number alteration across human cancers. Nature. 2010;463(7283): 899–905. [DOI] [PMC free article] [PubMed] [Google Scholar]
- 6.Delbridge AR, Strasser A. The BCL-2 protein family, BH3-mimetics and cancer therapy. Cell death and differentiation. 2015;22(7): 1071–1080. [DOI] [PMC free article] [PubMed] [Google Scholar]
- 7.Arkin MR, Wells JA. Small-molecule inhibitors of protein-protein interactions: progressing towards the dream. Nature reviews Drug discovery. 2004;3(4): 301–317. [DOI] [PubMed] [Google Scholar]
- 8.Friberg A, Vigil D, Zhao B, et al. Discovery of potent myeloid cell leukemia 1 (Mcl-1) inhibitors using fragment-based methods and structure-based design. Journal of medicinal chemistry. 2013;56(1): 15–30. [DOI] [PMC free article] [PubMed] [Google Scholar]
- 9.Pelz NF, Bian Z, Zhao B, et al. Discovery of 2-Indole-acylsulfonamide Myeloid Cell Leukemia 1 (Mcl-1) Inhibitors Using Fragment-Based Methods. Journal of medicinal chemistry. 2016;59(5): 2054–2066. [DOI] [PMC free article] [PubMed] [Google Scholar]
- 10.Burke JP, Bian Z, Shaw S, et al. Discovery of tricyclic indoles that potently inhibit Mcl-1 using fragment-based methods and structure-based design. Journal of medicinal chemistry. 2015;58(9): 3794–3805. [DOI] [PMC free article] [PubMed] [Google Scholar]
- 11.Lee T, Bian Z, Zhao B, et al. Discovery and biological characterization of potent myeloid cell leukemia-1 inhibitors. FEBS letters. 2016. [DOI] [PMC free article] [PubMed] [Google Scholar]
- 12.Wendt MD, Shen W, Kunzer A, et al. Discovery and structure-activity relationship of antagonists of B-cell lymphoma 2 family proteins with chemopotentiation activity in vitro and in vivo. Journal of medicinal chemistry. 2006;49(3): 1165–1181. [DOI] [PubMed] [Google Scholar]
- 13.Sheppard GS, Wang JY, Kawai M, et al. Discovery and optimization of anthranilic acid sulfonamides as inhibitors of methionine aminopeptidase-2: A structural basis for the reduction of albumin binding. Journal of medicinal chemistry. 2006;49(13): 3832–3849. [DOI] [PubMed] [Google Scholar]
- 14.Bohnert T, Gan LS. Plasma protein binding: from discovery to development. Journal of pharmaceutical sciences. 2013;102(9): 2953–2994. [DOI] [PubMed] [Google Scholar]
- 15.Edmondson SD, Mastracchio A, Mathvink RJ, et al. (2S,3S)-3-Amino-4-(3,3-difluoropyrrolidin-1-yl)-N,N-dimethyl-4-oxo-2-(4-[1,2,4]tr iazolo[1,5-a]-pyridin-6-ylphenyl)butanamide: a selective alpha-amino amide dipeptidyl peptidase IV inhibitor for the treatment of type 2 diabetes. Journal of medicinal chemistry. 2006;49(12): 3614–3627. [DOI] [PubMed] [Google Scholar]
- 16.Ghuman J, Zunszain PA, Petitpas I, Bhattacharya AA, Otagiri M, Curry S. Structural basis of the drug-binding specificity of human serum albumin. Journal of molecular biology. 2005;353(1): 38–52. [DOI] [PubMed] [Google Scholar]
- 17.Wang ZM, Ho JX, Ruble JR, et al. Structural studies of several clinically important oncology drugs in complex with human serum albumin. Bba-Gen Subjects. 2013;1830(12): 5356–5374. [DOI] [PubMed] [Google Scholar]
- 18.Colmenarejo G, Alvarez-Pedraglio A, Lavandera JL. Cheminformatic models to predict binding affinities to human serum albumin. Journal of medicinal chemistry. 2001;44(25): 4370–4378. [DOI] [PubMed] [Google Scholar]
- 19.Vallianatou T, Lambrinidis G, Tsantili-Kakoulidou A. In silico prediction of human serum albumin binding for drug leads. Expert opinion on drug discovery. 2013;8(5): 583–595. [DOI] [PubMed] [Google Scholar]
- 20.Hall ML, Jorgensen WL, Whitehead L. Automated Ligand- and Structure-Based Protocol for in Silico Prediction of Human Serum Albumin Binding. J Chem Inf Model. 2013;53(4): 907–922. [DOI] [PubMed] [Google Scholar]
- 21.Carter CW, Sweet RM. Macromolecular crystallography. San Diego: Academic Press; 1997. [Google Scholar]
- 22.McCoy AJ, Grosse-Kunstleve RW, Adams PD, Winn MD, Storoni LC, Read RJ. Phaser crystallographic software. Journal of applied crystallography. 2007;40(Pt 4): 658–674. [DOI] [PMC free article] [PubMed] [Google Scholar]
- 23.Emsley P, Cowtan K. Coot: model-building tools for molecular graphics. Acta crystallographica Section D, Biological crystallography. 2004;60(Pt 12 Pt 1): 2126–2132. [DOI] [PubMed] [Google Scholar]
- 24.Nikolovska-Coleska Z, Wang R, Fang X, et al. Development and optimization of a binding assay for the XIAP BIR3 domain using fluorescence polarization. Analytical biochemistry. 2004;332(2): 261–273. [DOI] [PubMed] [Google Scholar]
- 25.Copeland RA. Determination of serum protein binding affinity of inhibitors from analysis of concentration-response plots in biochemical activity assays. Journal of pharmaceutical sciences. 2000;89(8): 1000–1007. [DOI] [PubMed] [Google Scholar]
- 26.Zhang F, Xue J, Shao J, Jia L. Compilation of 222 drugs’ plasma protein binding data and guidance for study designs. Drug discovery today. 2012;17(9–10): 475–485. [DOI] [PubMed] [Google Scholar]
- 27.Rusnak DW, Lai Z, Lansing TJ, Rhodes N, Gilmer TM, Copeland RA. A simple method for predicting serum protein binding of compounds from IC(50) shift analysis for in vitro assays. Bioorganic & medicinal chemistry letters. 2004;14(9): 2309–2312. [DOI] [PubMed] [Google Scholar]
- 28.Koss B, Ryan J, Budhraja A, et al. Defining specificity and on-target activity of BH3-mimetics using engineered B-ALL cell lines. Oncotarget. 2016. [DOI] [PMC free article] [PubMed] [Google Scholar]
- 29.Lessene G, Czabotar PE, Sleebs BE, et al. Structure-guided design of a selective BCL-X(L) inhibitor. Nature chemical biology. 2013;9(6): 390–397. [DOI] [PubMed] [Google Scholar]
- 30.Kitanaka C, Namiki T, Noguchi K, et al. Caspase-dependent apoptosis of COS-7 cells induced by Bax overexpression: differential effects of Bcl-2 and Bcl-xL on Bax-induced caspase activation and apoptosis. Oncogene. 1997;15(15): 1763–1772. [DOI] [PubMed] [Google Scholar]
- 31.McIlwain DR, Berger T, Mak TW. Caspase functions in cell death and disease. Cold Spring Harbor perspectives in biology. 2013;5(4): a008656. [DOI] [PMC free article] [PubMed] [Google Scholar]
- 32.Zunszain PA, Ghuman J, McDonagh AF, Curry S. Crystallographic analysis of human serum albumin complexed with 4Z,15E-bilirubin-IX alpha. Journal of molecular biology. 2008;381(2): 394–406. [DOI] [PMC free article] [PubMed] [Google Scholar]
- 33.Mahmood I Application of allometric principles for the prediction of pharmacokinetics in human and veterinary drug development. Adv Drug Deliver Rev. 2007;59(11): 1177–1192. [DOI] [PubMed] [Google Scholar]
Associated Data
This section collects any data citations, data availability statements, or supplementary materials included in this article.